FACT: Worldwide HIV/AIDS mortality has dropped by two-thirds since 2003.
THE NUMBERS: Eswatini life expectancy at birth –
20219 61
2005: 42
1990: 63
WHAT THEY MEAN:
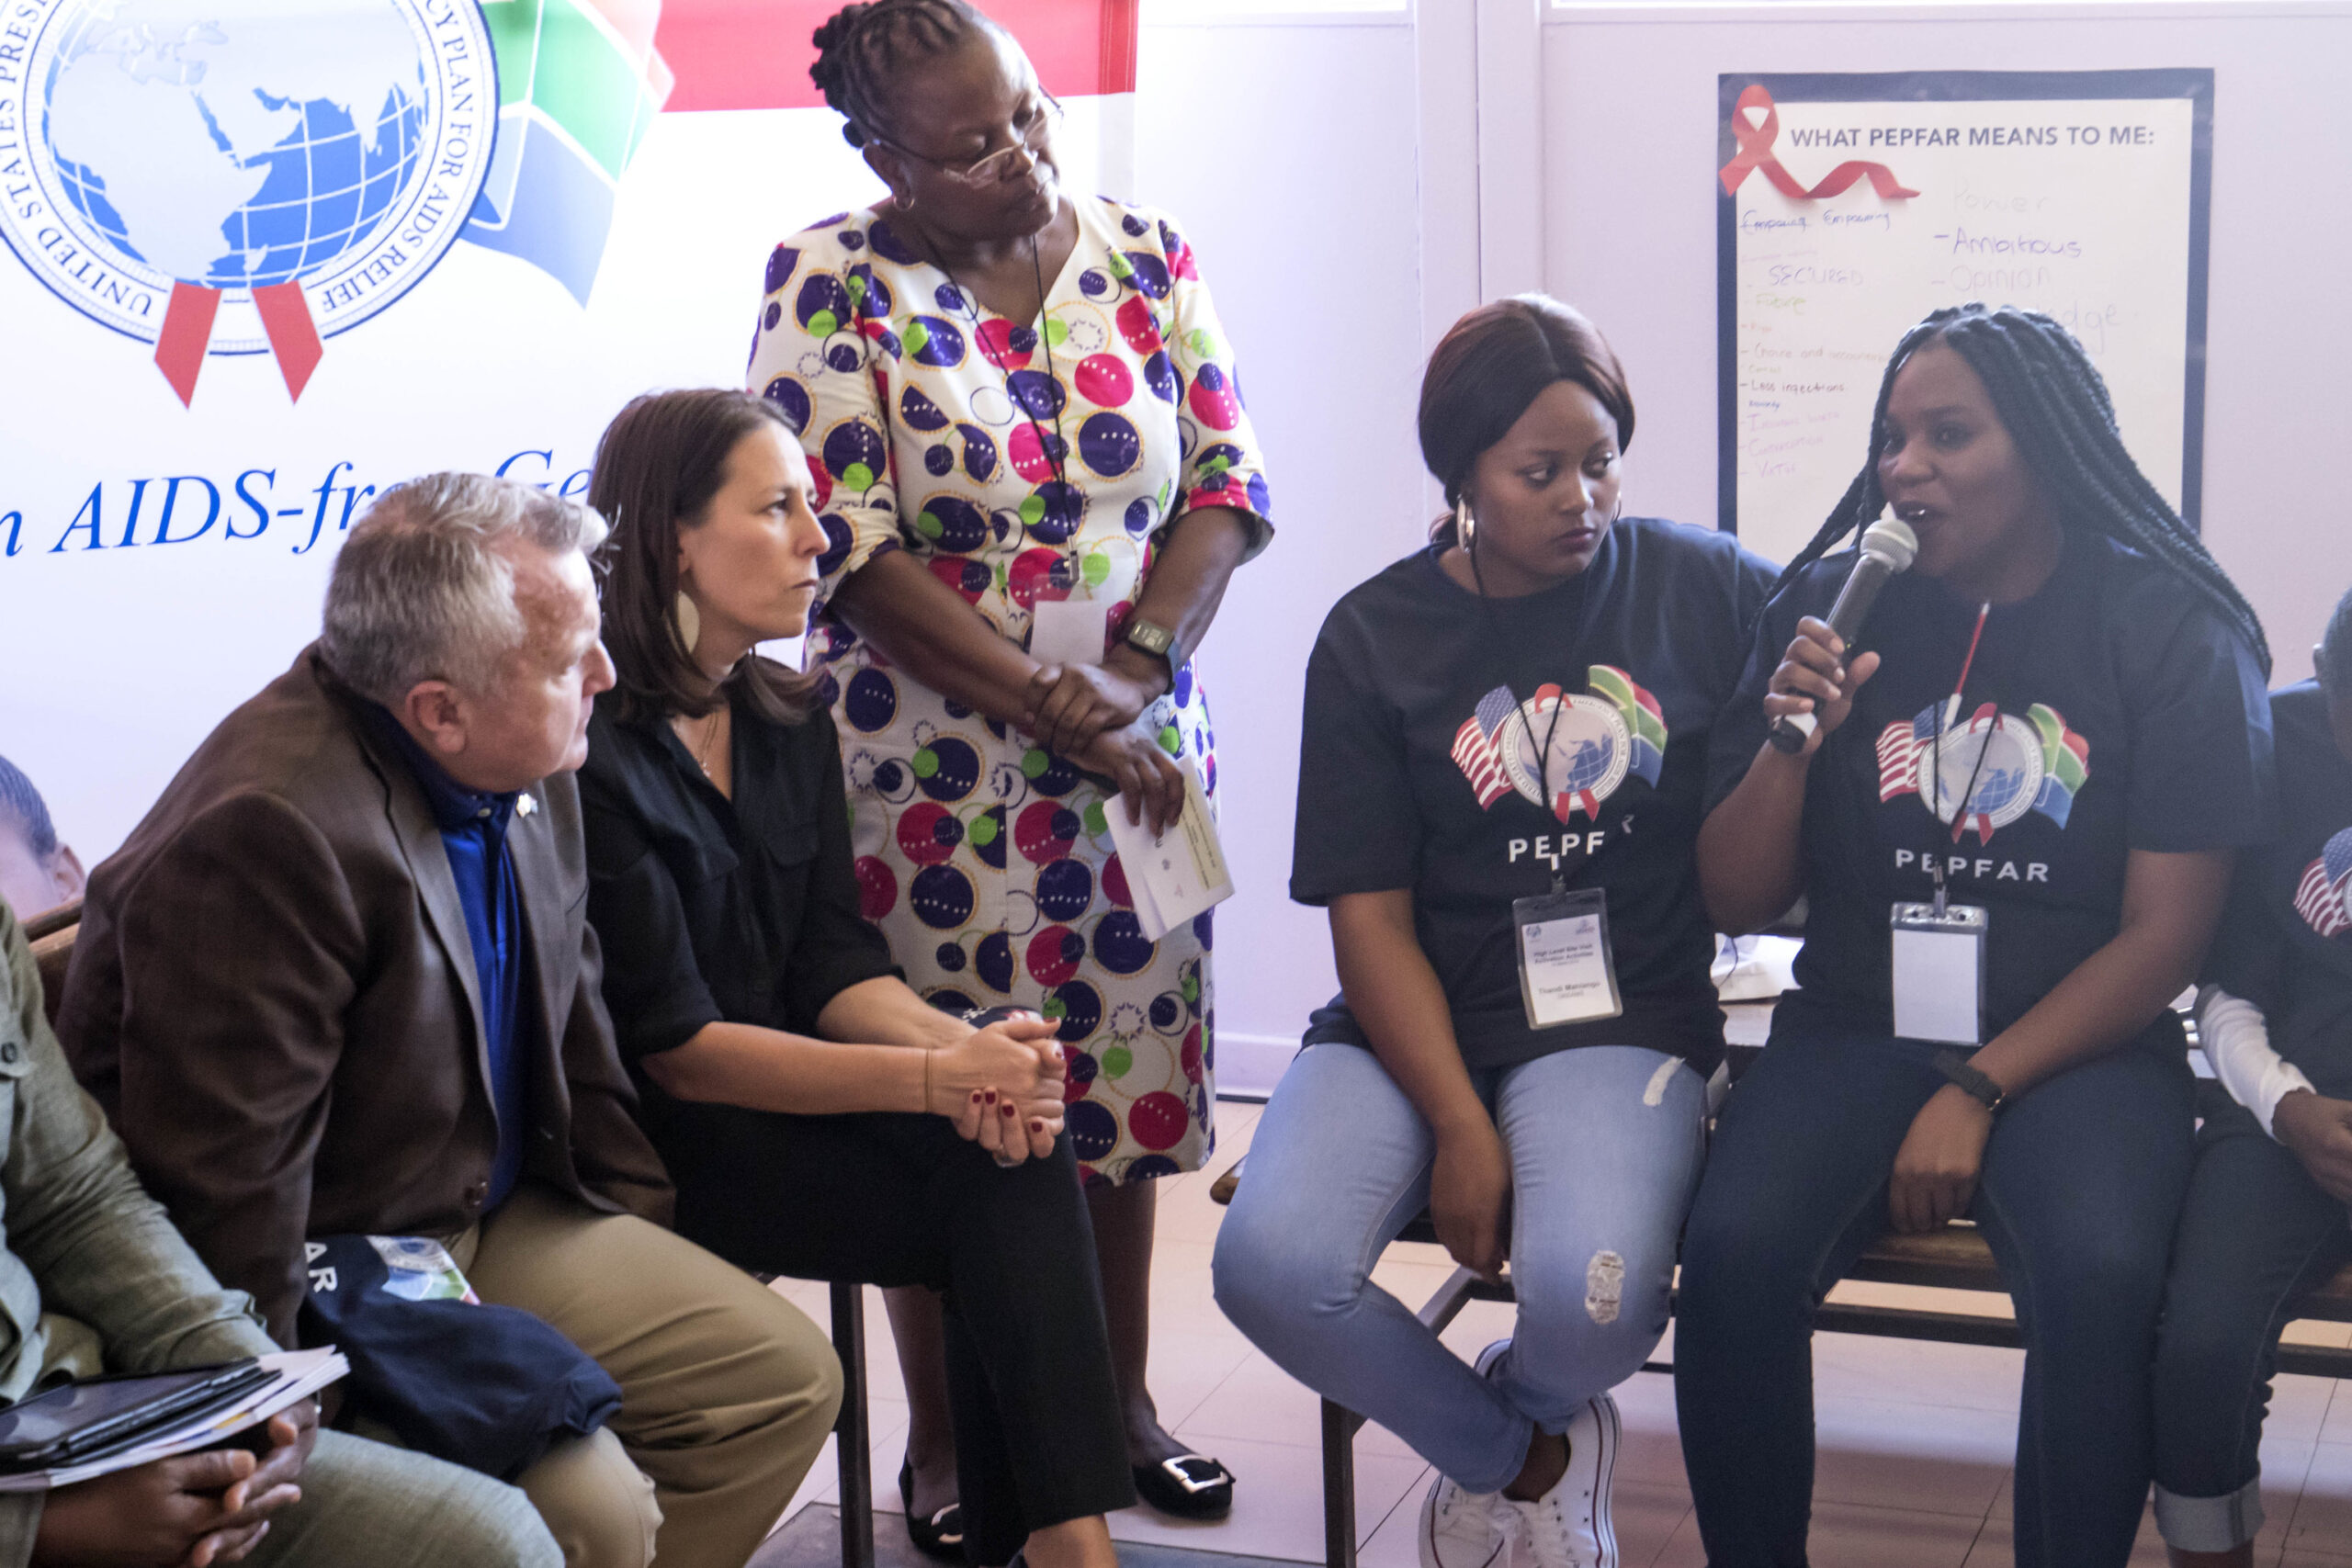
In this last week for Congress to reauthorize the expiring “PEPFAR,” the President’s Emergency Plan for AIDS Relief –
PEPFAR provides nearly $7 billion this year around the world for AIDS education, testing, treatment, and social supports. Since its 2003 launch during the second Bush administration, the program has earned a plausible claim to the mantle of the postwar Marshall Plan in its blend of ambitious concept, global scale, commitment to the common good, and successful implementation in practice. Its reauthorization this year has very unfortunately been linked to unrelated and longstanding debates on abortion, though PEPFAR (like other U.S. foreign aid programs) is, in fact, banned from funding abortions abroad. Some background:
Eswatini, a small inland country of 3 million bordering South Africa and Mozambique, has the world’s highest HIV-positive rate, at 27.9% of adults. In the early 2000s, Eswatini counted 10,000 AIDS deaths per year, and from 1990 to 2005, Swazi life expectancy at birth fell from 63 years to 42. To put this 21-year drop in context, life expectancy in China seems to have fallen by 1.5 years during World War II, and by half a year during the Great Leap Forward/Cultural Revolution decade.
On a larger scale, in the early 2000s AIDS deaths were running at two million per year, among 40 million HIV-positive people around the world. About 5% of HIV-positive people lived in the United States and other developed countries. Estimates elsewhere included 25 million in Africa, 7 million in South and Southeast Asia, and 2.1 million in Latin America and the Caribbean. Governments and charities attempting at the time to respond in these regions found multiple large obstacles, each making all the others seem insoluble:
- Low patient awareness, with most HIV-positive adults in developing countries unaware of their status;
- Medicine scarcity, with antiretroviral triple-drug therapy developed only in the late 1990s, availability limited, and administration cumbersome;
- Difficulty delivering care, with millions of potential patients in rural areas and large city slums with few clinics and fewer trained nurses and doctors; and
- Finance, with developing-country health ministries small and lacking the money to meet any of these practical challenges let alone all of them at once.
PEPFAR has been the U.S.’ big response. Sustained for 20 years, the nearly $7 billion in its various bilateral accounts — prevention and education, testing, medicine, orphan and dependent care, and others — and contributions to the Global Fund and UNAIDS now combine to make up about a third of the worldwide $22 billion in HIV/AIDS support. Run by seven agencies headed by the Global AIDS Coordinator at the State Department, PEPFAR programs operate in 120 countries and most recently helped keep HIV treatment going during the COVID-19 pandemic by such measures as support for telemedicine development and decentralized distribution of HIV testing kits.
A few statistics suggest the scale of its activity: PEPFAR this year will provide anti-retrovirals to 20.1 million people, care and shelter for 7 million orphans, and “PrEP” preventative treatment for 1.5 million people. Since its launch, treatment has risen to nearly 30 million of the 39 million people now believed HIV-positive worldwide. Estimates of annual new infections have fallen to 1.3 million in 2022, the lowest annual total since the 1980s. And world AIDS mortality has fallen by two-thirds, from the 2 million annual deaths of the early 2000s to about 600,000 per year now, with accompanying declines in maternal and child mortality, and rising childhood immunization rates.
Returning to Eswatini, hardest hit of all: The pandemic is far from over, but Eswatini is now meeting its main challenges. A 2021 national survey shows that 94% of adults with HIV are aware of their status; 97% of these people use antiretroviral medicines; and virus suppression is achieved in 96% of antiretroviral patients. In more tangible terms, some trend-markers: (a) HIV-positivity rates have dropped about 10% from their peak; (b) 200,000 Swazi are taking antiretrovirals, as against 500 in 2005; (c) AIDS mortality has dropped faster than the world rate, from the 10,000 deaths per year of the early 2000s to 2,600 last year; (d) life expectancy has recovered not quite to pre-pandemic rates, but just before the COVID pandemic had returned to 61.
Turning back to Congress: The PEPFAR authorization expires when the “fiscal year” ends this Sunday, September 30. It has accomplished a lot. Its work isn’t finished. It shouldn’t be stopped before it’s done.
FURTHER READING
Former President Bush on PEPFAR authorization this month.
… and in 2007.
… and President Biden in January.
The State Department’s PEPFAR data page.
… And its plan for the next five years.
Outside view from the Kaiser Foundation, with HIV/AIDS and PEPFAR dashboards/data/trends worldwide and by country.
Remember:
UNAIDS’ grim December 2005 report.
Eswatini:
Ambassador Maloney on World AIDS Day in Eswatini.
Virus suppression trends.
The CDC’s Eswatini operations.
And the UNAIDS office.
ABOUT ED
Ed Gresser is Vice President and Director for Trade and Global Markets at PPI.
Ed returns to PPI after working for the think tank from 2001-2011. He most recently served as the Assistant U.S. Trade Representative for Trade Policy and Economics at the Office of the United States Trade Representative (USTR). In this position, he led USTR’s economic research unit from 2015-2021, and chaired the 21-agency Trade Policy Staff Committee.
Ed began his career on Capitol Hill before serving USTR as Policy Advisor to USTR Charlene Barshefsky from 1998 to 2001. He then led PPI’s Trade and Global Markets Project from 2001 to 2011. After PPI, he co-founded and directed the independent think tank Progressive Economy until rejoining USTR in 2015. In 2013, the Washington International Trade Association presented him with its Lighthouse Award, awarded annually to an individual or group for significant contributions to trade policy.
Ed is the author of Freedom from Want: American Liberalism and the Global Economy (2007). He has published in a variety of journals and newspapers, and his research has been cited by leading academics and international organizations including the WTO, World Bank, and International Monetary Fund. He is a graduate of Stanford University and holds a Master’s Degree in International Affairs from Columbia Universities and a certificate from the Averell Harriman Institute for Advanced Study of the Soviet Union.
Read the full email and sign up for the Trade Fact of the Week