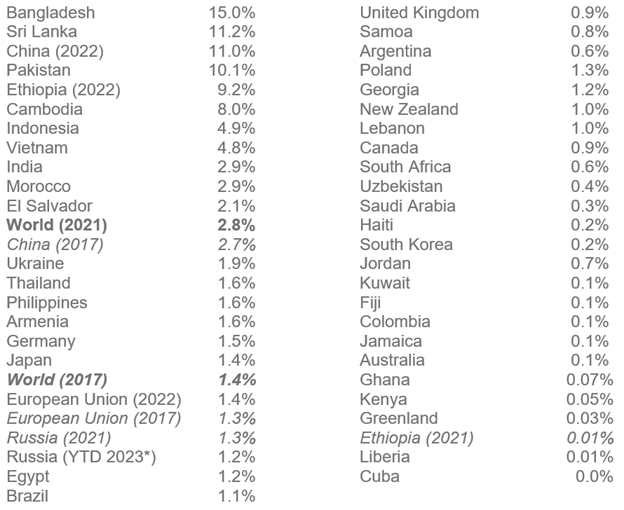
FACT: The number of poor countries has fallen by more than half since 2000.
THE NUMBERS:
2022 26
2012 36
2002 54
1992 55
*World Bank definition and estimate, based on per capita gross national income.
WHAT THEY MEAN:
Since the mid-1980s, the World Bank has been informally grouping economies into four tiers of wealth. They begin at “low-income” and ascend through “lower-middle income” and “upper-middle-income” to “high income”, divided by annually adjusted levels of Gross National Income per capita. The list comes out each year, with the thresholds slightly adjusted to take account of inflation and a few arcane macro-issues. It is meant less to measure inequality among countries (though it does offer some comparisons) than to give a stable definition of what it means for an economy to be poor, rich, or somewhere in the middle. Over time, it also allows you to see change — this year, with a vivid four-color visualization — as some countries rise, others descend, and the world as a whole changes. First the numbers, then the colors and the trend they show:
Numbers: In the 2023 list, a “low-income” economy has a GNI per capita of $1,135 or less per year. The Bank finds 26 such countries, from Burundi (the poorest country in the world at $240 per person per year, with Afghanistan and Somalia a bit above) to Ethiopia at $1,020. A “high-income” economy’s GNI per capita, meanwhile, is anything above $13,845. This group’s brackets are two small-island tourist favorites: Seychelles in the Indian Ocean at $14,340 and Bermuda at $125,240. (The U.S. is seventh at $76,370; more below.) In between are (a) lower-middle-income countries from $1,136 to $4,445 per person per year, in practical terms from Tanzania, Tajikistan, Nepal, and Myanmar just above the low-income line to Mongolia, Jordan, and Ukraine at $4,200+; and (b) upper-middle-income countries from Indonesia and the West Bank and Gaza a bit above $4,500 to China, Bulgaria, and pre-invasion Russia, each a few hundred dollars below “high-income” status.
The list changes a bit each year, sometimes to add some new economies but mostly to report shifts in classification. The 2023 list, for example, the Palestinian territories and El Salvador in upper-middle income territory for the first time, and restores Indonesia (which first entered this group in 2019, but temporarily fell back out during the Covid pandemic). Guinea and Zambia likewise cross from low-income to lower-middle income, and Guyana and American Samoa from upper-middle to high-income. More systemic changes show up over decades rather than years: taken in 10-year jumps, the last 30 years reveal a steady upward drift across the entire list:
1992: This early edition of the list, contemporary with the birth of the World Wide Web, the creation of the WTO, etc. included 204 economies. Of this total, 55 were low-income, 71 lower-middle income, 39 upper-middle income, and 39 high income. Using a simpler breakdown, the list was weighted toward the bottom, with 126 low- and lower-middle income states and 78 upper-middle and high-income economies. Thus about 62% of economies fell below the line separating the low and lower-middle income tier from the upper-middle and high-income region, while 38% placed above it.
2002: 209 economies, of which 64 were low-income, 54 lower-middle, 34 upper-middle, and 57 high income.
2012: 215 economies (larger in part because of a couple of declarations of independence, but mainly due to more complete coverage of small islands), of which 36 were low-income, 48 lower-middle, 55 upper-middle, and 76 high income.
2022: This most recent edition, out in early July, covers 217 economies, of which only 26 are low-income, 54 lower-middle, an identical 54 upper-middle, and 83 are high income. So 137 of them, or about 63%, are now above the “median” line and 37% below, reversing the 1992 proportions.
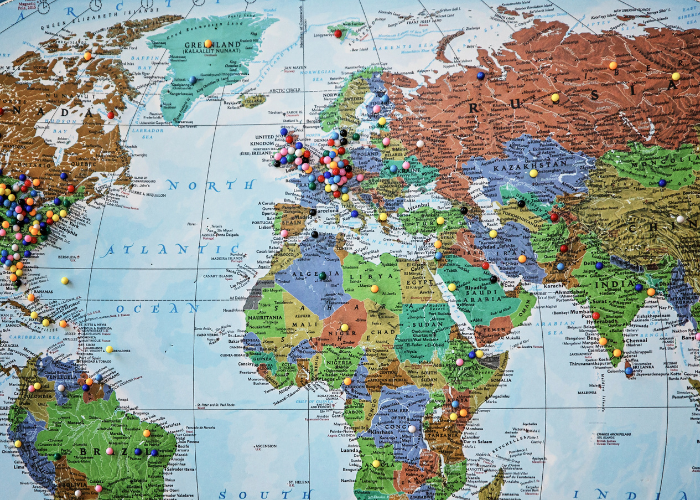
Colors: Accompanying this year’s release, a time-series map colors high-income countries dark forest green, upper-middles a lighter emerald shade, lower-middles a kind of lilac purple, and low-incomes dark purple or violet. The 1992 map has no green anywhere between Germany and South Korea; all the most populous countries in the heart of Asia — Pakistan, India, Bangladesh, Indonesia, Vietnam, and China — combine in a forbidding block of low-income violet, relieved only by lilac Thailand, emerald Malaysia, and tiny dark green dots for Brunei, Singapore, and Hong Kong. Africa meanwhile has some light green at the top and bottom, but apart from a bit more light green for oil-exporting Gabon and light purples for Namibia and Angola, it’s gloomy violet all the way from the Sahara to the Kalahari. In the Western Hemisphere, a light purple shading extends through nearly all of Latin America; and Western Europe’s, dark green ends at the eastern borders of Germany, Austria, and Italy, with a bit of light green for Hungary and everything else lower-middle income lilac.
As the time-lapse proceeds, Asia’s violet block fades to lilac for China and Southeast Asia by the 2000s, and then (with exceptions for Afghanistan and North Korea) goes green in the north and lilac in South Asia. Africa’s violet retreats from the continent’s maritime rim, and now concentrated in inland states and the Horn, is almost completely ringed by lilac. The light purples in Latin America mostly vanish (though Venezuela falls off the green map, and the Bank isn’t venturing a guess this year), and dark green high-income tones turn up in Panama, Chile, Uruguay, and five Caribbean island states. And the forest-green edge of western Europe flows east and south as EU and NATO membership grows, sequentially incorporating Poland, the Baltic states, the Czech Republic and Hungary, Croatia, and most recently Romania.
In practical human-being terms, as this has proceeded the number of people living in deep poverty has dropped from 1.995 billion of 5.3 billion people then – that is, 38% or nearly two-fifths of humanity — to 655 million of 8 billion, or about 8%, as of the last estimate covering the year 2018. Sometimes, things do get better.
* Technically by “Gross National Income Per Capita, Atlas Method.”

FURTHER READING
The WB’s visualization, with links to this year’s country income groups and explanations of the various calculations they involve.
The U.S. and the top end The U.S.’ 2022 ranking is seventh among the 216 economies by per capita income, just above Denmark and Qatar at $76,370 per person. The top six are Bermuda at $125,240, Norway at $95,610, Luxembourg at $91,200, Switzerland at $89,450, Ireland at $81,070, and the Isle of Man at $79,300. An alternative calculation, by purchasing-power parities, lifts Norway into first, followed by Qatar and Singapore, then Bermuda, Luxembourg, Ireland, the United Arab Emirates, and Switzerland with the U.S. ranked ninth.
The big economies — Among the world’s 16 largest economies (as measured by total GDP), the list reports nine in the high-income group, six at “upper-middle-income,” and one “lower-middle-income” economy, and no low-income economies. A list with these 16 and their “rankings,” along with Bermuda and Burundi in italics as the top and bottom bounds:
[High-income]
1. Bermuda, $125,240
7. United States, $76,370
15. Australia, $60,430
21. Germany, $53,390
22. Canada, $52,960
24. United Kingdom, $48,890
28. France, $45,860
30. Japan, $39,570
34. Korea, $35,990
35. Spain, $31,860
[Upper-middle-income line = $13,845]
70. China, $12,830
71. Russia, $12,810
80. Mexico, $10,410
88. Brazil, $7,920
121. Indonesia, $4,580
[Lower-middle income line = $4,445]
147. India, $2,380
[Low-income line = $1,145]
217. Burundi, $240
A PDF of the full list from the World Bank.
ABOUT ED
Ed Gresser is Vice President and Director for Trade and Global Markets at PPI.
Ed returns to PPI after working for the think tank from 2001-2011. He most recently served as the Assistant U.S. Trade Representative for Trade Policy and Economics at the Office of the United States Trade Representative (USTR). In this position, he led USTR’s economic research unit from 2015-2021, and chaired the 21-agency Trade Policy Staff Committee.
Ed began his career on Capitol Hill before serving USTR as Policy Advisor to USTR Charlene Barshefsky from 1998 to 2001. He then led PPI’s Trade and Global Markets Project from 2001 to 2011. After PPI, he co-founded and directed the independent think tank Progressive Economy until rejoining USTR in 2015. In 2013, the Washington International Trade Association presented him with its Lighthouse Award, awarded annually to an individual or group for significant contributions to trade policy.
Ed is the author of Freedom from Want: American Liberalism and the Global Economy (2007). He has published in a variety of journals and newspapers, and his research has been cited by leading academics and international organizations including the WTO, World Bank, and International Monetary Fund. He is a graduate of Stanford University and holds a Master’s Degree in International Affairs from Columbia Universities and a certificate from the Averell Harriman Institute for Advanced Study of the Soviet Union.
Read the full email and sign up for the Trade Fact of the Week