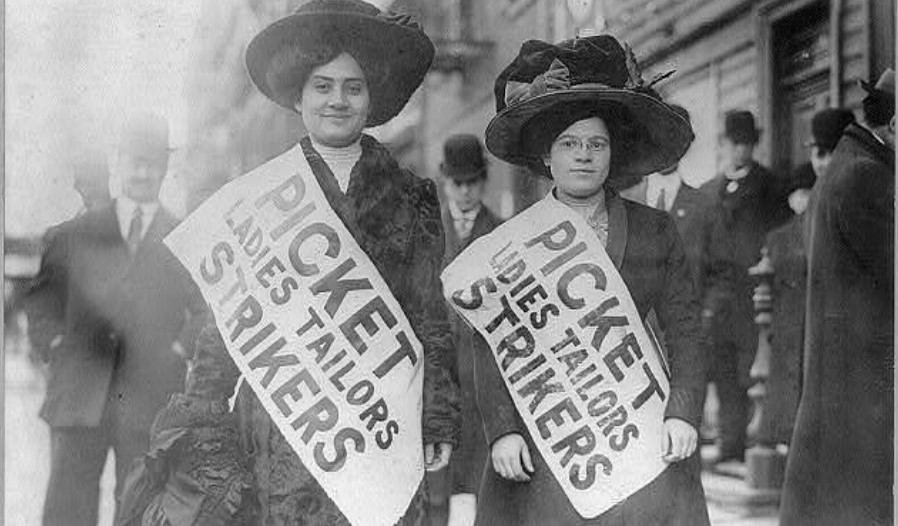
FACT: U.S. underwear tariffs are unfair to women.
THE NUMBERS: Average U.S. tariff rates,* 2022 –
Women’s underwear 15.5%
All underwear 14.7%
Men’s underwear 11.5%
Steel 5.7%
All goods 3.0%
* “Trade-weighted,” combining tariffs collected on all imports, including those under MFN tariff rates, Chinese products subject to “301” tariffs, and FTA/preference products exempted from tariffs.
WHAT THEY MEAN:
Worst Valentine’s Day surprise ever: The U.S. tariff system taxes women’s underwear more heavily than men’s. Facts follow:
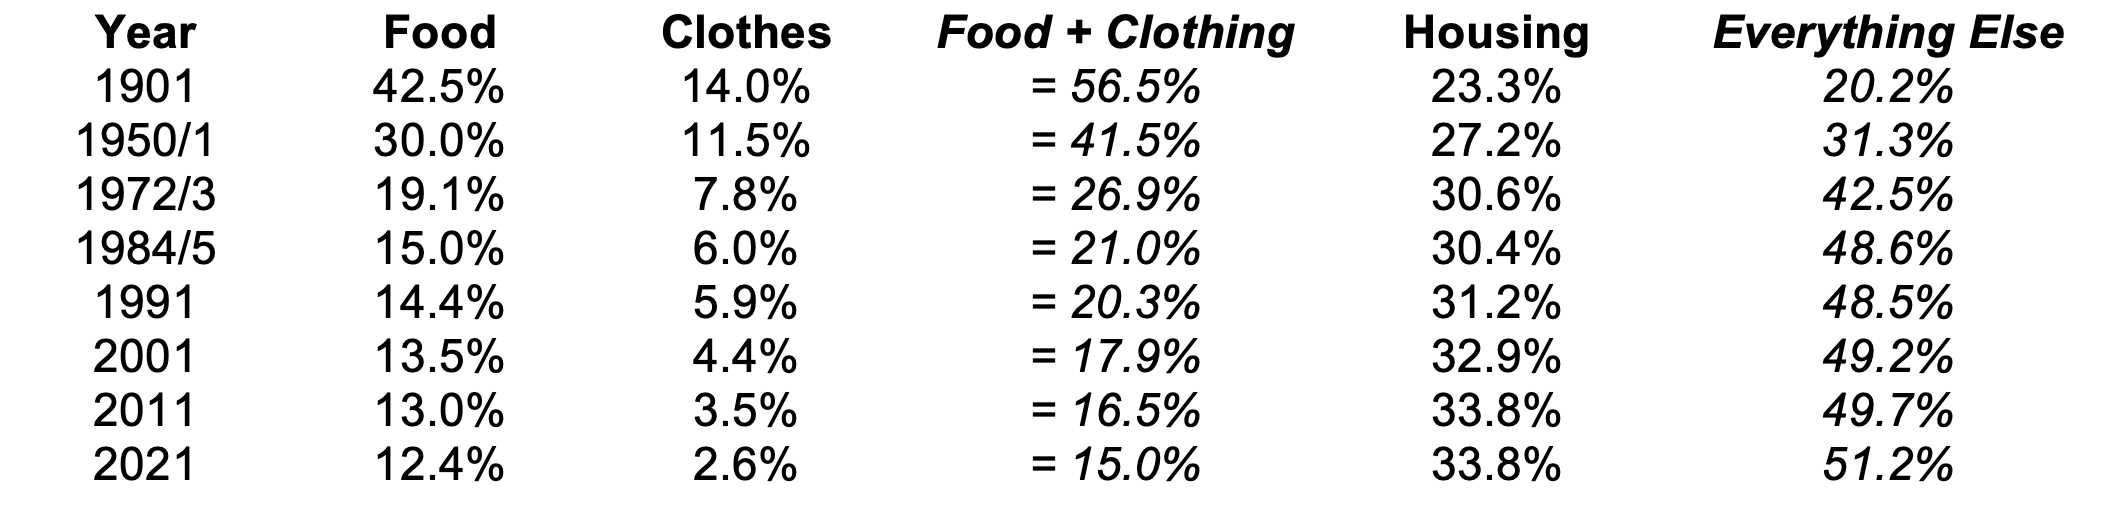
1. Steel vs. Underwear: First, tariffs are fundamentally a form of taxation, and tariffs on underwear are high. A Google search this morning finds “about 144,000” uses of the phrase “steel tariffs” and “about three” (3) of the phrase “underwear tariffs.” But despite the domestic and international controversy over steel tariffs, clothing tariffs in general and underwear tariffs specifically are lots higher. In 2021, automakers, building contractors, and other metal buyers ferried 28 million tons of steel in from abroad for $44 billion, and paid the Customs Service $2.5 billion in tariffs. Thus the “average” tariff on steel came to about 5%. Buyers of clothing, meanwhile, bought 5.5 million tons of clothes for $109 billion and paid $16 billion on it, for an average of 14.5%. Underwear makes up about a tenth of clothing imports — 519,000 tons or 3.4 billion articles, at $10.1 billion last year — and brought in $1.54 billion in tariff revenue. The average underwear tariff, therefore, was 14.7%* or about three times the rate on steel.
2. Tariff Rates: Second, the U.S. tariff system taxes women’s underwear at higher rates than men’s. To dip briefly into Customs-and-trade-policy jargon, underwear tariffs are published in Chapter 61 of the Harmonized Tariff Schedule** (“Knitted or Crocheted”), headings 6107 and 6108, and in Chapter 62 (“Other than Knitted or Crocheted”) headings 6207, 6208, and 6212. Together these five sections spread out over 17 pages and include 68 separate tariff “lines,” from line “61071100,” for men’s cotton underpants and briefs, to line “62129000,” a catchall for unclassifiable and possibly exotic things. The rates in these 68 lines range from 0.9% to 23.5%, diverging mainly along lines of class and gender. Among the products with clearly comparable female and male items, (a) aristocratic silks are lightly taxed, at 2.1% for women’s panties and 0.9% for male boxers and briefs; (b) the analogous working-class polyesters are heavily taxed, at 14.9% for men and 16.0% for women; and (c) middle-class cottons are, well, in the middle, at 7.6% for women and 7.4% for men. The highest rates fall on women’s products in heading 6212 with no obvious masculine counterpart: brassieres in a range from 4.8% (silk) to 16.9% (cotton or polyester), girdles 20%, and corsets 23.5%.
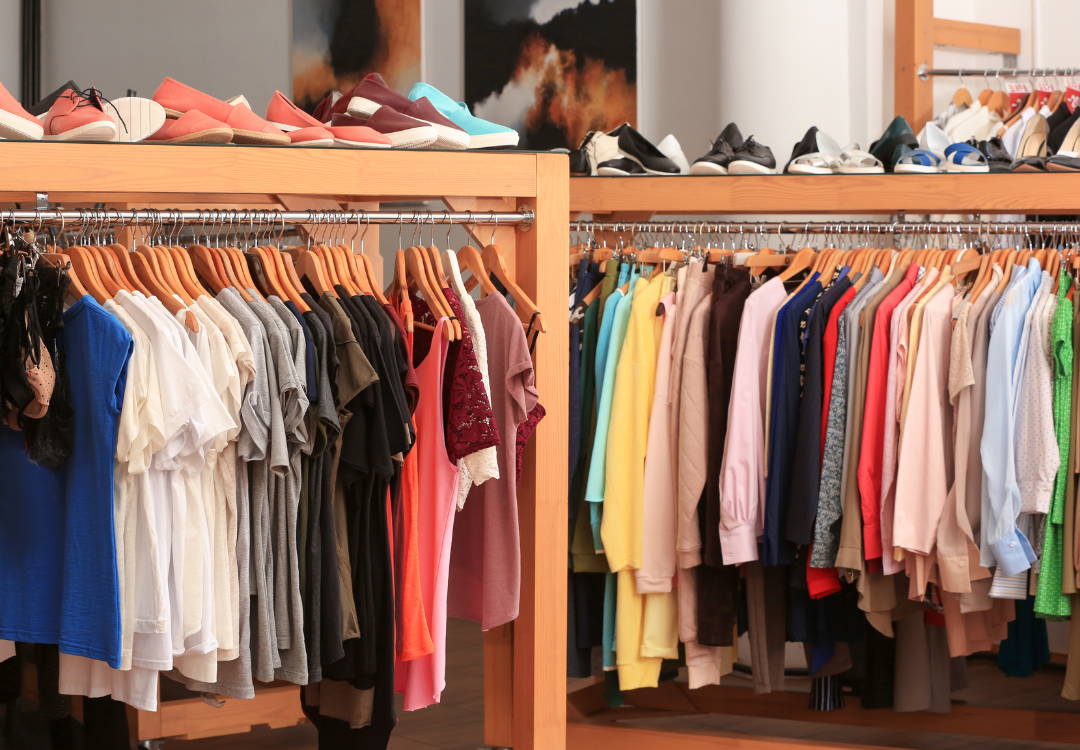
3. Costs: Third, tariffs on underwear, like consumer goods tariffs generally, are eventually paid by shoppers. Since Americans buy more women’s underwear than men’s, and since it is more heavily taxed, Customs raises more money from the women’s stuff. About three quarters of the $1.54 billion in underwear tariffs last year — $1.23 billion on $7.90 billion in imports, for an average rate of 15.5% — came from women’s underwear. Men’s brought in $306 million on $2.65 billion, for an 11.5% average. Peering a bit more closely, the $1.23 billion in lingerie tariffs came from 3.28 billion separate articles — i.e., about 37 cents per piece. The $306 million on men’s products came from 1.28 billion separate articles, or about 24 cents each. Markups, domestic transport costs, sales taxes, and so forth appear to have roughly tripled the prices of clothing*** from border to cash register last year, with tariffs amplified a bit at each stage. While precise figures would vary with the price of the item, on average the tariff system appears to add about $1.10 to the cost of each women’s underwear item, and 75 cents to men’s.
4. Comparisons: In international context, the U.S.’ underwear tariff rates as an overall average are pretty typical. But the U.S. system is (a) very unusual in taxing luxuries more lightly than mass-market goods, and (b) possibly unique in taxing women’s underwear more heavily than men’s. Most tariff systems have flat rates applying to all underwear: 5% in Australia, 10% in New Zealand, 18% in Canada, 20% in Colombia, also 20% in Jamaica, 25% (with an anti-poor twist, see below) in India, 30% in Thailand, an eyebrow-raising high 45% in South Africa, and so on. The Japanese and EU tariff systems in fact have a modest pro-female tilt, as they impose lower rates — zero in the Japanese case, 6.5% in the EU — on products in the 6212 heading, such as brassieres and corsets, as against flat rates of 9% and 12% for the rest.
As to the U.S., shifting from the jargon of customs and trade to that of policy analysis and evaluation: Seriously?! Boo! Do better! 😡 😡 😡
Nonetheless, we still wish readers a happy and romantic Valentine’s Day.
* Up from 12.0% in 2017. This increase to some extent reflects the “301” tariffs on Chinese-stitched brassieres, briefs, etc. imposed in 2019, but other factors are at work as well. Both China and zero-tariff Central America have also lost market share, while MFN suppliers in Bangladesh, Vietnam, Cambodia, Indonesia, and India have gained relative to both.
** Some other clothing items show up in Chapters 42 and 48 — respectively leather and rubber products — but underwear of these types have no specific tariff line, so left out of the analysis above.
*** Clothing spending by consumers was about $400 billion last year; import value at the border $110 billion; 98% of clothing is imported.

FURTHER READING:
The U.S. International Trade Commission maintains the U.S. Harmonized Tariff Schedule. Check Chapter 61, sections 6107 and 6108, and Chapter 62, sections 6207, 6208, and 6212 for underwear.
And the ITC’s Dataweb requires a bit of HTS expertise but appears unique in the world in allowing ordinary citizens to get not only tariff rates but very detailed information on U.S. exports, U.S. imports, and tariff collection, by product and country.
Background:
Is the anti-female tilt of underwear tariffs typical of the American tariff system, or a weird anomaly? Overall, the “class” bias, in which silks and cashmeres are taxed lightly while cottons are taxed heavily and polyester and acrylics most of all, is the norm for U.S. consumer goods tariffs. The “gender” bias, in which women’s underwear attracts higher tariffs than analogous men’s goods, seems less systematic though still the rule. Asked to study these questions in 2018, ITC economists concluded the following:
“… [T]ariffs act as a flat consumption tax. Since a flat consumption tax is a regressive tax on income, tariffs fall disproportionately on the poor. Across genders, we find large differences in tariff burden. Focusing on apparel products, which were responsible for about 75% of the total tariff burden on U.S. households, we find that the majority, 66%, of the tariff burden was from women’s apparel products. In 2015, the tariff burden for U.S. households on women’s apparel was $2.77 billion more than on men’s clothing. … . This gender gap has grown about 11% in real terms between 2006 and 2016. We find that two facts are responsible for this gender gap: women spend more on apparel than men and women’s apparel faces higher tariffs than men’s.”
ITC’s look at gender and class bias in the tariff system.
PPI’s Ed Gresser on U.S. consumer goods tariffs as taxation.
And Miranda Hatch in the BYU Law Review on the tariff system and gender bias.
Around the world:
The European Union tariff system has a 12% tariff on all briefs, panties, and boxers whether cotton, silk, or polyester, and whether designated “men’s and boy’s” or “women’s and girl’s,” and a lower 6.5% on brassieres and corsets.
Japan’s is 9% on comparable things and duty-free on brassieres and corsets.
Australia is at 5% all the way through.
India has an anti-poor tilt (many items get “25% or Rs25, whichever is higher,” in practice meaning >25% rates for anything costing less than $1.25 per item, so in practice cheap goods important to low-income families will be taxed more heavily than expensive luxuries), but no divergence in men’s and women’s rates.
Canada is 18% all the way through.
And Jamaica 20%.
And some trade-and-gender links:
WTO’s Informal Working Group on Trade and Gender.
… and a nine-expert panel (“Does Trade Liberalization Have Gender’s Back?”) from last December’s.
ABOUT ED
Ed Gresser is Vice President and Director for Trade and Global Markets at PPI.
Ed returns to PPI after working for the think tank from 2001-2011. He most recently served as the Assistant U.S. Trade Representative for Trade Policy and Economics at the Office of the United States Trade Representative (USTR). In this position, he led USTR’s economic research unit from 2015-2021, and chaired the 21-agency Trade Policy Staff Committee.
Ed began his career on Capitol Hill before serving USTR as Policy Advisor to USTR Charlene Barshefsky from 1998 to 2001. He then led PPI’s Trade and Global Markets Project from 2001 to 2011. After PPI, he co-founded and directed the independent think tank Progressive Economy until rejoining USTR in 2015. In 2013, the Washington International Trade Association presented him with its Lighthouse Award, awarded annually to an individual or group for significant contributions to trade policy.
Ed is the author of Freedom from Want: American Liberalism and the Global Economy (2007). He has published in a variety of journals and newspapers, and his research has been cited by leading academics and international organizations including the WTO, World Bank, and International Monetary Fund. He is a graduate of Stanford University and holds a Master’s Degree in International Affairs from Columbia Universities and a certificate from the Averell Harriman Institute for Advanced Study of the Soviet Union.
Read the full email and sign up for the Trade Fact of the Week