FACT: Through July 2025, tariffs up $888 million on toys and dolls, $81 million on bananas, $71 million on tampons, and $45 million on bandages.
THE NUMBERS: Tariff collection, 2024 vs. 2025* –
| Jan. – July 2024 | Jan. – July 2025 | |
| Total Tariff Collection | $43 billion | $122 billion |
| … on cars | $1,968 million | $12,974 million |
| … on toys and dolls | $0 | $888 million |
| … on sports equipment | $243 million | $694 million |
| … on TV sets | $134 million | $500 million |
| … on coffee | $1.3 million | $359 million |
| … on tampons | $14 million | $85 million |
| … on bananas | $0.24 million | $81 million |
| … on wigs & hair extensions | $10 million | $66 million |
| … on Band-Aids & other bandages | $0 | $45 million |
* USITC Dataweb, most recent data available. As the Trump administration’s July 31st revision of its April 2nd tariff decree sharply increased tariff rates on many countries, the full-year increases will probably be much larger.
WHAT THEY MEAN:
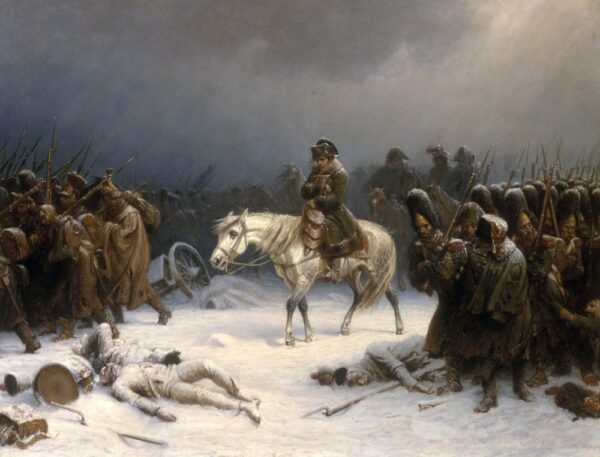
The late Emperor Napoleon Bonaparte began the Grand Army’s retreat from Moscow in the autumn of 1812 with a small symbolic gesture. He sent home 1,500 injured soldiers, presumably hoping that would calm Paris’ opinion while the other 100,000 stayed on. Trump administration officials are trying something similar. Having read the opinion polls and the election returns, they scrapped Mr. Trump’s tariffs on coffee and bananas last Friday. Here’s the Treasury Secretary, Scott Bessent, pitching the idea to a friendly TV outlet:
“You’re going to see substantial announcements over the next couple of days in terms of things we don’t grow here in the United States. Coffee being one of them, bananas, other fruits. Things like that. So that will bring the prices down very quickly.”
The actual list covers 238 tariff lines, including coffee and bananas, and adds beef, Chinese water chestnuts, cassava, taro root, cocoa beans, mangoes, and so on. What does this actually mean? The 238 lines together totaled $51.6 billion worth of imports in 2024. Tariff collection on these products, comparing January to July in 2024 to the same period this year, has jumped from $240 million to $1.72 billion. Bessent’s coffee and bananas illustrate how it works:
Bananas: The Congressionally authorized “MFN” tariff on bananas is zero, except for a 1.4% rate on dried bananas and chips. From January to July last year, CBP collected $0.24 million in tariffs on bananas. The $81 million through July this year — up 33,650% — mainly comes from new 10% tariffs on Guatemalan bananas, and 15% tariffs on bananas from Ecuador and Costa Rica. They brought $64 million, and 10% tariffs on Honduran, Colombian, and Peruvian varieties added $15 million more. As a legal/policy note, the Trump administration’s application of tariffs to these bunches overwrites the actual U.S. tariff system and breaches U.S. WTO commitments, and badly violates the U.S. FTAs with Central America, Colombia, and Peru.
Coffee: Coffee’s Congressionally authorized “MFN” tariff is zero, again with the small exception of a 1.5 cent/kilo tariff on “coffee substitutes containing coffee.” CBP’s coffee take is up $1.3 million in 2024 to $359 million in 2025, for a “28,170%” increase. As with bananas, the increase has hit Latin growers hardest. An initial 10% tariff on Brazilian coffee rose to 50% in July, out of pique over the prosecution of ex-president Yair Bolsonaro, and has brought $69 million. The 10% tariffs on Colombian and Guatemalan coffees brought $53 million and $36 million, respectively. The 20% tariff on Vietnamese coffee brought $13 million, the 10% on Ethiopian yirgacheffe $11 million, and the 19% on Indonesian Sumatra and kopi luwak $7 million.
The rise in banana and coffee tariffs is statistically striking — you don’t often get a chance to talk about 33,500% increases — and beef likewise. But the combined $1.7 billion is only a couple of pennies on the dollar, 2%, when placed against the $79 billion in overall cost increases the Trump administration’s tariff decrees entail. The biggest new costs so far are on industrial consumers — factories buying metal and parts, farmers buying fertilizer, construction sites, utilities, etc. — but the tariff increases in retail and household goods are striking too. Here’s a representative list, with some of Friday’s new exclusions in italics:
| Jan. – July 2024 | Jan. – July 2025 | |
| Total tariff collection | $43 billion | $122 billion |
| … on cars | $1,968 million | $12,974 million |
| … on shoes | $1,871 million | $3,227 million |
| … on toys and dolls | $0 | $888 million |
| … on sports equipment | $243 million | $694 million |
| … on beef | $135 million | $627 million |
| … on TV sets | $134 million | $500 million |
| … on coffee | $1.3 million | $359 million |
| … on makeup | $85 million | $301 million |
| … on vacuum cleaners | $90 million | $180 million |
| … on OTC medicines | $0 | $144 million |
| … on tampons | $14 million | $85 million |
| … on bananas | $0.24 million | $81 million |
| … on cocoa butter | $0 | $67 million |
| … on olive oil | $8 million | $66 million |
| … on wigs & hair extensions | $10 million | $66 million |
| … on personal computer keyboards | $0 | $48 million |
| … on bandaids & other bandages | $0 | $45 million |
| … on musical instruments | $19 million | $38 million |
| … on ginger, turmeric, & spices | $4 million | $17 million |
In sum: The retreat on coffee, beef, and bananas, like Emperor Napoleon’s initial dispatch of a few wounded soldiers home, is in principle quite a large concession: the administration has abandoned its claims earlier this year that tariffs don’t raise prices, and that foreigners pay them anyway. In practice, though, it’s a cosmetic gesture rather than a solution. Mr. Trump’s tariff increase on tampons is about as big as the one on bananas, but (at least for now) the tampon tax is staying in place. The tariff hike on toys is twice as big as that of the banana and coffee tariffs put together, and that on shoes tariff increase alone offsets the entire 238-product exclusion list. And since tariffs got much higher in August and we don’t yet have post-July revenue figures, the actual totals now will be much higher.
In the Emperor’s case, the cosmetic gesture was a mistake. The invasion had failed, and the longer he waited to liquidate it, the worse things got. In the end, only 10,000 of his men made it home. There’s maybe a lesson there.
FURTHER READING
PPI’s four principles for response to tariffs and economic isolationism:
- Defend the Constitution and oppose rule by decree;
- Connect tariff policy to growth, work, prices and family budgets, and living standards;
- Stand by America’s neighbors and allies;
- Offer a positive alternative.
Napoleon retreats from Moscow.
Bessent on coffee and bananas.
PPI background:
PPI Trade Fact from August 21, 2024: Tariffs raise consumer prices. That’s what they’re supposed to do. It usually works. No surprises. Trust Alice, not the Queen.
Laura Duffy’s October 2024 “It’s Not 1789 Anymore: Why Trump’s Backward Tariff Agenda Would Hurt Americans,” explains why tariffs are a poor form of taxation: they can’t raise enough revenue, are opaque and regressive, causing downstream harms.
Tariff decrees:
The actual, Congressionally authorized, Harmonized Tariff Schedule of the United States.
The April 2 “international emergency” trade balance decree.
… the July 31 revision with current country-by-country rates.
… and last Friday’s November 14 re-revision excluding tropical agriculture, metal ores, etc.
The March 26 “national security” decree on cars and parts.
Tariff data:
USITC’s Dataweb has tariff revenue, import values, and more by product and country. Updated only through July 2025.
CBP breaks out FY 2025 tariff collection by decree, but not product and only a few countries; data through September.
ABOUT ED
Ed Gresser is Vice President and Director for Trade and Global Markets at PPI.
Ed returns to PPI after working for the think tank from 2001-2011. He most recently served as the Assistant U.S. Trade Representative for Trade Policy and Economics at the Office of the United States Trade Representative (USTR). In this position, he led USTR’s economic research unit from 2015-2021, and chaired the 21-agency Trade Policy Staff Committee.
Ed began his career on Capitol Hill before serving USTR as Policy Advisor to USTR Charlene Barshefsky from 1998 to 2001. He then led PPI’s Trade and Global Markets Project from 2001 to 2011. After PPI, he co-founded and directed the independent think tank ProgressiveEconomy until rejoining USTR in 2015. In 2013, the Washington International Trade Association presented him with its Lighthouse Award, awarded annually to an individual or group for significant contributions to trade policy.
Ed is the author of Freedom from Want: American Liberalism and the Global Economy (2007). He has published in a variety of journals and newspapers, and his research has been cited by leading academics and international organizations including the WTO, World Bank, and International Monetary Fund. He is a graduate of Stanford University and holds a Master’s Degree in International Affairs from Columbia Universities and a certificate from the Averell Harriman Institute for Advanced Study of the Soviet Union.