FACT: U.S. layoffs are up for four consecutive years.
THE NUMBERS: Annual U.S. layoffs*
| 2025 | 21.2 million |
| 2024 | 20.0 million |
| 2023 | 19.9 million |
| 2022 | 17.6 million |
| 2021 | 17.1 million |
| 2020 (pandemic year) | 40.8 million |
| 2015-2019 average | 21.7 million |
Bureau of Labor Statistics, Job Openings and Labor Turnover survey.
WHAT THEY MEAN:
An idea for the next Congress, floated four years ago by then-PPI Workforce Policy Development Director Taylor Maag and Ed Gresser, and still good now: revive the Trade Adjustment Assistance program, but open it to everyone.
As an entry point, the Raleigh News & Observer has a stark lede last week:
“American tiremaker Goodyear Tire & Rubber plans to shut its long-running Fayetteville plant and eliminate approximately 1,700 jobs in what would be one of the biggest factory closures by employment loss in recent North Carolina history. Goodyear announced this week it is talking with the local workers’ union to end site operations by December 2027.”
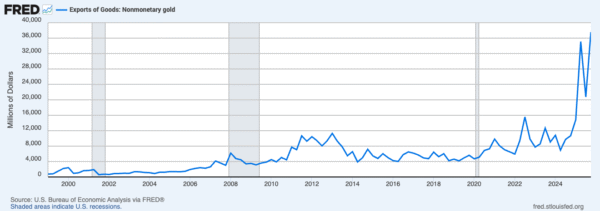
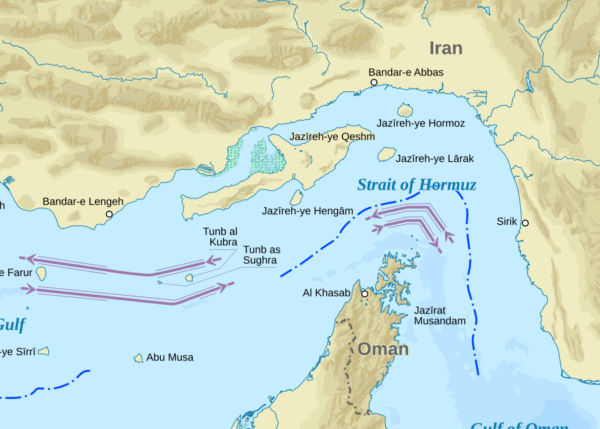
Not only North Carolina’s largest recent factory closure, this event appears to be the largest U.S. mass factory layoff outside the processed-food business in the 15 years since the end of the financial crisis. To put the impact in context, Metro Fayetteville is home to about 390,000 people, with the Goodyear plant joining a Wal-Mart distribution center and the local hospital as the top private-sector employer. Goodyear’s press comment cites short-term cost issues and lower consumer demand for tires; its quarterly earnings calls cite a loss of $420 million this year to “inflation, tariffs, and other costs” as a complementary challenge. (See Eric Boehm in Reason for a close look at the event, and analysis of the impact of tariffs and the Iran war’s interruption of petrochemical stocks for synthetic rubber.)
This particular closure comes in a larger environment in which layoffs are not at extreme highs, but have risen for five years in a row. According to the Bureau of Labor Statistics’ “Job Openings and Labor Turnover survey, last year’s 21.2 million layoffs were the largest annual total since the Covid pandemic in 2020, and about equal to the rates of the 2010s. To put this aggregate figure in human perspective, each day about 161 million Americans go to work, and about 60,000 come home with pink slips.
Their standard support program, unemployment insurance, provides a post-layoff stipend of up to 26 weeks in some states as they look for the next job. From 1962 through the summer of 2022, though, the smaller “Trade Adjustment Assistance” program offered a much broader range of options to those dislocated workers who could show that import competition or job shifts overseas “contributed importantly to [their] separation or threat of separation.” Background on this:
Origins and benefits: President John F. Kennedy launched “TAA” in 1962, as a complement to his very ambitious trade-liberalizing and tariff-cutting bill. By 2015, when TAA got the last of its 18 renewals and upgrades, it had evolved into a sort of pilot program in active labor-market policy, offering a menu of self-help options appropriate to workers with widely differing career goals and local options: two years of job training for those seeking a new career path; temporary wage insurance for older workers taking lower-paying jobs; health care tax credits; and relocation support for workers planning to move to areas with more employment opportunities. Examining the results in 2018, New York Fed researcher Ben Hyman found strong benefits for workers and a useful concentration of benefits in regions with particularly high needs:
“Ten years out, TAA-trained workers have $50,000 higher cumulative earnings, driven by both higher incomes and greater labor force participation. Yet annual returns fully depreciate after ten years. … Returns are further concentrated in the most disrupted regions.”
Small scale and structural limits: TAA didn’t, though, actually serve many workers. From 2014 to 2018, according to the DoL’s annual reports, about 85,700 displaced workers a year got TAA benefits. This would be about 0.5% of the era’s 21.6 million annual layoffs. Modest use isn’t per se a problem — lots of workers find jobs after layoffs and don’t require extra support — but the limitation imposed by TAA’s tie to trade competition made it hard to get. Since eligibility depended on proving imports or job shifts overseas “contributed importantly” to the layoff, most workers — health sector, retail, gas stations, beauty parlors, government agencies — weren’t eligible at all. And though “contributed importantly” isn’t in principle a very high bar, in practice, it created a big obstacle by requiring workers in distress to find the statistics and economic analysis necessary to demonstrate eligibility.
And a core question: The TAA concept also, as Gresser and Maag noted in 2022, had a “troubling inequity” at its core:
Workers who lose jobs to trade competition can get more generous benefits than workers who lose jobs to recession or domestic competition. Is there really a strong ethical case to distinguish between (say) a displaced clothing factory worker and a displaced waitress or gas station attendant, and view the former as more in need of benefits or more entitled to benefits than the latter?
With the program then on the verge of lapsing, they urged Congress to renew it, but drop the trade requirement and offer TAA-type benefits to all workers displaced through no fault of their own. Subsequent events — events such as the Goodyear factory closure, where U.S. tariff increases rather than import competition are likely the “important contributor,” or the broader acceleration of technological change and outmoding of particular skills or industries — only add force to the conclusion. Congress regrettably didn’t act then, and TAA has lapsed for four years. The new Congress arriving next January, or the early-stage presidential campaigns launching around that time, can take it up now.

FURTHER READING
PPI’s New Skills for a New Economy project, with Michael Pearson as Director, has an analysis of a robust workforce development system that is fully-funded, modern, industry-responsive, and equips current and future workers with the skills they need to get ahead.
Gresser and Maag (2022) on re-authorizing Trade Adjustment Assistance, but opening it to everyone. Their estimate was that such a program would serve about a million displaced workers annually, at a cost of about $6 billion per year.
… and follow Maag’s work at Jobs for the Future.
Layoffs:
The Raleigh News & Observer reports on Goodyear’s Fayetteville factory closing announcement.
Eric Boehm in Reason takes a close look at the events, and the impact of tariffs and war.
And the Bureau of Labor Statistics’ Job Openings and Labor Turnover survey (most recent release here; and database here) puts individual events in the context of national job openings, new hires, layoffs, quits, and retirements.
TAA data and status:
The Labor Department’s TAA database, with counts of petitions and worker certifications from 2010 forward.
… and DoL’s formal Annual Reports on TAA from 2009 to the lapse in 2022.
An evaluation from Ben Hyman of the New York Fed, 2018.
And a Ways and Means Committee renewal hearing featuring workers, firm owners, and state officials, 2021.
ABOUT ED
Ed Gresser is Vice President and Director for Trade and Global Markets at PPI.
Ed returns to PPI after working for the think tank from 2001-2011. He most recently served as the Assistant U.S. Trade Representative for Trade Policy and Economics at the Office of the United States Trade Representative (USTR). In this position, he led USTR’s economic research unit from 2015-2021, and chaired the 21-agency Trade Policy Staff Committee.
Ed began his career on Capitol Hill before serving USTR as Policy Advisor to USTR Charlene Barshefsky from 1998 to 2001. He then led PPI’s Trade and Global Markets Project from 2001 to 2011. After PPI, he co-founded and directed the independent think tank ProgressiveEconomy until rejoining USTR in 2015. In 2013, the Washington International Trade Association presented him with its Lighthouse Award, awarded annually to an individual or group for significant contributions to trade policy.
Ed is the author of Freedom from Want: American Liberalism and the Global Economy (2007). He has published in a variety of journals and newspapers, and his research has been cited by leading academics and international organizations including the WTO, World Bank, and International Monetary Fund. He is a graduate of Stanford University and holds a Master’s Degree in International Affairs from Columbia Universities and a certificate from the Averell Harriman Institute for Advanced Study of the Soviet Union.