
‘Precious metal’ is now the U.S.’ top export

FACT:  “Precious metal” is now the U.S.’ top export.

THE NUMBERS: Gold, silver, and platinum share of U.S. exports, January-February* –

2026 12.70%
2025   4.30%
2024   4.60%
2023   4.70%
2022   4.20%

* USITC Dataweb

WHAT THEY MEAN: 

Asking the Senate for budget money late last month, Howard Lutnick claims the administration’s first-year policy adventures “dramatically reduced the trade deficit, lowered imports, and increased exports to over $3.4 trillion, a 6% increase from 2024.”

Mr. Lutnick’s stats are rarely precise, and no exception here. Four factual claims in twenty words, two of them wrong, two right.

The errors are on imports and balance, and pretty easy to clear up. Each month, the Census Bureau — a branch of Mr. L’s Department! — publishes the official U.S. trade data. Their most recent report shows that imports rose from $4.1 trillion to $4.3 trillion rather than getting “lower.” Vis-à-vis trade balance, the 2025 deficit was down by 0.2% if you combine goods and services, or up by 2.0% if you count goods alone. Reasonable people can debate whether this is “very slightly down,” “a little bit up,” or “essentially the same.” But either way, it isn’t “dramatic.”

The points about export growth are more interesting — factually correct, but in a strange and unsettling way. The figures, if you look at them in a little detail, turn out mainly to be a sharp rise in transfers of precious metal abroad. That in turn suggests less a useful jump in selling things to foreigners than financial unease, fading confidence, and maybe an exotic form of capital flight. Background –

The Census Bureau statisticians say that last year, American exports (goods and services combined) rose from $3.23 trillion to $3.43 trillion. That, as Mr. Lutnick says, is 6%, or more precisely 6.2%. This makes 2025 exactly the 21st-century median year for export growth, and a bit below the long-term 7.2% export growth average since 1960.

In most cases, a modestly higher export number may be dull, but it means Americans are selling more cars, airplanes, and soybeans abroad, getting more software downloads and movie screenings, etc., and/or that prices have gone up a bit. There’s some of both involved in last year’s figures, but neither farm-and-factory goods nor inflation is the main story. About two thirds of last year’s goods export growth — $68 billion of $117 billion — comes not from ships full of grain, LNG tankers, ro/ros stacked with cars, planes delivering semiconductors to waiting factories, and so forth, but the physical shipment of about 260 tons of gold from U.S. vaults under Wall Street, along with 17 tons of platinum and lots of silver, to London, Zurich, and Hong Kong.

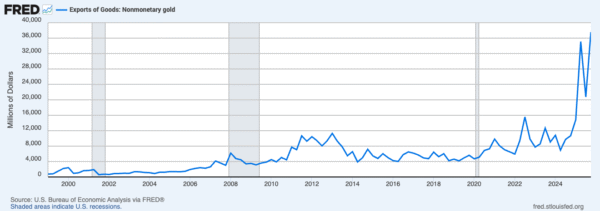
Early data for 2026 show this accelerating. Precious metals (HTS 72) typically make up about 4% of U.S. export values, and reached 7% over the course of 2025. By last February — the most recent month for which full data are up on the USITC’s Dataweb — they had reached 15%, overtaking energy, airplanes, agriculture, cars, chemicals, and other big items as the single largest U.S. export. (Yesterday’s Census trade release adds March figures, and appears about the same.) The jump — the St. Louis Fed presents gold shipments as a classic “hockey stick” graph – appears to reflect a combination of (a) higher prices, (b) investors guessing that precious metals may be better bets than stocks or dollars, and (c) central banks “repatriating” assets, likely thinking the U.S. isn’t as safe a place to hold valuable things as was a couple of years ago. A quick table of February’s top exports:

Total February 2026 goods exports  $195.1 billion
Gold, silver, platinum, precious metal products (HTS 72)   $29.4 billion
Energy   $25.2 billion
Chemicals (excluding pharmaceuticals)   $16.0 billion
Agriculture (USDA definition)   $14.7 billion
Airplanes   $12.2 billion
Automotive (vehicles and parts)   $10.0 billion
Semiconductors     $7.0 billion
Pharmaceuticals     $6.9 billion

So Mr. Lutnick was off on imports and balances. He did get export growth right, though, even though most of it seems to be money leaving the country. And he may well be right to say that Trump administration policies are at least in part responsible. As to whether that’s something to boast about …

FURTHER READING

PPI’s four principles for response to tariffs and economic isolationism:

  • Defend the Constitution and oppose rule by decree;
  • Connect tariff policy to growth, work, prices and family budgets, and living standards;
  • Stand by America’s neighbors and allies;
  • Offer a positive alternative.

Mr. Lutnick testifies at the Senate Appropriations Committee.

… Census’ monthly trade data has some correctives.

… and the St. Louis Federal Reserves “FRED” database has a classic “hockey stick” gold export graph.

Gold background –

Will the U.S. run out of gold? Not likely. The government owns 8,133 tons and so far hasn’t touched it. Also, the U.S. Geological Survey thinks there’s at least 15,000 tons still underground.

The U.S. Mint explains Fort Knox and the U.S. Bullion Depository.

USGS’ summary of gold production, trade, reserves, and uses as of 2025.

The World Gold Council tallies gold reserves by country

… and recaps prices since 2023.

ABOUT ED

Ed Gresser is Vice President and Director for Trade and Global Markets at PPI.

Ed returns to PPI after working for the think tank from 2001-2011. He most recently served as the Assistant U.S. Trade Representative for Trade Policy and Economics at the Office of the United States Trade Representative (USTR). In this position, he led USTR’s economic research unit from 2015-2021, and chaired the 21-agency Trade Policy Staff Committee.

Ed began his career on Capitol Hill before serving USTR as Policy Advisor to USTR Charlene Barshefsky from 1998 to 2001. He then led PPI’s Trade and Global Markets Project from 2001 to 2011. After PPI, he co-founded and directed the independent think tank ProgressiveEconomy until rejoining USTR in 2015. In 2013, the Washington International Trade Association presented him with its Lighthouse Award, awarded annually to an individual or group for significant contributions to trade policy.

Ed is the author of Freedom from Want: American Liberalism and the Global Economy (2007). He has published in a variety of journals and newspapers, and his research has been cited by leading academics and international organizations including the WTO, World Bank, and International Monetary Fund. He is a graduate of Stanford University and holds a Master’s Degree in International Affairs from Columbia Universities and a certificate from the Averell Harriman Institute for Advanced Study of the Soviet Union.


Read the full email and sign up for the Trade Fact of the Week.

Gresser in Politico Pro Morning Trade: Retailers warn 301 tariffs could backfire

[…]

Then, Ed Gresser, of the left-leaning think tank the Progressive Policy Institute, is expected to argue on Friday that the 301 rests on a flawed premise, warning that producing more than a country consumes “is normal and common” in global trade. He will add that it risks sweeping in countries where exports “appear to be normal cases of comparative advantage” rather than evidence of unfair practices, highlighting apparel production in places like Cambodia.

[…]

Read more in Politico Pro Morning Trade

Americans rank 4th in the world for median income, 44th for life expectancy

FACT: Americans rank 4th in the world for median income, 44th for life expectancy.

THE NUMBERS: U.K. “rank” if it were an American state –

Per capita income: 51st
Life expectancy 1st

 WHAT THEY MEAN: 

The gloomier sort of Brit has been muttering for 15 years about income comparisons with the United States. Here’s a sample from the London-based Social Market Foundation last year:

“[T]he UK’s failure to match higher incomes across the Atlantic has drawn particular attention and generated greater concern. Almost a decade ago, observers were suggesting that if the UK were an American state it would be the second poorest … More recently, commentators have used the gap to argue that ‘Britain is a developing country,’ or that the ‘hard working US is getting rich while the UK struggles on benefits.’”

Is the United States really that rich? In some ways, yes:

Statisticians at Our World in Data, scrutinizing World Bank stats on incomes and poverty rates, find Americans earning $72.07 in “international dollars” per person each day. Our World’s “international dollar” isn’t the green one in the wallet, but a hypothetical version that they’ve (a) normalized for inflation, (b) used “purchasing power parities” to avoid currency-valuation-based income skews, and (c) taken a “median” rather than a “mean” average to minimize effects of superwealthy individuals. Their list places Americans 4th among 115 countries. See below for some quibbles — they don’t include a few small high-income countries (e.g., Singapore, Kuwait, UAE, Qatar); some of the gap represents longer U.S. working hours rather than higher pay as such; and (see below) the U.S. fares less well on “wealth” than “income.” But nonetheless, $72.07 per day for the median American is a lot — 32% above the median Brit’s $54.55, 70% above Japan’s $42.10, and five times China’s $13.36. So Americans do indeed earn a lot of money. Here’s a sample of Our World’s findings:

Median daily income, international PPP dollars* –
  1. Luxembourg $89.49
  2. Norway $77.76
  3. Switzerland $72.29
  4. United States $72.07
15. United Kingdom $54.55
25. Japan $42.10
58. China $13.32

So World Cup visitors to the U.S. venues this June may be a little envious of American affluence. Americans shouldn’t be spiking any spherical footballs, though. Here’s a mirror-image U.S.-U.K. comparison from gloomy researchers at Johns Hopkins University in Baltimore:

“Why has the U.S. fallen behind in health? … Forty years ago, babies born in the U.S. and the U.K. could expect to live to the same age. Today, however, life expectancy is several years shorter on our side of the Atlantic Ocean. What’s going on? In a new analysis of 2023 data from the U.S. and England and Wales, this report finds that differences in four preventable causes of death can explain the entire 2.7-year gap in life expectancy: cardiovascular disease, overdose, motor vehicle crashes, and gun violence.”

So if Americans might earn more money, they have less time to enjoy it. The Centers for Disease Control’s most recent life-expectancy report takes the data through 2024, and finds Americans expecting 79 years at birth. This represents full recovery from the COVID pandemic drop and closes a bit of the transatlantic gap, but still leaves Americans fully two years below the U.K.’s 81-year life expectancy. Flipping the Social Market Foundation’s Brits-at-the-bottom premise, the U.K. would likely tie for first with Hawaii among American states for life expectancy. On a world scale, the World Bank’s full span of cross-country life expectancy comparisons, all from 2024 and excluding micro-states, tax havens, and small dependencies, places the U.S. 44th. Another short table, with more complete stats below:


Japan 84 years
Australia 83 years
UK 81 years
U.S. 79 years
China 78 years


A $72.07 vs. $54.55 daily earnings gap is the equivalent of $6,400 a year. If asked whether they’d sacrifice that to get two more years of life, lots of Americans would probably accept.

Why the difference? Drawing from the JHU report and KFF analysis, the life-expectancy divide appears (a) mainly related to public health and social issues, and (b) possible to close. Two ways to look at this:

1. Causes: Kaiser Foundation researchers point out two big contributors to the gap:

i. Homicides and drug overdoses: About a quarter of the gap vis-à-vis America’s European and Asian peer economies — about six months’ worth of life — reflects higher U.S. rates of firearm crimes and drug overdoses. America’s homicide rate, at 5.8 per 100,000 people annually, compares poorly to Poland’s 1.0 homicides per 100,000 people, the U.K.’s 1.2, and France’s 2.3. Across the Pacific, Singapore’s 0.1 homicides per 100,000 people is the world’s lowest rate, with Japan’s 0.2 and China’s 0.5 not much higher. Likewise, KFF reports that the U.S. rate of death from drug overdoses and alcohol poisoning (as of 2023) was 29 per 100,000 people, about six times the 5 deaths per 100,000 people rate in other high-income countries.

ii. Heart and lung diseases: Most of the rest, about a year’s worth, reflects higher U.S. rates of lung and heart diseases in middle and old age. Here, the main issues appear to be diet, obesity, smoking, and exercise rates.

2. Disparities: The U.S.’s 79-year expectancy is a national median. CDC statisticians haven’t completed their analysis by states and regions, and by race and ethnicity, for 2024, but earlier years are suggestive. As of 2022, state life expectancies varied by eight years, from West Virginia’s 72 years to the European-standard 80 years in Massachusetts and Hawaii. By race and ethnicity (as of 2023), the range is wider still: 70 years for Native Americans, 74 years for African Americans, 78 years for white Americans, a European-standard 81 years for Hispanics (including 82 for Puerto Ricans), and a world-standard 85 years for Asian Americans.

So: The causes are complex social and policy problems, but not totally intractable. The U.S. homicide rate peaked in the 1980s at 11.6 per 100,000 and has since fallen by half. Drug overdose deaths, meanwhile, peaked early in 2023. As treatment has grown more easily available and public awareness campaigns have become more effective, overdose deaths have dropped about 40%. Gaps between states likewise suggest that local policies can have large impacts.

And as far as doleful cross-country comparisons go, Americans are high earners. Doubtless, there are things others can learn from us on that. There’s a lot we can learn as well.

FURTHER READING

PPI’s four principles for response to tariffs and economic isolationism:

  • Defend the Constitution and oppose rule by decree;
  • Connect tariff policy to growth, work, prices and family budgets, and living standards;
  • Stand by America’s neighbors and allies;
  • Offer a positive alternative.

U.S./U.K.

Speaking to Congress yesterday, King Charles reflects on the U.S.-UK alliance past and present. (Or video via C-SPAN.)

The London-based Social Market Foundation analyzes high American incomes.

While Johns Hopkins University researchers in Baltimore reflect on long British lives.

How rich is America? 

Our World in Data tracks daily income and consumption by country, finds Americans super-rich.

Much the same in the OECD’s table of PPP-based median incomes.

The World Bank’s Gross National Income per capita table has a more complete list of countries.

And UBS’s 2025 Global Wealth Report offers a different perspective. This tries to estimate median “wealth” — that is, the value of someone’s property, savings, and belongings, minus debt — as opposed to income. Their results for Americans don’t quite glitter like the income data: Americans average $124,000 in per-adult wealth, and rank 15th in the world, noticeably below 8th-place Britain’s $176,000. Setting aside tax-haven Luxembourg’s $395,000 as anomalous, UBS reports Australians to be the world’s richest people, with $268,000 in wealth per adult.

Why so short-lived?

CDC on U.S. life expectancy (as of 2024).

… by state (2022).

… by race and ethnicity (2023,

The Kaiser Foundation has data on U.S.-v.-peer life expectancy gaps.

… and their origins.

For broader context, the World Bank’s full table has life expectancy at birth for 270 countries, territories, and regions. Two European micro-states — Monaco and San Marino — lead the ranking with 86-year life expectancies. Chad and Nigeria are lowest on the table, both with 55. A representative list:

Japan 84 years
Sweden 84 years
Spain 84 years
France 83 years
Italy 83 years
Korea 83 years
Australia 83 years
Canada 82 years
Germany 81 years
UK 81 years
Chile 81 years
High-income average  80 years
Albania 80 years
United States  79 years
China 78 years
Jordan 78 years
Thailand 77 years
Brazil 76 years
Ukraine 75 years
Mexico 75 years
Vietnam 75 years
World average  73 years
Russia 73 years
India 72 years
Senegal 69 years
Pakistan 68 years
Fiji 67 years
South Africa 66 years
Low-income average  65 years
Central African Republic 58 years
Chad 55 years
Nigeria 55 years

ABOUT ED

Ed Gresser is Vice President and Director for Trade and Global Markets at PPI.

Ed returns to PPI after working for the think tank from 2001-2011. He most recently served as the Assistant U.S. Trade Representative for Trade Policy and Economics at the Office of the United States Trade Representative (USTR). In this position, he led USTR’s economic research unit from 2015-2021, and chaired the 21-agency Trade Policy Staff Committee.

Ed began his career on Capitol Hill before serving USTR as Policy Advisor to USTR Charlene Barshefsky from 1998 to 2001. He then led PPI’s Trade and Global Markets Project from 2001 to 2011. After PPI, he co-founded and directed the independent think tank ProgressiveEconomy until rejoining USTR in 2015. In 2013, the Washington International Trade Association presented him with its Lighthouse Award, awarded annually to an individual or group for significant contributions to trade policy.

Ed is the author of Freedom from Want: American Liberalism and the Global Economy (2007). He has published in a variety of journals and newspapers, and his research has been cited by leading academics and international organizations including the WTO, World Bank, and International Monetary Fund. He is a graduate of Stanford University and holds a Master’s Degree in International Affairs from Columbia Universities and a certificate from the Averell Harriman Institute for Advanced Study of the Soviet Union.
Read the full email and sign up for the Trade Fact of the Week.

Gresser in Articles of Interest: Taxes and Tariffs

In this episode of Articles of Interest, Ed Gresser discusses the gender disparity in tariff rates, especially how tariff rates on women’s clothing were, on average, 16.7% in 2022 — 2.9 percentage points higher than the 13.6% average tariff rate for men’s clothing.


Schools can get much better

FACT: Schools can get much better.

THE NUMBERS: Mississippi 4th-grade reading scores, compared to national averages –

2024  +4
2022  +1
2017   -6
2011  -11
2007  -12
2000  -14

WHAT THEY MEAN: 

Next month, Mississippi’s 235 high schools will send 28,000 graduating seniors off carrying their diplomas to first jobs, military service, college dorms, gap years, etc, and adult life. The 28,000 figure represents a 90.8% graduation rate, the highest in Mississippi history and one of America’s 10 highest. By contrast, when this spring’s grads arrived in kindergarten in 2012, Mississippi’s graduation rate was 75%, tied with Alabama for the country’s 6th-lowest rate. What has happened? And what might school-watchers learn from it?

Offering lessons drawn from her two decades of hands-on experience with Mississippi school reform, PPI Education Director Rachel Canter argues in PPI’s newest research paper that to make American schools a lot better, reformers should avoid hoping for miracles. They should run marathons instead. Background, and then some conclusions:

Every three years since 2000, the U.S. has joined 37 other OECD members, and 57 other interested governments abroad, in the Programme for International Student Assessment (“PISA” for short). Every three years, PISA tests 5,000 15-year-olds in each participating country on reading, science, and math, and then publishes assessments of student achievement that governments, parents, and educators can compare both over time and among countries. The data span some big U.S. national education reform efforts — No Child Left Behind, Race to the Top, Common Core — and, a little dishearteningly, show American school performance staying about the same. The newest results are from the 2022 tests — 2026 figures arrive in September — and almost perfectly match the oldest:

Year  Reading Math Science
2022 504 465 499
2018 505 478 502
2012 498 481 497
2009 500 487 502
2000 504 493 499

PISA’s rankings of American students vis-à-vis foreign countries are a little more variable than their scores, but tell a similar story. Just as U.S. school performances typically show New England at the top, the Deep South and Southwest at the bottom, and the others in between, each PISA comparison has put East Asian schools — Singapore, Hong Kong, Japan, Taiwan – first, with Canada and some smaller northern European countries (Estonia, Switzerland, Ireland) a shade below. U.S. students usually score a bit above the world median and a tier below the best performers. Since 2000, they’ve placed in a range from 8th to 17th in reading, 25th to 30th in math, and 10th to 20th in science. The U.S.’ best-ever ranking was 6th in reading in 2022, not because that year’s American teens improved on their elders’ performance, but because foreigners’ pandemic scores fell more sharply than America’s. In essence, U.S. schools get a sort of “B-” average, sustained with little change throughout the 21st century.

This sort of result can lead to fatalism and passivity. If big national efforts don’t change outcomes much, and what matters instead are locality and family commitments (or even more dispiriting, amorphous cultural or historical factors), why bother?  But Canter’s in-depth review of Mississippi’s reading progress shows that fatalism is wrong.

Outside stereotypes of Mississippi mix high culture and outsized historic impact – Faulkner and Welty, Delta blues, the civil rights movement — with low incomes, social stratification, outmigration, poor health, and white flight from public schools. School outcomes before 2010 didn’t do much to disprove this, generally placing Mississippi in the bottom five, if not 49th or 50th. But this spring’s graduates are leaving a school system very different from the one they joined in 2012. Mississippi’s reading ranking, for example, is up to 9th nationally — best in the south and at par with Connecticut and Utah — and Canter notes that “normalizing” data for family income would put Mississippi’s teenage readers first in the country.

How did this happen? Canter objects to the commonly used term “Mississippi miracle”. (A “miracle” implies divine intervention, or some unexpected flash of insight enabling rapid and easy change, and little actual work.) Instead, she attributes Mississippi’s schooling rise to a long “marathon” of stable and essentially non-partisan policy basics, dutifully implemented over a period of years. Her list of “policies” is shorter than the description of their steady implementation in practice:

  • A reading competency law in 2013 that required holding back students who don’t pass a reading exam, along with special help for struggling students

  • Support for teachers in understanding and using better practices, like scientifically based reading instruction

  • Annual “A to F” grades for schools based on student achievement, with state intervention in schools at the bottom.

In sum: Using the “marathon” metaphor, over the life of one school cohort — from their arrival as kindergarteners in the autumn 15 years ago, to the spring morning when they break the tape as graduates — Mississippi’s schools got much better.

So: As Mississippi’s May grads flip their tassels, tired school reformers should take heart from their story. Mediocre schools can, in fact, become very good, and good ones can become great.

FURTHER READING

PPI’s four principles for response to tariffs and economic isolationism:

  • Defend the Constitution and oppose rule by decree;
  • Connect tariff policy to growth, work, prices and family budgets, and living standards;
  • Stand by America’s neighbors and allies;
  • Offer a positive alternative.

Mississippi Marathon:

PPI’s Reinventing America’s Schools project.

PPI’s Rachel Canter explains the “Mississippi Marathon” in the Atlantic (subs. req.).

… and provides the full picture at PPI.

Canter’s Mississippi First nonprofit advocates for education reform, reading programs, and public charter schools. (PPI note: The name dates to 2008, and has no relationship to current administration slogans.)

And the Mississippi Education Department.

U.S. data:

The Education Department’s “National Education Report Card” has maps with state-by-state rankings and scores for reading, math, and science.

… and from the same source, a look at Mississippi schools’ changing fortunes, 1992-2024.

Good examples abroad:

The OECD’s Programme for International Student Assessment has data and analysis of school performance in the 38 OECD member countries, plus 57 “partner” countries also joining the PISA assessments.

Singapore topped the last PISA rankings in 2022. The Education Ministry reviews the elementary school curriculum.

Estonia gets Europe’s highest scores. Education Estonia explains.

Japan places the highest among large-population countries. The U.S.-based National Center on Education and the Economy has an enthusiastic review.

Ireland’s National Council for Curriculum and Assessment.

ABOUT ED

Ed Gresser is Vice President and Director for Trade and Global Markets at PPI.

Ed returns to PPI after working for the think tank from 2001-2011. He most recently served as the Assistant U.S. Trade Representative for Trade Policy and Economics at the Office of the United States Trade Representative (USTR). In this position, he led USTR’s economic research unit from 2015-2021, and chaired the 21-agency Trade Policy Staff Committee.

Ed began his career on Capitol Hill before serving USTR as Policy Advisor to USTR Charlene Barshefsky from 1998 to 2001. He then led PPI’s Trade and Global Markets Project from 2001 to 2011. After PPI, he co-founded and directed the independent think tank ProgressiveEconomy until rejoining USTR in 2015. In 2013, the Washington International Trade Association presented him with its Lighthouse Award, awarded annually to an individual or group for significant contributions to trade policy.

Ed is the author of Freedom from Want: American Liberalism and the Global Economy (2007). He has published in a variety of journals and newspapers, and his research has been cited by leading academics and international organizations including the WTO, World Bank, and International Monetary Fund. He is a graduate of Stanford University and holds a Master’s Degree in International Affairs from Columbia Universities and a certificate from the Averell Harriman Institute for Advanced Study of the Soviet Union.
Read the full email and sign up for the Trade Fact of the Week.

Trump administration tariffs haven’t achieved their goals

FACT: Trump administration tariffs haven’t achieved their goals.

THE NUMBERS: Manufacturing share of U.S. GDP –

2025   9.40%
2024   9.80%
2016 10.80%

WHAT THEY MEAN: 

Every March for the last half-century, per the Trade Act of 1974, the staff at the U.S. Trade Representative Office has written up a formal report on the administration’s trade goals for the coming year, entitled “The President’s Trade Agenda,” and sent it to Congress. A month later, the two Congressional Committees responsible for trade policy — Ways and Means in the House, Finance in the Senate — fetch them up for a public hearing to explain it. Last year’s hearings, a week after the Trump administration’s April 2 International Emergency Economic Powers Act (IEEPA) tariff decree, were a bit rocky. They did, though, extract an explanation of what the administration wanted the decree to do. Here’s Amb. Greer:

“The deficit [i.e., trade balance] needs to go in the right direction. Manufacturing as a share of GDP needs to go in the right direction.” 

A year later, tariffs are deeply unpopular, and the Supreme Court has demolished the April 2 decree and its seven “IEEPA” companions. Nonetheless, the administration has kept a jury-rigged high-tariff system in place through claims of a “balance of payments crisis” and constantly shifting Commerce Department “national security” decrees. Yale BudgetLab calculations estimate that the average U.S. tariff rate is 11.8% this week — down from a 19% peak last summer, but still nearly five times the 2.5% average of January 2025. The administration’s pitch to the Committees last year was that even if tariff decrees imposed “some pain” on families — two-dolls-per-girl rations, broader price increases, etc. — and damaged the Constitutional separation of powers, the benefits of a lower U.S. goods-trade deficit and a relatively larger manufacturing industry would outweigh the harms.

With Amb. Greer’s return engagements coming up — likely next week — how is it working out? Trade balance and GDP shares are secondary and tertiary stats, and not necessarily the right measurements of success. (As an example, very rapid growth in digital industries would mean the GDP shares of the other sectors shrink even if they’re all doing fine.) Many would prefer examining trade policy’s contributions to primary indicators like economic growth, job creation, stable prices, and low unemployment. But balance and GDP share are at least specific and measurable. Here’s a look at how the trade balance and the manufacturing share of GDP have changed, set against “pain” and Constitutional questions:

1. Trade balance: Not yet clear. The trade-balance stats for 2025 and 2024, with 2016 — the Obama administration’s final year, before the first Trump administration’s tariff increases in mid-2018 – added as a longer-term comparison, look like this:

2016 2024 2025
Goods and services -$479 billion    -$904 billion    -$901 billion
Goods only -$750 billion -$1,215 billion -$1,241 billion
Manufacturing only -$647 billion -$1,202 billion -$1,236 billion
Trade balance/ GDP ratio    2.7%   3.1%   3.0%

Census for goods/services and goods balances; BEA’s GDP database for trade balance/GDP ratio; U.S. International Trade Commission Dataweb for manufacturing-only balance (NAICS basis).

So, not much change. The 2025 deficit was about the same as that of 2024, and larger than that of 2016. (PPI note: Comparing dollar-value trade balances over long periods of time is usually misleading, as the figures don’t account for inflation and GDP growth. For 2016, the GDP ratio is best.) On Amb. Greer’s side, though, Census’ monthly figures might be trending down: up sharply in early 2025 as businesses rushed to get low-tariff goods in before tariffs rose; back down by summer as inventories filled; and a few more downward than upward spikes since then.

2. Manufacturing share of GDP: Down. The manufacturing share of U.S. GDP fell from 9.8% of GDP in 2024 to 9.4% in 2025. Job figures concur — manufacturing hiring fell by about 400,000 in 2025, and factories shed 108,000 jobs on net. Conclusions after one turbulent year might be premature, but in 2016 the manufacturing share of U.S. GDP was a lot higher – 10.8% – so post-2017 tariff increases haven’t lifted it. This shouldn’t be a surprise, as U.S. manufacturers are some of the country’s largest importers – Census finds them buying $1.2 trillion of $2.9 trillion in known goods imports in 2024 (latest year available) – and are presumably now carrying some of the heaviest Trump tariff burdens.

Overall, last year’s GDP-share trend looks like the one you’d expect from a general tax on purchases of physical goods. BEA data show the shares of mining, construction, manufacturing, restaurants, and retail all down a bit, and that of agriculture flat, while the corresponding shares of financial services, legal services, information industry, and health grew. So as tariffs raised goods costs, manufacturers, along with other big goods-buyers, shrank relative to industries that spend relatively less of their money on physical goods, and more on services and investment.

3. How much pain? Mr. Trump’s 2024 platform promised to “defeat inflation and quickly bring down all prices.” Tariffs, by contrast, are meant to raise prices, and that’s happened. Harvard Business School’s tariff price tracker follows prices for a basket of tariffed goods and similar domestic goods. It finds that the tariffs have raised prices by about 7.0% above trend rise for the imported things, 4.6% for the domestic substitutes, and 0.8% across the entire goods-and-services economy. Federal Reserve economists concur. Spread across families, a Joint Economic Committee calculation finds this has cost families about $1,750 per household on average.

4. And the Constitution? Returning to USTR’s report, the 2026 version of the “President’s Trade Agenda” report has a startling second line: “[T]he Constitution is our most important trade agreement.” If so, the Trump administration has a big trade-agreement compliance problem. Article I’s first “enumerated power” – “Congress shall have power to lay and collect Taxes, Duties, Imposts, and Excises” – is pretty clear. So is the third sentence, assigning Congress the power to “regulate Commerce with foreign Nations.” If a president can set new tariff rates at will by declaring emergencies, and can conclude ‘deals’ with foreign countries altering both U.S. tariff rates and U.S. regulations without Congressional approval or negotiating objectives, do these clauses mean anything?

The Committees have lots to ask about next week.

FURTHER READING

PPI’s four principles for response to tariffs and economic isolationism:

  • Defend the Constitution and oppose rule by decree;
  • Connect tariff policy to growth, work, prices and family budgets, and living standards;
  • Stand by America’s neighbors and allies;
  • Offer a positive alternative.

Documents:

The Constitution; see Article I, Section 8, for authority over tariffs and trade regulation.

USTR’s “President’s Trade Agenda” reports for 2026 and 2025.

The White House’s April 2nd, 2025, “IEEPA” decree.

The Supreme Court’s Feb. 20, 2026 Learning Resources v. Trump opinion striking it down, along with the IEEPA decrees related to India, fentanyl, Brazilian court cases, etc.

The White House’s February “Balance of Payments Emergency” decree, currently in effect but under court challenge.

And the Commerce Department backs away from its August attempt to define condensed milk and balance beams as “steel or aluminum derivative products”, but raises tariffs on a lot of appliances and other metal things instead.

Data:

Census’ monthly FT-900 trade data reports have exports, imports, balances, etc., through February 2026.

BEA’s GDP figures (and use “GDP by Industry” for manufacturing specifically),

Yale BudgetLab calculates tariff rates.

Harvard Business School professors track price increases.

Fed economists report similar results last week.

Public:

A February Trade Fact takes a deep dive into trade and tariff polling over 2025 and early 2026. Summary: As Amb. Greer spoke to the Committees last April, a broad average across polls suggests that the public opposed Mr. Trump’s tariff decrees by about 60% to 35%, and little has changed since.

And a last look back at the IEEPA decrees:

As a tax matter, in the end, the administration’s eight “IEEPA” tariff decrees raised “negative $4 billion” in revenue and arguably “negative $9 billion.” Though Customs and Border Patrol’s “Trade Statistics” page still mournfully says buyers paid $166 billion in the IEEPA tariffs, CBP now has to pay all it all back with interest  By PPI Fiscal Policy Analyst Alex Kilander’s calculations, the decision to defend the IEEPA decrees all the way to the Supreme Court means at least $4 billion in extra liability for taxpayers. Here’s why:

The administration lost its IEEPA case at the Court of International Trade on May 28, 2025. The decision to appeal this all the way to the Supreme Court appeals stretched the litigation out until February 20, 2026. That would be 268 days. As the IRS explains, ordinary Treasury borrowing pays about 4% interest (a rough average; longer-term T-bills pay higher rates than shorter-term), but interest on mistakenly or illegally collected money costs 7%. Anyone who has contemplated buying a house feels intuitively uneasy seeing that sort of spread. Kilander has the formula:

T-bill borrowing rate proxy:    $166 billion * (1 + 0.04/2)2*0.75  = $171 billion
Tariff refund with interest: $166 billion * (1 + 0.07/365)365*0.75  = $175 billion

In sum, the administration’s 268 days of litigation meant an extra 3% interest on its borrowing. Assuming spending patterns remained the same, that means they (more precisely, “we,” as taxpayers) are out $175 billion, an extra $4 billion. Or, had it decided to scale back the ‘reconciliation bill’ after the Court of International Trade loss and not borrow the $166 billion at all, we would have saved $9 billion.

ABOUT ED

Ed Gresser is Vice President and Director for Trade and Global Markets at PPI.

Ed returns to PPI after working for the think tank from 2001-2011. He most recently served as the Assistant U.S. Trade Representative for Trade Policy and Economics at the Office of the United States Trade Representative (USTR). In this position, he led USTR’s economic research unit from 2015-2021, and chaired the 21-agency Trade Policy Staff Committee.

Ed began his career on Capitol Hill before serving USTR as Policy Advisor to USTR Charlene Barshefsky from 1998 to 2001. He then led PPI’s Trade and Global Markets Project from 2001 to 2011. After PPI, he co-founded and directed the independent think tank ProgressiveEconomy until rejoining USTR in 2015. In 2013, the Washington International Trade Association presented him with its Lighthouse Award, awarded annually to an individual or group for significant contributions to trade policy.

Ed is the author of Freedom from Want: American Liberalism and the Global Economy (2007). He has published in a variety of journals and newspapers, and his research has been cited by leading academics and international organizations including the WTO, World Bank, and International Monetary Fund. He is a graduate of Stanford University and holds a Master’s Degree in International Affairs from Columbia Universities and a certificate from the Averell Harriman Institute for Advanced Study of the Soviet Union.

Read the full email and sign up for the Trade Fact of the Week.

U.S. Customs blocks about $0.8 billion worth of goods a year on suspicion of ‘forced labor’

FACT: U.S. Customs blocks about $0.8 billion worth of goods a year on suspicion of ‘forced labor.’

THE NUMBERS: For 2021 –

World goods exports $22.290 trillion
U.S. goods imports   $2.849 trillion
Illegal profit from industrial and agricultural forced labor*        $40 billion
US imports blocked by CBP for suspected forced labor content        <$1 billion

* International Labour Organization estimates, 2024. “Industry” includes manufacturing, mining, construction, and utilities.
** CBP statistics.

WHAT THEY MEAN: 

The Treasury Secretary, Scott Bessent, explains the Trump administration’s plan to replace its 2025 International Emergency Economic Powers Act (IEEPA) tariff decrees with new ones using different laws:

“Six Justices … ruled that IEEPA authorities cannot be used to raise even one dollar of revenue. This administration will invoke alternative legal authorities to replace the IEEPA tariffs. We will be leveraging Section 232 [a “national security” law run by the Commerce Department] and Section 301 [see below] tariff authorities that have been validated through thousands of legal challenges. Treasury’s estimates show that the use of Section 122 authority, combined with potentially enhanced Section 232 and Section 301 tariffs, will result in virtually unchanged tariff revenue in 2026.”

Six weeks later, Bessent’s neighbors at the U.S. Representative Office have now duly launched two “Section 301” cases. The first, on “Structural Excess Capacity,” says manufacturing industries in 16 trading partners are too big. (Our view in short: it’s neither economically nor legally serious, and has an inappropriate acronym.) The second charges that the top 60 U.S. trading partners — from the European Union to the Bahamas — are hurting America’s economy by failing to sufficiently combat trade in goods produced by forced labor. This one also seems legally shaky, but at least identifies a real phenomenon and moral challenge. Some observations:

U.S. law has barred imports of goods made by prisoners since the “McKinley Tariff” of 1890. (Though at least one U.S. prison routinely exports goods made by inmates; see below.) The 1930 Tariff Act (“Smoot-Hawley”) then banned imports of goods made with forced labor, unless buyers could show there was no available U.S. substitute. Most recently, an Obama-era law passed in 2016 banned any imports of goods with a “reasonable suspicion” of forced labor content. In sum, for the past decade the U.S. has banned all forced labor imports.

“Section 301,” a trade law dating to 1974, allows U.S. administrations to identify “an act, policy, or practice” of a foreign government which is in some way “unreasonable or discriminatory and burdens or restricts U.S. commerce,” and gives them a right to use tariffs as a negotiating tool to fix the problem. USTR’s argument for using it here runs as follows: (a) many foreign countries lack a law banning imports of goods made with forced labor like America’s, so (b) they may be incorporating forced labor goods as inputs to their manufacturing industries, which (c) might allow them to produce goods more cheaply than similar American stuff, and therefore (d) this would justify a U.S. tariff to offset this supposed advantage.

1. Law: As a legal matter, then, their argument is that the absence of a particular policy — a law similar to America’s — is the same as actually having the requisite unreasonable policy. This sounds like a stretch, but courts will decide.

2. Economics: USTR’s Federal Register Notice announcing the investigation doesn’t offer evidence that countries on its list are buying any forced labor goods, but says that “none of these countries has adopted and effectively enforced a forced labor import prohibition to date,” and this “may negatively affect U.S. commerce.” How much, then, can we really know? Reliable facts on forced labor are scarce — as is typical of criminal enterprises — but international research and U.S. data both suggest that the scale of forced-labor trade is probably small.

* International evidence: International Labour Organization reports in 2022 and 2024 (which USTR uses as points of reference for its “301” investigation), say that 27.6 million of the world’s 3.22 billion workers were in various forms of forced labor as of 2021 — most commonly, people trapped in jobs when executives withhold pay or confiscate passports. This includes 8.4 million in “industry” (by which the ILO means manufacturing, mining, utilities, and construction), out of an 800-million worldwide total, and 2.1 million of 916 million farm and agriculture workers. They say forced labor is “highest in severity and scale” in “informal micro- and small enterprises operating at the lower links of supply chains in high-risk sectors and locations,” and that with respect to trade destined for wealthier countries, forced labor is likely most common in “raw materials production in the lower tiers of supply chains of consumer goods.”

“Illegal profits” from forced labor, the ILO researchers believe, totaled $236 billion in 2021. About three-quarters of this – $172 billion – came from sex trafficking. Forced-labor profits “industry” totaled $35 billion, and from agriculture $5 billion. The ILO doesn’t speculate on how much of the combined $40 billion came from purely domestic sales and construction contracts, and how much from exports of goods. But in an extreme case, if all of the $40 billion came from goods exports, about 0.2% of the world’s $22.3 trillion in 2021 goods exports would contain some forced labor content. As to effects on trade flows, if forced-labor businesses sold at market prices and pocketed the full $40 billion in profits at the expense of exploited workers, there wouldn’t be a price effect or a “burden on commerce,” but it seems likely that they would sell somewhat cheaper, losing some profit but gaining illicit market share.

* American data: Since passage of the 2016 law, CBP has imposed 55 “Work Release Orders” to block imports of goods worth $3.08 billion, or about $400 million a year. Seizures under a second law, the Uyghur Forced Labor Prevention Act, were about the same. Annual U.S. goods imports during this time averaged a bit above $3 trillion, so the combined $0.8 billion in seizures would be about 0.03% of U.S. import value. Meanwhile, as former U.S. trade/labor negotiator Desiree LeClercq notes, neither the 1930 nor the 2016 law actually bans export of U.S.-made goods produced with forced labor. DHS reporting, for example, shows that 5% of forced labor prosecutions in the United States show up in agriculture, and an unstated but non-zero number in manufacturing, so some U.S. exports to other countries may also contain forced-labor content.

In sum, international research and U.S. data do suggest that some products flowing between countries are made by coerced workers. But the total is likely small relative to trade flows or U.S. industry — and to the $166 billion IEEPA tariffs Bessent wants to restore. And again, the USTR hasn’t provided evidence that countries on its 60-partner list are knowing (or even unwitting) buyers. Nor for that matter is the U.S. law necessarily the world’s best: LeClercq argues that the European Union’s forced labor policy, set to enter into force next year, is better than America’s, since its program does ban exports of European goods made with forced labor, and has stronger due process rules on import cases.

3. Conclusion: International trade isn’t the core forced labor problem, and forced labor likely has only a modest influence on trade flows. But a systematic program to reduce the amount of forced labor worldwide — including keeping forced-labor goods out of the U.S. and forced-labor U.S. goods out of world markets, as will as improving laws and compliance elsewhere — would be admirable regardless of the problem’s scale. And if the administration wants ideas for such a program, it needn’t look far: the Biden administration actually ran one, combining USAID and Labor Department project support with CBP enforcement programs, diplomacy, and trade negotiations.

Bessent’s comments, though, indicate that the Trump administration simply plans to use forced labor as a pretext to recreate the IEEPA tariffs, just as its first IEEPA decrees in 2025 used fentanyl deaths as a pretext for tariffs on Canadian and Mexican goods. This isn’t admirable. And if courts take Bessent at his word, they may conclude that the investigation is an illegal use of Section 301, meant not to address a “burden on U.S. commerce” but to bypass Congress and create a new tariff system by decree. As we’ve said before, the Constitution gives Congress, not presidents, the power to set tax rates, including tariffs. If the administration wants a higher tariff rate, it should simply follow the Constitution and ask Congress to pass a bill.

FURTHER READING

PPI’s four principles for response to tariffs and economic isolationism:

  • Defend the Constitution and oppose rule by decree;
  • Connect tariff policy to growth, work, prices and family budgets, and living standards;
  • Stand by America’s neighbors and allies;
  • Offer a positive alternative.

Treasury Secretary Bessent (Feb. 20) says 301 cases will replace “IEEPA” tariffs.

U.S. Trade Representative’s March Federal Register Notice announcing “Section 301” investigation of forced labor laws.

And the “Section 301” text.

Compare & contrast:

The Biden administration reviews its four-year program against forced labor and human trafficking.

International research and data:

The International Labour Organization studies the scale of forced labor as of 2021.
… and the profits drawn from it.

U.S. data and policy:

CBP’s reports on Work Release Orders since 2017.

… similar data on Uyghur Forced Labor Prevention Act seizures.

And LeClercq’s critique of U.S. law notes a lack of due process and spotty enforcement. Her close:

“Like its other Section 301 investigations, USTR is inviting public comments before making its determination. I hope the CBP’s lax evidentiary standards, weak procedures, and questionable commitment to enforcement, along with U.S. forced labor practices, come to light. The U.S. administration must fully reckon with these deficiencies before imposing U.S. models on the world.”

And two U.S. stories:

An Atlanta Journal-Constitution report (2022) on an agricultural forced labor case involving onion and blueberry farming in Georgia. It’s not clear whether the produce was for strictly domestic sale or involved exports as well.

And in regard to prison labor: Eastern Oregon Correctional Institution inmates make denim jeans and shirts — “Prison Blues” — and market them in Europe and Asia via distributors in Japan, Germany, and the Netherlands. PPI editorial note: This isn’t necessarily bad — voluntary, paid, and regulated prison work can help inmates develop work habits that ease reintegration to society — but an embarrassing contrast to U.S. import policy.

U.S. Gasoline Prices Rose from $2.98 to $4.02 per Gallon Last Month

FACT: U.S. gasoline prices rose from $2.98 to $4.02 per gallon last month.

THE NUMBERS: Price increases since late February –

Crude oil 90%
Polyethylene (plastic base) 37%
Gasoline 36%*
Urea (fertilizer base) 12%

American Automobile Association (AAA) calculations for the United States, regular grade.

WHAT THEY MEAN: 

Named for a medieval Arab kingdom famous enough for its 17th-century wealth to serve as a chapter headline in Paradise Lost, the Strait of Hormuz connects the mostly land-locked Persian Gulf to the open-water Gulf of Oman and the Indian Ocean. A look at the implications, and the impact to date, of its closure:

  1. Geography: The Strait is one of 24 narrow, heavily traveled ocean channels (“maritime chokepoints”) supply-chain analysts identified in Nature last November as posing special global-economy risk from natural disasters, shipping accidents, pirate attacks, and conflicts. Shaped like an upside-down “U,” it is about 110 miles long and 30 miles wide — Iran’s Bandar Abbas port on the north, Oman’s Musandam governate on the south — and 200 meters deep. A large ship needs about two hours for the transit.
  2. Use: The Strait is the maritime outlet for nearly all the energy the four small Gulf monarchies (Kuwait, Qatar, Bahrain, and the United Arab Emirates) produce, and for about 90% of Iranian and Iraqi output. About 100 vessels a day transited last year, like cars on a highway, with incoming ships using a two-mile-wide northern “lane” near Iran and outgoing vessels a similar “lane” on the southern side. Container ships and roll-on/roll-off vessels ferry in consumer goods and cars, while oil tankers and bulk carriers carry out aluminum, fertilizer, crude oil, and natural gas. Tanker traffic usually totaled about 35 vessels per day, carrying an average of 40 million barrels of oil to customers abroad. A table of energy exports drawn from World Trade Organization data covers more than crude and LNG, but gives a sense of scale:


World Fuel Exports, 2024  $3,122 billion
Via Strait of Hormuz     $592 billion
United Arab Emirates      $286 billion
Iraq      $100 billion
Qatar        $78 billion
Kuwait        $69 billion
Iran        $47 billion
Bahrain        $12 billion


  1. Disruption: Persian Gulf energy mainly goes to Asian customers — India, China, Japan, Korea, Taiwan, ASEAN members — with Europe and a smaller buyer, but the market disruption affects the world. As one illuminating data point, insurance for a Strait transit was about 0.2% of the value of a tanker last winter, and is now said to be 4% to 10%. In practical terms, that would mean insurers were charging shipping lines about $200,000 for a transit a month ago, and now $4 million to $10 million.

Since the Trump administration opened its campaign at the end of February, Strait transits have dropped by about 96%, and tanker transits appear to be running at one or two per day. This implies about 280 million “barrels” of oil taken out of the world market, or roughly 20% of the worldwide oil supply. With a sudden contraction in energy supply, and no change in Asia’s need for it, prices have risen fast. Crude oil jumped from $55 per barrel at the end of February to about $100 per barrel by mid-March, and stayed there.

  1. Prices: As crude oil prices rise, refined fuels and petroleum-based manufactured goods — plastics, synthetic fabrics, dyes, and some chemical fertilizers — follow them up. Crude oil costs are half the cost of gasoline, where prices are especially easy to track, and markets respond quickly. According to the American Automobile Association, U.S. gas prices averaged $2.98 per gallon (for “regular” quality gasoline) the week before the war, and topped $4.00 yesterday. Using this morning’s $4.06 average, the near-doubling of crude oil prices has now raised gas prices by more than a third. Diesel prices are up a bit more, by 45%, to a $5.38 average. Sustained for a year, this would cost a middle-income family about $950 (assuming no change in driving habits), a bit more than their spending on “personal care products” like soaps, makeup, and shaving supplies. The common use of petroleum in these things – paraffin wax in lipstick, skin creams, plastic packaging — means their prices will be rising too.

FURTHER READING

PPI’s four principles for response to tariffs and economic isolationism:

  • Defend the Constitution and oppose rule by decree;
  • Connect tariff policy to growth, work, prices and family budgets, and living standards;
  • Stand by America’s neighbors and allies;
  • Offer a positive alternative.

Straits: 

In Nature last November, supply-chain analysts Jasper Verschuur, Johannes Lumma, & Jim Hall review risk premiums at 24 maritime chokepoints, including the Straits of Hormuz, Taiwan, Dover, and Malacca; the Suez and Panama Canals; the Bab al-Mandeb, the Windward Passage, etc. They think Russia, Central Asia, and the Middle East are especially vulnerable to chokepoints, the U.S. and Western Europe are less than most, and China and Japan are in the middle.

Lloyds Intelligence has an eye-catching graph of day-by-day transits since January 1.

And the U.S. Naval Institute looks at ship transits, missile strikes, and risk premiums.

Country perspectives:

Oman’s Foreign Ministry, watching from very close, offers analysis.

Pakistan’s Foreign Ministry is the current intermediary.

And a mid-March 35-country policy statement from the UK, France, Germany, Italy, the Netherlands, Japan, Canada, et al.

Food:

The Strait carries not only energy, but about 30% of world fertilizer trade. Carnegie Endowment scholars Noah Gordon and Lucy Corthell assess the implications of Strait closure for fertilizer and food production.

…while U.S. Farm Bureau officers fear yet another shock to American agriculture.

Energy:

AAA tracks gasoline prices.

The Energy Information Administration (a DOE branch) explains the role of crude prices in consumer gas costs.

And for those wanting details, the Bureau of Labor Statistics’ Consumer Expenditure Survey explains American spending patterns. They say that America’s literal “middle class” — the 27 million households in the third, or middle, of five income quintiles — earned on average $74,474 in 2024. (Most recent year for which data is available.) Gasoline and other vehicle fuels cost them $2,645. If they don’t scale back, driving a 36% price increase sustained for a year would cost them about $950. Here’s where gas fits into the budget:

Income $74,474
Tax payments: ~$4,662
Savings ~$2,912
All spending $66,900
Home/apartment $15,257
Food (not including restaurants):   $5,820
Health expenses   $5,676
All non-food/housing/health spending $40,147
Restaurants (“food away from home”)   $3,277
Entertainment   $2,764
Gasoline/other auto fuel   $2,645
Clothes   $1,642
Personal care products (e.g., soap, makeup)      $892

* Tax payments are estimated based on the results in 2023, as the BLS hasn’t yet published a 2024 figure. The third-quintile family’s 2023 tax payment averaged $4,451, including federal, state, local, and property taxes. This was 6.3% of that year’s $71,507 mean income. The $4,662 above assumes that taxes accounted for the same 6.3% share in 2024.

ABOUT ED

Ed Gresser is Vice President and Director for Trade and Global Markets at PPI.

Ed returns to PPI after working for the think tank from 2001-2011. He most recently served as the Assistant U.S. Trade Representative for Trade Policy and Economics at the Office of the United States Trade Representative (USTR). In this position, he led USTR’s economic research unit from 2015-2021, and chaired the 21-agency Trade Policy Staff Committee.

Ed began his career on Capitol Hill before serving USTR as Policy Advisor to USTR Charlene Barshefsky from 1998 to 2001. He then led PPI’s Trade and Global Markets Project from 2001 to 2011. After PPI, he co-founded and directed the independent think tank ProgressiveEconomy until rejoining USTR in 2015. In 2013, the Washington International Trade Association presented him with its Lighthouse Award, awarded annually to an individual or group for significant contributions to trade policy.

Ed is the author of Freedom from Want: American Liberalism and the Global Economy (2007). He has published in a variety of journals and newspapers, and his research has been cited by leading academics and international organizations including the WTO, World Bank, and International Monetary Fund. He is a graduate of Stanford University and holds a Master’s Degree in International Affairs from Columbia Universities and a certificate from the Averell Harriman Institute for Advanced Study of the Soviet Union.

Read the full email and sign up for the Trade Fact of the Week.

Transparency International: U.S. government perceived as increasingly corrupt

FACT: Transparency International: U.S. government perceived as increasingly corrupt

THE NUMBERS: U.S. worldwide ranking in Transparency International’s annual “Corruption Perceptions Index”* –

2025 29
2015 16
2005 17
1995 15

* The 2025 Index places the U.S 29th among 182 countries and territories. By comparison, the U.S. placed 16th among 180 in the 2015 Index, and 15th among 159 in the 2005 Index. The 1995 edition was the first and had only 41 countries and territories.

WHAT THEY MEAN: 

From the D.C. Circuit Court opinion a week ago Friday, quashing the Trump administration’s attempt to indict Federal Reserve Chairman Jerome Powell:

“The case asks: Did prosecutors issue those subpoenas for a proper purpose? The Court finds that they did not. There is abundant evidence that the subpoenas’ dominant (if not sole) purpose is to harass and pressure Powell either to yield to the President or to resign and make way for a Fed Chair who will. On the other side of the scale, the Government has offered no evidence whatsoever that Powell committed any crime other than displeasing the President. The Court must thus conclude that the asserted justifications for these subpoenas are mere pretexts.”

The subpoenas (ostensibly about renovation costs for the Fed’s D.C. headquarters, but really, the Court concludes, an attempt to coerce the Fed on interest rate policy) are — or “were,” assuming the opinion holds — one in a series of Justice Department attempts to charge prominent administration opponents and critics. Other recent ones include Fed Governor Lisa Cook, six Members of Congress, ex-FBI head James Comey, and the New York Attorney General. So far, all have failed. They’re probably leaving a mark on America’s reputation, though. One way to judge this –

Each spring since 1995, the international corruption-monitoring NGO Transparency International has published a “Corruption Perceptions Index,” which ranks most of the world’s governments for perceived corruption. Their Index uses 13 international surveys done by academics, consultancies, international organizations, and other up-close observers of government, each asking about various forms of corruption: bribery, officials using their jobs for personal gain (including political as well as financial), whistle-blower protection, crony capitalism (“state capture by narrow vested interests”), and so on. The collated survey results produce a country’s “corruption perception score,” ranging from a theoretically most corrupt “zero” score to the cleanest possible governance at 100. The current method, yielding comparable numbers over time, goes back to 2012. Its highest-ever scores were the “91” ratings for Denmark and New Zealand in the mid-2010s, and its lowest was last year’s “8” for South Sudan.

TI’s releases are rarely upbeat. The newest, out last month and covering the year 2025, is especially gloomy:

“The global order is under strain from rivalry among major powers, and dangerous disregard for international norms. Armed conflicts and the climate crisis are having a deadly impact. Societies are also becoming more polarised. To meet these challenges, the world needs principled leaders and strong independent institutions that act with integrity to protect the public interest. Yet too often, we are seeing a failure of good government and accountable leadership. In many places, leaders point to security, economic or geopolitical issues as reasons to centralise power, sideline checks and roll back commitments to internationally agreed standards — including anti-corruption measures. Too often, they treat transparency, independent scrutiny and accountability to the public as optional.”

This Index edition covers 182 governments, and puts Denmark, Finland, and Singapore at the top with respective “scores” of 89, 88, and 84. Venezuela, Somalia, and South Sudan are at the bottom, with 10, 9, and 9; South Africa, Trinidad, and Vietnam define the middle at 41. To select a bright spot, TI credits 11 countries with steady improvement over time: Estonia, Korea, Bhutan, and Seychelles as building from relatively good starting positions, and Albania, Angola, Cote d’Ivoire, Laos, Senegal, Ukraine, and Uzbekistan as rising steadily from lower initial scores. Their view of the U.S., though, is bleak. Not only is the American government’s image eroding, they say, but its recent policy choices are having systemic impacts beyond American borders:

“The United States sustained its slide to its lowest-ever score. While the full impact of 2025 developments are not yet reflected, recent actions, such as targeting independent voices and undermining judicial independence, raise serious concerns. Beyond the CPI findings, the temporary freeze and weakening of enforcement of the Foreign Corrupt Practices Act signal tolerance for corrupt business practices, while cuts to U.S. aid to overseas civil society have weakened global anti-corruption practices.”

Statistically, the U.S. scored 64, and tied with the Bahamas for 29th. For historical context, during the Obama administration from 2012 to 2016, the American score averaged 74 (with a peak of 76 in 2015), and U.S. rankings varied from 19th to 15th. For contemporary comparisons, the 2025 Index puts the U.S. 23rd among the 38 OECD countries, down from 16th in 2015; fourth in the Western Hemisphere, down from second and below Canada, Uruguay, and Barbados; and sixth in the G-7, down from fourth.

The Powell case and its cousins no doubt help to explain this. But to end on a hopeful note, their implications for corruption in American government are complex. The attempt to coerce the Federal Reserve Board through subpoenas is an obvious indicator of deteriorating governance. On the other hand, the Fed’s determination to continue making monetary policy based on careful evaluation of the economic evidence, and the Court’s ruling on the subpoenas, both represent important areas in which personal integrity and the rule of law remain the norm in American public life. They suggest that though TI’s analysts have reason for gloom, this battle isn’t yet lost.

FURTHER READING

PPI’s four principles for response to tariffs and economic isolationism:

  • Defend the Constitution and oppose rule by decree;
  • Connect tariff policy to growth, work, prices and family budgets, and living standards;
  • Stand by America’s neighbors and allies;
  • Offer a positive alternative.

Fed Chair Powell’s video comment on the Trump admin.’s subpoenas.

And the D.C. Circuit Court’s ruling.

Big picture:

Transparency International’s 2025 Corruption Perception Index, with links to the archived Indexes from 1995 through 2024.

… The methodology and indicators.

… The sources.

… And the Index’s very pessimistic look at the western hemisphere — “the Americas show no progress in the fight against corruption” — with especially strong words for the United States, and notes on deteriorating environments in El Salvador and Ecuador. TI does, though, commend the Dominican Republic and Guyana for an improving landscape.

ABOUT ED

Ed Gresser is Vice President and Director for Trade and Global Markets at PPI.

Ed returns to PPI after working for the think tank from 2001-2011. He most recently served as the Assistant U.S. Trade Representative for Trade Policy and Economics at the Office of the United States Trade Representative (USTR). In this position, he led USTR’s economic research unit from 2015-2021, and chaired the 21-agency Trade Policy Staff Committee.

Ed began his career on Capitol Hill before serving USTR as Policy Advisor to USTR Charlene Barshefsky from 1998 to 2001. He then led PPI’s Trade and Global Markets Project from 2001 to 2011. After PPI, he co-founded and directed the independent think tank ProgressiveEconomy until rejoining USTR in 2015. In 2013, the Washington International Trade Association presented him with its Lighthouse Award, awarded annually to an individual or group for significant contributions to trade policy.

Ed is the author of Freedom from Want: American Liberalism and the Global Economy (2007). He has published in a variety of journals and newspapers, and his research has been cited by leading academics and international organizations including the WTO, World Bank, and International Monetary Fund. He is a graduate of Stanford University and holds a Master’s Degree in International Affairs from Columbia Universities and a certificate from the Averell Harriman Institute for Advanced Study of the Soviet Union.

Read the full email and sign up for the Trade Fact of the Week.

Trump admin accuses foreigners of excessive SExCiness, threatens them with tariffs

FACT: Trump admin accuses foreigners of excessive SExCiness, threatens them with tariffs.

THE NUMBERS: Per the U.S. Trade Representative Office, trading partners flagged for “Structural Excess Capacity”–

Bangladesh, Cambodia, China, the European Union, India, Indonesia, Japan, Korea, Malaysia, Mexico, Norway, Singapore, Switzerland, Thailand, Taiwan, Vietnam.

WHAT THEY MEAN: 

In the Reagan-era Washingtoon comic, Rep. Bob Forehead’s political consultants grow disenchanted with bland “buzzwords” such as “jobs” and “big spenders.” (Short and easy to grasp, yes, but voters sense a lack of intellectual weight.) Anticipating a presidential campaign launch and worried about “an emerging perception of Bob as being purely image and lacking in substance”, they supplement his buzzwords with “fuzzwords”. These are long polysyllables — e.g., “the Federal Reserve should abandon its targets of aggregates” — which also lack intellectual weight, but sound complicated and thus have a desirably confusing and numbing effect on the public.

Life imitates art: Four decades later, aware that short 2025 tariff slogans like “new golden age” and “reindustrialization” aren’t landing, the Trump administration is trying the same thing. Last week the U.S. Trade Representative Office published a Federal Register Notice introducing a nine-syllable neologism — “structural excess capacity” — as a new intellectual foundation for tariff increases:

“The Trump Administration’s reindustrialization efforts continue to face significant challenges due to foreign economies’ structural excess capacity and production in manufacturing sectors.  Across numerous sectors, many U.S. trading partners are producing more goods than they can consume domestically. This overproduction displaces existing U.S. domestic production or prevents investment and expansion in U.S. manufacturing production that otherwise would have been brought online.”

As policy, the Notice announces a “Section 301” investigation of 16 economies — Bangladesh, Cambodia, China, the European Union, India, Indonesia, Japan, Korea, Malaysia, Mexico, Norway, Singapore, Switzerland, Thailand, Taiwan, and Vietnam — for “structural excess capacity”. For readers new to trade-bar jargon, Section 301 is a 1974 statute giving administrations some ability to threaten tariffs on goods from particular countries, in hopes of getting them to remove objectionable policies. Typical uses, mostly in the 1980s and 1990s but more recently vis-à-vis China, were on specific things: limits on U.S. exports, intellectual property appropriation, etc.  Using this law for “structural excess capacity” — it seems essentially to mean a country’s overall industrial output; see below — is novel.

Obvious first question: Who is writing these Notices, anyway? As a fuzzword, “structural excess capacity” has the right murky tone, but astute readers quickly catch its natural acronym: “SExC.” So the administration is accusing the Euros, as well as the Japanese, Thais, Mexicans, Bangladeshis, etc., of excessive SExCiness and threatening them with tariffs for it. Too hot to fly! Americans above the age of twelve have learned over the last year that tariffs are taxes paid by buyers, so this isn’t technically a fine on foreigners for unreasonable hotness – they might pay willingly — but a demoralizing tax, probably in the tens of billions of dollars, on Americans for lacking it.

More analytically, the “structural excess capacity” concept rests on the premise that a country which makes more of something than it needs at home is doing something wrong. If it simply limited production to local needs, Americans would buy less from them and make the stuff ourselves instead.  The Notice uses two data points as evidence of SExCiness: (a) selling more goods abroad (in general, or to Americans specifically) than one buys, and (b) factories running at “capacity utilization” rates below 80%, a level its drafters claim indicates more supply of manufactured goods on the market than the world wants or needs. Samples:

Norway“Evidence of structural excess capacity and production exists for Norway. Norway maintains a global goods trade surplus, led by exports in sectors such as mineral fuels and oils, certain electronic equipment, and machinery. … At 77.7 percent in Q4 2025, Norway’s rate of capacity utilization was more than a full percentage point below what it was a year ago, and over two percentage points less than it was three years ago. In addition, Norway engages in policies and practices that have the effect of undervaluing its domestic currency, including the use of state-owned or -controlled enterprises to recycle oil revenues into non-domestic currencies, like the U.S. dollar, rather than its domestic currency.”

Cambodia“Evidence of structural excess capacity and production exists for Cambodia. Cambodia maintains a bilateral trade surplus with the United States, which in 2024 was approximately $1 billion. Evidence indicates its garment, footwear, and travel goods (GFT) sector exported $11.8 billion in the first nine months of 2025, a 16 percent increase from the same period in 2024. When Cambodia’s GFT industry was facing uncertainty with U.S. tariffs, Cambodia’s Deputy Secretary-General stated that enhancing capacity along the product chains was an option to further boost the manufacturing sector and create lucrative opportunities.”

So Norwegians produce more energy than they use at home, maliciously sell the extra Brent crude to refiners in other countries, and on top of that, use dollars (as energy traders everywhere typically do) rather than krone. Cambodians likewise stitch more clothes and rivet together more suitcases than Phnom Penh’s schoolchildren and business travelers need. The resulting sectoral trade surpluses not only demonstrate the two countries’ SExCiness but help frustrate Trump-team hopes of “reindustrialization” and “a new golden age.”

The ostensible goal of the “301” investigation, therefore, is that threats of tariffs will persuade the Norwegians and Cambodians to drill less oil and sew fewer duffel bags, and then someone will be better off.  Three observations:

1. “Structural excess capacity” is not a meaningful concept: The Notice’s premise is wrong, as American experience quickly shows.  U.S. factories produce more airplanes and artificial body parts than American air carriers and hospitals require. They sell the extras to customers abroad — three in every four U.S.-made airplanes, for example — which is good for foreign travelers and patients, and also brings in money to hire more workers and fund next-gen research.  American farmers grow almonds and wheat than American kitchens and restaurants need, and send respectively 75% and 45% overseas, mostly to Asia. Same with software, natural gas, music, and film. That’s how American aerospace, medical technologies, and agriculture, as well as tech, energy, and entertainment, succeed and grow. The same thing happens in other countries.

2. “Structural excess capacity” reduction is an implausible use of Section 301. The administration’s hope for less world SExCiness must mean either “increasing world demand for goods,” or “reducing output of goods.” The Notice makes pretty clear it’s the latter.  Its 16 economies account for about $10.7 trillion in manufacturing output, two-thirds of the world’s total. At a capacity utilization of 75%, that suggests a potential output of about $14.3 trillion. Raising utilization to 80% — again, the level the Notice claims would put supply in line with demand — by reducing production entails persuading foreign governments to take around $1 trillion worth of annual clothes, cars, toys, soap, helicopters, medicines, and other goods offline. Not likely.

3. And probably not the real goal anyway. Back in 1974, the authors of “Section 301” hoped to find ways to remove or mitigate policies they didn’t like. In 2026, the Treasury Secretary, Mr. Bessent, says the Trump administration just wants “alternative legal authorities” to replace the “international emergency” tariffs the Supreme Court axed in February. By that measure, the 301 investigation is simply another attempt to take Congress’ Constitutional authority over “Taxes, Duties, Imposts, and Excises,” impose tariffs by decree, and hope courts don’t stop it.

Coda: Rep. Forehead’s problem in Washingtoon wasn’t vocabulary choice. Rather, the public’s emerging perception of him as all-image and low-substance was correct. Likewise, in 2026, the administration’s problem isn’t one of “messaging”. It’s the conclusions Americans have drawn, after a year of rising costs, slowing growth, and falling hires, about the real-world impact of tariff increases. Replacing faded 2025 slogans with long new words — even with more dignified acronyms — won’t solve it.

FURTHER READING

PPI’s four principles for response to tariffs and economic isolationism:

  • Defend the Constitution and oppose rule by decree;
  • Connect tariff policy to growth, work, prices and family budgets, and living standards;
  • Stand by America’s neighbors and allies;
  • Offer a positive alternative.

Washingtoon (1983) explains the balance of buzzwords and fuzzwords.

U.S. Trade Representative Office test-markets “structural excess capacity,” launches “Section 301” investigation.

… while Sec. Bessent says the investigation’s real point is quite different.

From Congress, Sen. Ron Wyden and Rep. Richard Neal concisely pan the “investigation.”

Law:

Section 301 text. Note that it directs administrations to identify specific “acts, practices, or policies” that in some way unfairly burden American trade, and doesn’t mention “producing more [oil, clothes, etc.] than one can use at home”.

ABOUT ED

Ed Gresser is Vice President and Director for Trade and Global Markets at PPI.

Ed returns to PPI after working for the think tank from 2001-2011. He most recently served as the Assistant U.S. Trade Representative for Trade Policy and Economics at the Office of the United States Trade Representative (USTR). In this position, he led USTR’s economic research unit from 2015-2021, and chaired the 21-agency Trade Policy Staff Committee.

Ed began his career on Capitol Hill before serving USTR as Policy Advisor to USTR Charlene Barshefsky from 1998 to 2001. He then led PPI’s Trade and Global Markets Project from 2001 to 2011. After PPI, he co-founded and directed the independent think tank ProgressiveEconomy until rejoining USTR in 2015. In 2013, the Washington International Trade Association presented him with its Lighthouse Award, awarded annually to an individual or group for significant contributions to trade policy.

Ed is the author of Freedom from Want: American Liberalism and the Global Economy (2007). He has published in a variety of journals and newspapers, and his research has been cited by leading academics and international organizations including the WTO, World Bank, and International Monetary Fund. He is a graduate of Stanford University and holds a Master’s Degree in International Affairs from Columbia Universities and a certificate from the Averell Harriman Institute for Advanced Study of the Soviet Union.

Read the full email and sign up for the Trade Fact of the Week.

2025 trade growth was the fastest since 2021

FACT: 2025 trade growth was the fastest since 2021.


THE NUMBERS:

2024 2026
Working satellites ~11,500 ~18,000
Fiber-optic cables 561 cables ~637 cables
Container ships 30.4 million TEU 33.9 million TEU
Freighter planes 2,375 ~2,675

WHAT THEY MEAN: 

Two of the three big drivers of “economic integration” have faded or gone dark. The Trump administration’s tariff binge, even after the Supreme Court scrapped its “international emergency” decrees, leaves the world economy more “closed” than it was a year ago. Peace among big powers is growing steadily shakier. This ought to chill commerce — that was the path of the 1930s — but so far it hasn’t. In fact, the WTO’s calculations of “trade growth by volume” (essentially, though not exactly, an inflation-adjusted real-dollar count of export growth) put trade growth in 2025 faster than any year since the anomalous pandemic-recovery year 2021, and well above the last decade’s 3.0% average.

2025 3.60%
2024 2.90%
2023 -1.20%
2022 2.70%
2021 9.70%
2020 -5.30%
2019 0.10%
2018 3.00%
2017 4.70%
2016 1.70%

Why? In contrast to the 1930s, rising trade barriers aren’t a worldwide policy. Back then, lots of big economies followed the Hoover administration into high-tariff isolationism. In the 2020s, by contrast, most have kept policy stable, and many are continuing to integrate and ‘liberalize’. The European Union and South America’s “Mercosur” group (Argentina, Brazil, Paraguay, Uruguay) signed a Free Trade Agreement in January; the U.K. has joined the Comprehensive and Progressive Trans-Pacific Partnership; the African Continental Free Trade Area just got its 49th ratification, etc.

The U.S.’s large share of trade — 12.8% of goods & services imports, 9.8% of exports as of 2024 — means American policy choices should nonetheless affect total trade flows at least a bit. But that impact may be cushioned or entirely offset, though, by the strength of the third driver: the steady decline in communication and logistics costs as physical infrastructure improves.

Even over the last two years, it’s become noticeably cheaper and easier to move information and goods around the world. Some indicators:

Information carriers: Much of the world’s $8 trillion in services trade (setting aside personal travel and transport) moves in digital form, converted to information and then sent under the sea along a glass wire or through the sky via satellite beam.

Cables: Fiber-optic cables carry most information traffic, and therefore most services trade. Cable-tracker TeleGeography’s count of active cables has risen from 561 to a projected 637 this year, and newer cables are not only numerous but more powerful than their older siblings. As an example, last year’s “Bifrost” (oddly named for the “rainbow bridge” to heaven in Norse myth) is a 16,500-kilometer wire connecting Singapore to California, with branches in Oregon, Indonesia, and the Philippines. Bifrost can carry 32.5 terabits of data per second. By comparison, all of the 111 world cables in 2010 put together could carry about 239.5 terabits per second. A decade earlier, as fiber-optics replaced the older copper wires, the total world capacity was below 2 terabits per second.

Satellites: Satellites carry less information than cables but offer more options with fewer geographic dead spots, and are multiplying even faster than cables: Jonathan’s endearingly “2005 blogger-style web page” count of operating satellites, having risen from about 5,000 operating satellites in 2020 to 9,100 in early 2024, likely passed 15,000 this month. Liftoff schedules suggest the total may be near 20,000 when the next Congress takes office in January 2027.

Goods carriers: Luxuries and perishables, manufacturing inputs, metals, ores and energy, appliances and clothes, all move in ships, trucks, pipelines, and planes. About 45% of the $24 trillion in annual merchandise trade — measured by value rather than weight — travels by container ship, and 35% by plane.

Container ships: As of early 2026, container trackers at Alphaliner report 7,520 container ships steaming around the world’s oceans. Taken together, they can carry 33.9 million TEU worth of containers. (TEU: “twenty-foot equivalent units,” a standard measurement standing for a container 20 feet long, 8 feet high, and 8.5 feet wide.) The container fleet of 2024 had 6,464 ships with a capacity of 31.4 million TEU. For a more dramatic counterpoint, the entire worldwide container ship count in the year 2000 was 2,595 ships with 4.3 million TEU. So the last two years of yardwork have added nearly the equivalent of the whole millennial fleet. The Bipartisan Infrastructure Act of the Biden era, meanwhile, put $17 billion into U.S. seaports — more efficient terminals, better links to roads and railways, etc. — meaning that even in the U.S., cargo arrivals are incrementally getting faster and cheaper, offsetting some tariff increases.

Air freighters: The count of active large civil aircraft, meanwhile, has jumped from 28,400 to over 35,500, or by about a fifth. This isn’t simple to relate directly to air cargo flows, as some planes move only people, some just cargo, and many do both. But the count of planes strictly meant for cargo gives at least a sense of direction. Boeing’s 2020 Commercial Outlook estimated that by 2039, the world’s delivery services would be using 2,439 freighter planes.  Their most recent edition says we’ve already arrived: by 2024, the cargo fleet employed 2,375 freighters — 920 at standard size, 800 medium widebodies, 655 large widebodies — and about 300 more took off in 2025 and 2026. Their new long-term projection is that the cargo fleet will reach 3,975 planes by 2044, up 70%, with the fastest growth in the largest planes.

In sum: So far, the world of the 2020s isn’t following the example set in the early 1930s. As the Trump administration is trying to make trade more expensive and difficult for Americans, other forces are trying to make it cheaper and easier. As to which will win out, from the U.S. angle, it seems to be a draw so far. From the world perspective (should the Trump program remain in place for a while), the apparent trend is for the administration to diminish parts of the American role in the global economy, rather than shrink the global economy itself.

FURTHER READING

PPI’s four principles for response to tariffs and economic isolationism:

  • Defend the Constitution and oppose rule by decree;
  • Connect tariff policy to growth, work, prices and family budgets, and living standards;
  • Stand by America’s neighbors and allies;
  • Offer a positive alternative.

Trade flows:

The WTO’s stat dashboard (through 2024).

… Census’ U.S. trade data for 2025.

… and the Port of Los Angeles tracks container arrivals.

Cables and satellites:

TeleGeography’s interactive Submarine Cable Map shows all 637 active fiber-optic cables, with years of deployment, capacity, and more.

Jonathan’s Space Pages count satellites.

… and PPI’s Mary Guenther has recommendations for next-generation space policy.

Ships and planes:

UNCTAD’s Review of Maritime Transport series counts ships, evaluates port efficiency, etc, through 2025.

Alphaliner’s up-to-date running count of container ships and capacity.

Boeing’s most recent Commercial Outlook reviews the 43,600-plane worldwide commercial air fleet of 2024, and looks ahead to the 2040s.

And the Maritime Administration’s summary of the Bipartisan Infrastructure Law’s seaport program.

Policy:

The U.K. explains CPTPP benefits.

The European Commission on its FTA with Mercosur.

… and the view from Brasilia.

And the African Union’s AfCFTA page.

ABOUT ED

Ed Gresser is Vice President and Director for Trade and Global Markets at PPI.

Ed returns to PPI after working for the think tank from 2001-2011. He most recently served as the Assistant U.S. Trade Representative for Trade Policy and Economics at the Office of the United States Trade Representative (USTR). In this position, he led USTR’s economic research unit from 2015-2021, and chaired the 21-agency Trade Policy Staff Committee.

Ed began his career on Capitol Hill before serving USTR as Policy Advisor to USTR Charlene Barshefsky from 1998 to 2001. He then led PPI’s Trade and Global Markets Project from 2001 to 2011. After PPI, he co-founded and directed the independent think tank ProgressiveEconomy until rejoining USTR in 2015. In 2013, the Washington International Trade Association presented him with its Lighthouse Award, awarded annually to an individual or group for significant contributions to trade policy.

Ed is the author of Freedom from Want: American Liberalism and the Global Economy (2007). He has published in a variety of journals and newspapers, and his research has been cited by leading academics and international organizations including the WTO, World Bank, and International Monetary Fund. He is a graduate of Stanford University and holds a Master’s Degree in International Affairs from Columbia Universities and a certificate from the Averell Harriman Institute for Advanced Study of the Soviet Union.

Read the full email and sign up for the Trade Fact of the Week.

Refunding illegally collected tariff money is not difficult

FACT: Refunding illegally collected tariff money is not difficult.

THE NUMBERS:

Illegally collected “IEEPA”* tariffs: ~$175 billion
Annual IRS income tax withholding refunds: ~$330 billion

* “IEEPA” is an acronym for “International Emergency Economic Powers Act,” the 1977 law the administration used as the basis for eight tariff decrees in 2025. The other tariff decrees, “national security” claims under “Section 232” of U.S. trade law, haven’t been challenged so far and remain in force. The $175 billion is the estimated actual tariff collection under the IEEPA decrees, and does not include required interest payments.

WHAT THEY MEAN: 

Brett Kavanaugh, one of three Supreme Court Justices to side with the Trump administration on “international emergency” tariffs two weeks ago, explains his view at least in part by saying he thinks repaying tariffs will be difficult:

“The United States may be required to refund billions of dollars to importers who paid the IEEPA* tariffs, even though some importers may have already passed on costs to consumers or others. As was acknowledged at oral argument, the refund process is likely to be a ‘mess.’ In addition, according to the Government, the IEEPA tariffs have helped facilitate trade deals worth trillions of dollars — including with foreign nations from China to the United Kingdom to Japan, and more. The Court’s decision could generate uncertainty regarding those trade arrangements.”

A general legal point on this, then a couple of comments on the practical issues:

Legal: If an administration puts an illegal policy in motion, and courts later find it illegal, unwinding it can be messy. That’s the nature of Justice Marshall’s “judicial review” concept. Any “mess” is the administration’s responsibility and its problem to fix, not the courts’.

Practical: Neither of Kavanaugh’s complaints is very daunting. The “deals” have basic problems — all of them raise costs for Americans — and don’t seem built to last anyway. And refunding the “IEEPA” tariffs needn’t be messy at all.

With respect to “deals” and “trade arrangements”, they aren’t worth “trillions” of dollars and don’t look like they’re meant to last long. As recently as January, for example, the administration itself was perfectly willing to abandon its “deals” with the European Union and the U.K. by threatening new tariffs over control of Greenland. And if it now places high value on them, it can eliminate any risk by asking Congress to pass implementing laws that bring them to life. Earlier administrations did this 18 times between 1974 and 2020 for GATT, WTO, and FTA agreements. If Congressional support is there, the deals will be fine. If not, maybe they aren’t very meaningful.

And with respect to refunding illegally collected tariff money, no “mess” unless the administration wants one.

There’s no blurriness about who is owed the money. In customs and tariff jargon, the people who write tariff checks to the Customs and Border Patrol are the ‘importers of record’, meaning about 242,000 importing companies in the U.S., 11,000 customs brokers handling trade paperwork for small businesses, and individuals now paying tariffs on arriving packages. CBP’s “ACE” (Automated Commercial Environment) system lets the firms and customs brokers enter their payments in digital form with an 8-digit tariff code identifying the product they’re buying, the date it arrived, its value, the applicable tariff laws and rates, and the amount of money they paid. Each of the administration’s eight “IEEPA” decrees created special tariff lines beginning with the HTS code 9903 to apply the new tariffs to incoming goods. As an example, the April 2 “global” decree created 52 new tariff lines, starting at “9903.01.25” and going up to “9903.01.76.” So CBP knows very well who has paid IEEPA tariffs on Ghanaian shea butter, Vietnamese-assembled TV sets, Valentine roses from Ecuador and Colombia, etc., and the payers likewise know how much of their tariff payments originated in an illegal IEEPA decree.

Nor should the government have any problem writing the checks. Tariff-payers can probably arrange most of the refunds themselves, using the ACE system to revise tariff filings dating back to April of 2025. (Tariff payments typically wait around at CBP for 315 days, then “liquidate” as CBP sends them to the Treasury’s General Fund.)  For the earlier ones, a bit more complicated but the U.S. government regularly does much larger and more complicated refunds. To put some numbers on this:

  • CBP’s “Trade Statistics” snapshot says that in Fiscal Year 2025, CBP line officers handled 50.08 million separate import “entries” – container unloadings, truck crossings, air cargo deliveries, pipeline shipments, etc. — with tariff collection totaling $195 billion. IEEPA tariffs totaled about $93 billion in 2025, and were running at $16 billion per month in the first quarter of FY2026. Assuming that remained pretty stable in early 2026, the IEEPA revenue total is likely about $175 billion. With interest, the government owes $200 billion or so in refunds.
  • By comparison, the Internal Revenue Service got 163.4 million individual income tax filings last year, and sent out 104.9 million tax withholding refunds, valued at $329.1 billion. So, twice as many individual payments, and 50% more refund money than the tariff repayment will require. Six weeks from now, in mid-April, they will do this all over again without any particular trouble.

In sum: CBP will have to sort through a lot of forms. The Treasury Department will need to send out more checks than usual this year. But it won’t be a mess unless the administration decides to create one. And either way, that’s not the Court’s problem.

FURTHER READING

PPI’s four principles for response to tariffs and economic isolationism:

  • Defend the Constitution and oppose rule by decree;
  • Connect tariff policy to growth, work, prices and family budgets, and living standards;
  • Stand by America’s neighbors and allies;
  • Offer a positive alternative.

Law:

The Supreme Court’s Learning Resources, Inc. v. Trump opinion. The ruling against the IEEPA tariffs is pp. 7-26, and Kavanaugh’s dissent starts on page 170.

… and Marshall’s Marbury v. Madison opinion (1803), introducing the “judicial review” concept.

The numbers:

CBP’s “Trade statistics” snapshot. See “entries” in the top box for the count of import arrivals, and scroll down for tariff collection under IEEPA, “232” national security claims, and “301” unfair trade practices.

CBP’s introduction to the Automated Commercial Environment system, which importers use to file documents and pay tariffs electronically, and facilitates refunds of wrongly collected tariff money.

And for comparison, the IRS’s summary of individual tax filings and refunds.

And another thing:

The administration spent a lot of time last year claiming that tariffs were a way to offload taxes onto foreigners, including foreign governments. Mr. Trump made the same assertion — “tariffs, paid for by foreign countries” — personally in the “State of the Union” address a week ago Tuesday. As the refund checks go out, Congress and reporters might usefully ask how many are going to foreign capitals and how many to American addresses.

ABOUT ED

Ed Gresser is Vice President and Director for Trade and Global Markets at PPI.

Ed returns to PPI after working for the think tank from 2001-2011. He most recently served as the Assistant U.S. Trade Representative for Trade Policy and Economics at the Office of the United States Trade Representative (USTR). In this position, he led USTR’s economic research unit from 2015-2021, and chaired the 21-agency Trade Policy Staff Committee.

Ed began his career on Capitol Hill before serving USTR as Policy Advisor to USTR Charlene Barshefsky from 1998 to 2001. He then led PPI’s Trade and Global Markets Project from 2001 to 2011. After PPI, he co-founded and directed the independent think tank ProgressiveEconomy until rejoining USTR in 2015. In 2013, the Washington International Trade Association presented him with its Lighthouse Award, awarded annually to an individual or group for significant contributions to trade policy.

Ed is the author of Freedom from Want: American Liberalism and the Global Economy (2007). He has published in a variety of journals and newspapers, and his research has been cited by leading academics and international organizations including the WTO, World Bank, and International Monetary Fund. He is a graduate of Stanford University and holds a Master’s Degree in International Affairs from Columbia Universities and a certificate from the Averell Harriman Institute for Advanced Study of the Soviet Union.

Read the full email and sign up for the Trade Fact of the Week.

Gresser in Politico Pro Morning Trade: USTR outlines goals for critical mineral pact

[…]

The two conflicting visions don’t add up, said Ed Gresser, a former USTR economist now at the Progressive Policy Institute, a Democratic think tank.

“I don’t think you can say in the State of the Union address that the economy is in really, really great shape and then also say we’re about to have a collapse in the dollar, mass unemployment, inability to service foreign debt, those sorts of things,” Gresser said.

[…]

Read more in Politico Morning Trade. 

Supreme Court: Presidents cannot use ‘international emergencies’ as pretexts to create their own tariff systems

FACT: Supreme Court: Presidents cannot use “international emergencies” as pretexts to create their own tariff systems.

THE NUMBERS: U.S. GDP growth, last five years–

2025    2.2%
2024    2.8%
2023    2.9%
2022    2.5%
2021    6.2%

WHAT THEY MEAN: 

Having ordered his skeptical platoon to ford a flooding Louisiana river by moonlight, the obstinate, ill-fated captain in folksinger Pete Seeger’s Big Muddy insists that everything will be fine:

    “It’ll be a little soggy, but just keep slogging. We’ll soon be on dry ground …”

It doesn’t work out quite that way.

The Supreme Court’s Learning Resources, Inc. v. Trump opinion, released Friday morning, offered the administration an easy way out. By striking down all of last year’s “International Emergency Economic Powers Act” (“IEEPA”) decrees, the Court gave the administration a chance either to (a) quietly liquidate an unpopular experiment, or (b) return to the Constitutionally appropriate approach of asking Congress to pass a tariff bill, as the like-minded Harding and Hoover administrations did in the 1920s. Within a few hours, it made a different choice: emotional denunciations of the court, a legal gamble on an antiquated law meant for a different purpose, and new tariff decrees oscillating up and down between 10% and 15%. As this thrashing around proceeds, a look at how the past year’s tariff binge played out, with Seeger’s piece as a wry optional soundtrack:

GDP growth slows: To start at the top, the administration’s central tariff decree — the now-defunct April 2 “Executive Order 14257” — predicted that tariffs would open a “new golden age.” In practice, the U.S. economy grew by 2.2% last year. This isn’t terrible for a “developed” economy, but is noticeably slower growth than in any of the four Biden years: 6.2% in 2021 during the pandemic rebound, then 2.5% in 2022, 2.9% in 2023, and 2.8% in 2024.

… and rural America crashes: Growth, of course, isn’t a single uniform figure across all regions and economic “sectors,” but the average of many different experiences. Rural America, the most export-reliant part of the U.S. — sales to foreign customers typically provide a fifth of farm income — has had a particularly bad time. Retaliations and consumer boycotts damaged farm export earnings last year — soybean sales to China down from $12.6 billion in 2024 to $3.1 billion, wine exports to Canada from $460 million to $103 million, etc. — while higher tariffs on fertilizer, agricultural machinery, fencing, tools, and other needs raised farm operating costs. With income down and expenses up, farm country is in bad enough shape for commodity-group and ag policy veterans to warn this month of a possible “widespread collapse of American agriculture and our rural communities.”

Trade balance unchanged: The administration justified its April 2 decree to the courts by declaring a “national emergency posed by a large and persistent trade deficit” (in goods specifically, excluding services trade), and claiming a big tariff increase would “address” it. It hasn’t. Last Thursday, a day before the Supreme Court’s verdict, Census Bureau statisticians published the U.S. trade data for 2025, which showed a somewhat higher goods-trade deficit in 2025 than in 2024:

2024   2025
Imports of goods $3.30 trillion   $3.44 trillion
Exports of goods $2.08 trillion   $2.20 trillion
Goods trade balance -$1.22 trillion   -$1.24 trillion

Manufacturing slowdown: The administration’s pitch to the public was more practical: higher tariffs would cause “some pain,” but would compensate by launching a manufacturing boom.  That didn’t happen either. Employment growth slowed in general, and especially so in manufacturing: Bureau of Labor Statistics reports show manufacturing employment falling by 108,000 in 2025, mainly because manufacturers hired about 330,000 fewer new workers. Meanwhile, the Commerce Department’s Bureau of Economic Analysis calculates that the manufacturing share of U.S. GDP (based on the nine months of data available so far) contracted from 9.8% in 2024 to 9.4%.

Costs up: If tariffs haven’t produced growth, trade balance, or a manufacturing job surge, they have succeeded in raising costs. CBP appears to have collected a bit more than $260 billion in tariff money last year, more than triple the $76 billion of 2024. The biggest cost appears to have fallen on the automotive industry — over $40 billion on cars and parts, mostly under “national security” (technically, “Section 232”) tariffs that so far haven’t faced court challenge and thus remain in place. But the general tariff increase is seeping into daily life in unexpected and sometimes very personal ways. Some samples of where CBP got this money:

2024   2025
Primary health products
OTC medicines     $0 million     $316 million
Band-Aids and other bandages     $0 million     $206 million
Condoms     $0 million         $7 million
Tampons   $23 million     $143 million
Crutches, splints, other fracture devices   $0 million     $197 million


Personal care & beauty 2024   2025
Soap   $31 million     $172 million
Makeup $158 million     $724 million
Perfume   $11 million     $391 million
Hair care   $28 million     $140 million
Deodorant     $6 million       $17 million
Shaving cream, razors, & aftershave   $12 million       $63 million
Dental floss, toothbrushes, & toothpaste   $20 million     $100 million


Groceries                  2024   2025
Fresh fruit and vegetables                  $196 million    $1,175 million
Flowers                      $8 million       $145 million
Coffee & tea                      $6 million       $935 million
Honey                      $4 million         $64 million
Pepper, cinnamon, ginger                    $16 million       $128 million

Across the whole economy, the Harvard Business School’s tracking project estimates that tariffs raised the price of tariffed goods by 6.6% above trend, the price of similar locally produced goods by 3.8%, and overall prices by about 1%.

Federal debt up: As to federal finances, the Court’s ruling doesn’t mean the administration has to pay the whole $261 billion back, just most of it. The Congressionally authorized “MFN” tariff system is still active, though buried under much larger tariff decrees, and legally raises about $40 billion a year. The administration’s Section 232 “national security” decrees are often laughable — one defines condensed milk and balance beams as “steel or aluminum derivative products,” another says lumber tariffs will make sure we have the wood needed to build “ballistic missile defense systems” and “thermal protection systems for nuclear re-entry vehicles” — but so far haven’t faced legal challenge. But the “IEEPA” tariffs struck down on Friday account for about two-thirds of tariff revenue, roughly $175 billion, and the administration will have to pay it back with interest. That means the 2025 tariff experiment will likely end up a net loss to the Treasury.

In sum: slower growth, rural crisis, fewer manufacturing jobs, higher costs for families, and more debt for the government. The unfortunate captain in Seeger’s song tells his worried platoon to keep slogging as the water rises. But dry ground is nowhere in sight.

FURTHER READING

PPI’s four principles for response to tariffs and economic isolationism:

  • Defend the Constitution and oppose rule by decree;
  • Connect tariff policy to growth, work, prices and family budgets, and living standards;
  • Stand by America’s neighbors and allies;
  • Offer a positive alternative.

Main documents:

Supreme Court Learning Resources, Inc., v. Trump opinion.

… PPI’s comment on the ruling.

… the now-defunct April 2 decree, “Regulating Imports with a Reciprocal Tariff to Rectify Trade Practices that Contribute to Large and Persistent Annual United States Goods Trade Deficits.”

… and its replacement (for now, pending court challenges), a February 20 decree claiming a “balance of payments emergency” to invoke “Section 122” for a 15% worldwide tariff.

Soundtrack:

Seeger’s “Big Muddy.”

Data:

Census Bureau reports imports, exports, and trade balances for 2025.

BEA’s GDP series, with a link to “GDP by Industry.”

The Agriculture Department’s Economic Research Service reports on farm income.

The Bureau of Labor Statistics database. Use “Employment, Hours, and Earnings” for employment growth by industry, and “Job Openings and Labor Turnover” for total job openings, hiring, layoffs, and quits.

The U.S. International Trade Commission’s Dataweb lets you see exports, imports, and tariff collection by country and product.

ABOUT ED

Ed Gresser is Vice President and Director for Trade and Global Markets at PPI.

Ed returns to PPI after working for the think tank from 2001-2011. He most recently served as the Assistant U.S. Trade Representative for Trade Policy and Economics at the Office of the United States Trade Representative (USTR). In this position, he led USTR’s economic research unit from 2015-2021, and chaired the 21-agency Trade Policy Staff Committee.

Ed began his career on Capitol Hill before serving USTR as Policy Advisor to USTR Charlene Barshefsky from 1998 to 2001. He then led PPI’s Trade and Global Markets Project from 2001 to 2011. After PPI, he co-founded and directed the independent think tank ProgressiveEconomy until rejoining USTR in 2015. In 2013, the Washington International Trade Association presented him with its Lighthouse Award, awarded annually to an individual or group for significant contributions to trade policy.

Ed is the author of Freedom from Want: American Liberalism and the Global Economy (2007). He has published in a variety of journals and newspapers, and his research has been cited by leading academics and international organizations including the WTO, World Bank, and International Monetary Fund. He is a graduate of Stanford University and holds a Master’s Degree in International Affairs from Columbia Universities and a certificate from the Averell Harriman Institute for Advanced Study of the Soviet Union.

Read the full email and sign up for the Trade Fact of the Week.

PPI Applauds Supreme Court Decision to Strike Down Trump ‘Emergency’ Tariffs

WASHINGTON — Today, Ed Gresser, Vice President and Director for Trade and Global Markets at the Progressive Policy Institute (PPI), issued the following statement on the Supreme Court’s decision deeming President Trump’s IEEPA tariffs unconstitutional:

“A very conservative Supreme Court has done Mr. Trump a favor today, by giving him a chance to quietly liquidate about half of his tariff program. But it has only done part of the job, and Congress now needs to finish it.

“The public’s experience with Mr. Trump’s tariffs hasn’t been a happy one. In January, the administration promised lower prices and industrial growth. Since then, it has used tariffs to deliver higher costs of living to families, factory job loss and lost farm income to industry, and harm to America’s national security and international reputation. It is not a surprise to find such a program deeply unpopular, and the Trump administration should be grateful to the Court for partially scrapping it.

“Today’s decision, though, applies only to tariffs imposed through decrees using the International Emergency Economic Powers Act. The case did not cover the equally bad-faith ‘national security’ Executive Orders and Proclamations imposing tariffs of 10%, 25%, and 50% on furniture, whipped cream, lumber, gym equipment, metals, and thousands of other products through ‘Section 232’ of U.S. trade law. Barring a future legal challenge, these will remain in place, and so will a problem larger than price increases.

“Like the IEEPA tariffs, the ‘Section 232’ tariffs have no Congressional authorization. So beyond their real-world harm to families and businesses, they usurp Congress’s clear Constitutional authority over the rates of ‘taxes, duties, imposts, and excises,’ and substitute rule by personal decree for rule of law. As such, they represent the same breach of the separation of powers, and the same threat to the Constitution. Congress, in particular Speaker Mike Johnson and House Ways and Means Committee Chairman Jason Smith, must now complete the Court’s unfinished work through legislation to terminate the remaining tariff decrees and restore Constitutionally appropriate development of future policy.”

Founded in 1989, PPI is a catalyst for policy innovation and political reform based in Washington, D.C. Its mission is to create radically pragmatic ideas for moving America beyond ideological and partisan deadlock. Find an expert and learn more about PPI by visiting progressivepolicy.org. Follow us @PPI.

###

Media Contact: Ian O’Keefe – iokeefe@ppionline.org

U.S. manufacturing employment is down 108,000 in 2025

FACT: U.S. manufacturing employment is down 108,000 in 2025

THE NUMBERS: U.S. pop-up toaster tariffs and employment–

Tariff rate Employment
2025  15.3% – ~80.0%  0 jobs
2024  5.3%  0 jobs

Rates now include the 5.3% MFN tariff, plus a series of “emergency decree” rates including (i) a 10% worldwide tariff, (ii) country-by-country rates varying from 15% to 30%, (iii) frequently shifting tariffs on Chinese-made toasters, and (iv) a “national security” tariff of 50% on the value of any copper, steel, or aluminum parts and components. The (iv) part makes actual rates vary by model as well as country, and are hard even for CBP line officers to assess.

WHAT THEY MEAN: 

Why did manufacturing employment turn down last year? An illustrative snapshot-in-miniature –

Then-Senator J.D. Vance in July of 2024: “We believe that a million cheap knockoff toasters aren’t worth the price of a single U.S. manufacturing job.” Putting an arithmetical gloss on this a few months later, DC-based tariff proponent Oren Cass used a hypothetical 10% tariff on Chinese-made toasters and a consequent price increase from $30 to $33 to argue that (a) higher tariffs would only modestly raise toaster prices, and (b) a large social and economic benefit would offset this extra cost:

“Damage is done when a consumer who would have benefited from a $30 toaster chooses not to buy one for $33. A second cost appears as consumers switch to domestic options that are more expensive. The consumer who buys the $32 toaster made in America pays the extra $2, but the government collects no extra revenue. Still, the share of the $32 purchase price that would once have gone to a Chinese factory and its workers now goes to an American firm and its workers instead. It pays American taxes and supports American families in American communities.”

Our own look in September had taken a different view. Setting aside the cost – across the full range of consumer spending on physical goods, the $2-per-toaster price increase would reduce average family purchasing power by about $2,000 – the claim that a 10% tariff would mean more U.S. toaster-manufacturing didn’t look realistic.  At that time, no U.S. companies were making home pop-ups at all back then, though some were making large mass-production toasters for hotels and restaurants. The example of successful high-end pop-up makers in three peer countries — Dualit in the U.K., Italy’s Milantoast, and Japan’s Mitsubishi TO-ST1-T — suggested that a 10% tariff wouldn’t change that, and toaster prices would likely have to go somewhere around $300 before U.S. firms would go back to making pop-ups.

More fundamentally, the premise of a “10% tariff increase on toasters” wasn’t right, since what the Trump/Vance campaign was pitching at the time (and its administration successors have implemented since) was not a toaster or appliance-specific policy, but a general tariff increase also applying to the metals, heating elements, screws, plastic buttons, electrical wiring, etc., manufacturers need to make them. Our conclusion then:

“To get the spectacular ten-fold price-hike that sustains super-toaster making in Japan, Italy, and the UK, you’d need a 900% tariff or some equivalent policy. (Or, if you need only a five-fold price jump to make less impressive appliances profitable, 400%.)  In fact, the additional Trump/Vance tariffs on metals, wiring, buttons, plastics, and other inputs would make U.S.-based toaster-making — including for currently successful producers like Holman Star — harder, not easier. The differentially higher tariff on Chinese-made pop-ups might push some into Vietnam or the Philippines, or possibly Mexico, but that would be the end of it.”

Sixteen months later, abstract arguments on hypothetical policies have been joined by real-world data and experience. Here’s what they say:

Policy: The 5.3% toaster tariff in the Congressionally authorized “MFN” tariff system (HTS 851672) still exists, but the Trump administration tariff decrees have put a sort of carousel of shifting rates on top of it. A rundown:

  • Three Feb. 1st, 2025, decrees added 10% tariffs for Chinese-made toasters, plus 25% on hypothetical Mexican and Canadian alternatives. The Mexican and Canadian ones went away.
  • An April 2nd decree created a new 10% worldwide rate for most goods, including all home appliances, plus country-by-country rates varying from 15% to 50%.

Note: At this point in early April, Howard Lutnick, the Commerce Secretary, predicted an “army of  millions and millions” of Americans would be taking assembly-line jobs turning screws in appliance and consumer electronics factories.

  • An up-and-down set of U.S.-China tariff retaliations in April and May spiked the extra China-toaster tariff rate to 125%, then reduced it to 20%.
  • The July amendment to the April 2 decree set rates of 19% and 20% rates for Southeast Asian and Taiwanese toaster-producers.
  • The Commerce Department’s August 19th decree, defining toasters as a “steel or aluminum derivative product,” put a 50% worldwide tariff on the value of steel and aluminum included in toasters. If you can’t figure out the metal value, it’s a flat 50%.

Extremely complicated, but the basics are a higher worldwide tariff and an especially high one on Chinese-made stuff. What’s happened since? At least so far, our mid-2024 guess at what the real-world impact might be looks extremely close to the real-life experience.  Here’s the data:

1. Higher costs for families: A Cleveland Fed study of tariff impacts suggests that the various decrees have hiked the prices of tariffed goods by about 6.6%, and that the price of locally produced substitutes has gone up by about 3.8%. So, in Mr. Cass’s case of a toaster previously costing $30, the family will very likely pay $2 more.

2. Small toaster production shift: The spikes and volatility in China policy have encouraged some production shifts, with a few toaster-makers moving assembly from China to Malaysia last summer. By November, imports of toasters had dropped a bit, but China still accounted for 95% of toaster sourcing, with Malaysia at 4%. We were slightly off, having guessed at Vietnam and the Philippines as the likely beneficiaries. Not terrible guesses – the differential China tariff has pushed a lot of microwave and personal computer assembly to Vietnam, and the Philippines has picked up some vacuum cleaners – but Malaysia seems to have the toaster-making advantage.

3. No change in U.S. industry and manufacturing employment trending down: No U.S. firm is making pop-ups, so Mr. Vance’s hypothetical guy hasn’t found a toaster job. Nor, on a larger scale, has anyone enlisted in Mr. Lutnick’s ghostly screw-turning army.  To the contrary, with higher tariffs on industrial inputs like the metals and wiring, fewer Americans are turning screws on production lines now than were a year ago. Per the Bureau of Labor Statistics, overall U.S. manufacturing employment dropped by 108,000 last year, with home appliance production shedding 2,600 jobs and consumer electronics shedding 800 more.

FURTHER READING

PPI’s four principles for response to tariffs and economic isolationism:

  • Defend the Constitution and oppose rule by decree;
  • Connect tariff policy to growth, work, prices and family budgets, and living standards;
  • Stand by America’s neighbors and allies;
  • Offer a positive alternative.

Data:

Lending Tree’s chocolate-price survey.

And NRF’s Valentine forecast.

Then:

Then-Sen. Vance’s toaster dream.

PPI on the $300-per-toaster cost it likely implies.

… and Mr. Cass’s rosier view.

Now:

Harvard Price Lab tracks the prices of consumer goods subject to new tariffs.

And per the Financial Times (subs. req.), tariff carousel continues to turn, as Trump administration officials scramble to dial back the August 19 rules on “steel and aluminum derivative products”:

“Donald Trump is planning to scale back some tariffs on steel and aluminium goods as he battles an affordability crisis that has sapped his approval ratings … [Anonymous FT sources] said trade officials in the commerce department and US trade representative’s office believed the tariffs were hurting consumers by raising prices for goods such as pie tins and food and drink cans.”

ABOUT ED

Ed Gresser is Vice President and Director for Trade and Global Markets at PPI.

Ed returns to PPI after working for the think tank from 2001-2011. He most recently served as the Assistant U.S. Trade Representative for Trade Policy and Economics at the Office of the United States Trade Representative (USTR). In this position, he led USTR’s economic research unit from 2015-2021, and chaired the 21-agency Trade Policy Staff Committee.

Ed began his career on Capitol Hill before serving USTR as Policy Advisor to USTR Charlene Barshefsky from 1998 to 2001. He then led PPI’s Trade and Global Markets Project from 2001 to 2011. After PPI, he co-founded and directed the independent think tank ProgressiveEconomy until rejoining USTR in 2015. In 2013, the Washington International Trade Association presented him with its Lighthouse Award, awarded annually to an individual or group for significant contributions to trade policy.

Ed is the author of Freedom from Want: American Liberalism and the Global Economy (2007). He has published in a variety of journals and newspapers, and his research has been cited by leading academics and international organizations including the WTO, World Bank, and International Monetary Fund. He is a graduate of Stanford University and holds a Master’s Degree in International Affairs from Columbia Universities and a certificate from the Averell Harriman Institute for Advanced Study of the Soviet Union.

Read the full email and sign up for the Trade Fact of the Week.