
Valentine’s Day boxed chocolate prices are up 11.8% this year 💝📈😡💔

Valentine’s Day boxed chocolate prices are up 11.8% this year 💝📈😡💔

FACT: Valentine’s Day boxed chocolate prices are up 11.8% this year.

THE NUMBERS: Tariff increases on cacao and chocolate, Jan.-November 2025*


Total $544 million
Cacao beans, paste, and cocoa butter $313 million
Chocolates & cocoa powder $231 million

*Most recent data available.

WHAT THEY MEAN: 

Why does your V-Day box of assorted cremes, darks, truffles, and ganache cost so much? Partly it’s an unavoidable natural consequence of last year’s bad weather in West Africa, and partly it’s self-inflicted via tariffs. A look at the chocolate world — trees and farmers, shippers and chocolatiers, retailers and lovers — and the impact of eccentric and ill-judged policy:

Sources, Trade, and Production: Chocolate comes from the cacao tree, a shade-loving evergreen native to the Amazon. About 20 feet high when mature, the tree produces a few dozen green, red, or purple “pods” annually, each weighing about a half kilo and containing 20 to 50 beans. It’s not quite true to say that no chocolate originates in the United States — artisanal Hawaiian and Puerto Rican farmers produce about 100 tons of beans a year —but that’s a tiny fraction of the quarter-million tons American chocolatiers use annually. Most come from West Africa: Cote d’Ivoire grows nearly half of the world’s annual 5.6 million tons of cacao beans and neighboring Ghana adds 0.6 million more, with Ecuador third and Indonesia fourth.

Cacao farmers pluck the pods twice a year, then extract, ferment, and dry the beans to prepare them for sale. The New York Botanical Gardens explain:

“The fruits are cut from the tree and split open with machetes to extract the seeds surrounded by the white pulp. Next, the seeds are put into wooden boxes to ferment for usually three to six days. The fermentation causes the development of the characteristic aroma and flavor of chocolate, and in the breakdown of the white pulp surrounding the seeds. The beans are dried, either in the sun or in ovens, and the remaining pulp is removed.”

American chocolatiers are the world’s fourth-largest buyers (Europeans do more), purchasing 235,000 tons last year, with 82,000 tons from Cote d’Ivoire, another 84,000 tons from Ghana and Ecuador combined, and the rest divided among about 15 other producers around the world. Along with this came 311,000 tons of semi-processed cocoa paste and cocoa butter, with Côte d’Ivoire, Indonesia, Malaysia, and Ghana the main sources. All are duty-free under the normal, Congressionally authorized U.S. tariff system. Next step:

“In the chocolate factory, the beans are roasted to further enhance the flavor [ed. note: turning them from “cacao” into “cocoa” beans] and then the seed husk is broken and blown away in a process called winnowing, which leaves only pieces of the embryo called nibs. The nibs are ground into chocolate liquor, which is run through a hydraulic press to yield cocoa butter on one side and cocoa powder (which also contains some cocoa butter) on the other side of the press.” 

The powder goes to drinks, and the “butter” (mixed in various degrees with milk, sugar, etc.) to confections. Compressing the whole tree-to-tongue supply chain, one or two pods go into a chocolate bar (roughly one pod for milk, and two for dark), and a 14-piece assortment needs about five pods. U.S. chocolatiers produce about 2.1 million tons annually, while grocers and retailers import another 755,000 tons, mainly from Canada and Europe.

Prices, Weather, and Tariffs: If this Saturday’s Valentine gift seems especially expensive, you’re not wrong. A Lending Tree study this month found that prices for boxed assortments have jumped by 11.8% on average since last February, and in some cases nearly doubled.

One reason for the spike is natural and unavoidable. Drought and unusual heat in West Africa last year meant trees produced fewer beans. This pushed prices up from $2,000 to $3,000 per ton of beans to above $10,000. The other reason is artificial and self-inflicted: the Trump administration’s April 2 tariff decree imposed 21% tariffs on Ivorian beans, 10% on Ghanaian beans, 32% on Indonesian beans, and 10% on beans from Ecuador. (Again, all were previously duty-free.) On top of this, they added 20% tariffs on European Union confectionery and 31% on Swiss confectionery. Rates have shifted around a lot — a July rewrite of the decree reset them at 15% for the West African and Ecuadoran beans, 19% on the Indonesian butter and paste, and 15% for European and Swiss confectionery — but have been raising costs all year long.

Altogether, from April to November the tariffs put over half a billion dollars’ worth of new expenses into the U.S.’ chocolate supply chain. Averaging by month, that’s an extra $25 million in tariffs on $250 million in cacao and chocolate imports. About three-fifths of the cost fell on U.S. chocolatiers buying beans, paste, and butter to turn into bars, truffles, and kisses. (And on their workers: BLS’s most recent data showed confectionery employment down by 3,500 jobs since January.) Grocers and retailers buying finished confections and powder paid the rest. The financials:

2024 2025 Extra payments
Total $71 million $615 million $544 million
Cacao beans   $0 million $111 million $111 million
Cocoa paste and butter   $0 million $202 million $202 million
Cocoa powder   $0.4 million   $59 million   $59 million
Chocolate confectionery $71.million $243 million $172 million

The administration backed off on the beans, paste, and butter tariffs in mid-November, so Ghirardelli and Hershey got some year-end relief. But your Cadbury, Valrhona, Nestle or Lindt box still comes with 15% tacked on.

In sum, the tariff experiment has had some clear results — more costs for chocolatiers, fewer jobs for confectionery workers, and higher prices for couples. To the extent there’s a bright spot: the National Retail Federation’s V-Day forecast — spending up $1.4 billion this year — suggests that couples, if with some regret, have mostly decided to absorb the extra expense rather than scale back. If so, tariffs have imposed a clear cost, but lovers haven’t let it kill the mood.

FURTHER READING

PPI’s four principles for response to tariffs and economic isolationism:

  • Defend the Constitution and oppose rule by decree;
  • Connect tariff policy to growth, work, prices and family budgets, and living standards;
  • Stand by America’s neighbors and allies;
  • Offer a positive alternative.

Data:

Lending Tree’s chocolate-price survey.

And NRF’s Valentine forecast.

Growers & chocolatiers:

The New York Botanical Garden summarizes the trail, from pod on tree to candy in box.

The World Cocoa Foundation (a non-profit consortium of producers, confectioners, governments, and transport firms) has material on development and sustainability, trade and prices, small-farmer support, and more.

The Ghana Cocoa Board explains Ghana’s cacao industry.

The European Union-funded Sustainable Cocoa program supports labor law and reforestation in Cote d’Ivoire, Ghana, and Cameroon.

The Hawaii Chocolate and Cacao Growers Association introduces the U.S. cacao-growing industry.

And San Francisco-based Ghirardelli has chocolate-tasting pro tips.

Some V-Day Chocolate History

Chocolate’s association with sensuality and romance, and the accompanying hints of possible aphrodisiac effects, are old and very durable. The specific tie to Valentine’s Day is originally British. Chocolate-bar inventor and marketing pioneer Richard Cadbury came up with the heart-shaped box as a romantic gift in the 1860s. Cadbury was taking advantage of a much older tradition, which seems to have originated in the Aztec Empire. Here’s Bernal Diaz del Castillo’s account of a banquet with the Aztec emperor Moctezuma in 1521:

“De cuando en cuando le traian en unas copas de oro fino con cierta bebidea del mismo cacao, que decian era para tener accesso con mujeres.”

English translations seem a little euphemistic — one reads “from time to time they brought him a certain drink made from cacao in cups of pure gold, which they said he took when he was going to visit his wives” — but Diaz del Castillo’s original Spanish doesn’t leave many doubts.

As a trade policy sidenote, cacao trees didn’t grow in the Aztec heartland — too dry — and the emperors, a bit like Americans today, got the cacao beans through a picturesque state trading enterprise.  The Florentine Codex (Book 9) says they financed annual merchant expeditions to Maya principalities in modern-day Chiapas and Guatemala, carrying woven cotton clothes, rock crystal earrings, and gold jewelry to exchange for jade, quetzal and spoonbill feathers, and cacao beans.

For the big picture, The True History of Chocolate (Sophia and Michael Coe, 2013) takes you from Aztec nobles — they liked chocolate as a whipped drink, like a cappuccino — through 19th-century innovators Cadbury and Fry to modern mass markets and high-end tasting.

And some science:

Is chocolate really an aphrodisiac? Italian researchers in 2006, having done a sex-life survey of two groups of women in 2006 — one eating a lot of chocolate and the other not — bleakly concluded that “no differences between the two groups were observed.” A more recent look in Southern California, this one with both male and female subjects, got the same result.

But via an earlier PPI Trade Fact, some other scientists reported in 2012 that it might actually, maybe, hold up for supposedly boring vanilla. This study used male lab rodents rather than human subjects, though.

PPI wishes friends and readers a romantic and happy Valentine’s Day, even if it’s a little harder to afford this year.

ABOUT ED

Ed Gresser is Vice President and Director for Trade and Global Markets at PPI.

Ed returns to PPI after working for the think tank from 2001-2011. He most recently served as the Assistant U.S. Trade Representative for Trade Policy and Economics at the Office of the United States Trade Representative (USTR). In this position, he led USTR’s economic research unit from 2015-2021, and chaired the 21-agency Trade Policy Staff Committee.

Ed began his career on Capitol Hill before serving USTR as Policy Advisor to USTR Charlene Barshefsky from 1998 to 2001. He then led PPI’s Trade and Global Markets Project from 2001 to 2011. After PPI, he co-founded and directed the independent think tank ProgressiveEconomy until rejoining USTR in 2015. In 2013, the Washington International Trade Association presented him with its Lighthouse Award, awarded annually to an individual or group for significant contributions to trade policy.

Ed is the author of Freedom from Want: American Liberalism and the Global Economy (2007). He has published in a variety of journals and newspapers, and his research has been cited by leading academics and international organizations including the WTO, World Bank, and International Monetary Fund. He is a graduate of Stanford University and holds a Master’s Degree in International Affairs from Columbia Universities and a certificate from the Averell Harriman Institute for Advanced Study of the Soviet Union.


The U.S. public’s view of Trump tariffs was negative at the start. Few if any minds have changed since.

FACT: Most Americans disliked higher tariffs a year ago, and few minds have changed since.

THE NUMBERS: CNN/SSRS surveys on Trump tariffs –

“Disapprove” “Approve”
January 2026 62% 37%
July 2025 61% 39%
March 2025 61% 39%

CNN/SSRS surveys in March 2025July 2025, and January 2026.  

WHAT THEY MEAN: 

Pollsters have been pestering Americans about trade and tariffs since the 1950s, but probably never as much as last year. Since the Trump administration’s first tariff decrees — last February 1, a year ago last Sunday — our probably incomplete count finds CNN/SSRS and Washington Post/ABC asking about tariffs three times each, the Pew Center twice, Fox News six times, NYT/Siena three times, the Wall Street Journal four, with Gallup, AP, the Economist and Reuters adding lots more. With their national data has come a gush of previously rare polling on tariff attitudes in individual states. The resulting mass of stats conveys a pretty simple message: Most Americans disliked higher tariffs a year ago, and few minds have changed since.

A summary with national averages, crosstabs, and states –

1. National: National polls suggest that (a) more than 60% of Americans disapprove of Mr. Trump’s tariffs, (b) a bit fewer than 40% support them, and (c) the most recent results look like the earliest ones. The CNN/SSRS figures above are pretty close to the overall average, but see below (“Further Reading”) to compare them with Washington Post/ABCFox News, and New York Times/Siena.

2. Crosstabs: Within this broad opposition, polling finds some consistent divisions of opinion. Three especially striking ones (and see “Further Reading” for two more):

Red v. Blue: Democrats nearly unanimously opposes, Republicans strongly but less enthusiastically support, and independents pretty decisively take the “blue” side. Fox News’ January survey, for example, reports opposition at 92%-8% among Democrats and 82%-18% among political independents, while Republicans approve by 71%-28%. At the state level, Bowling Green State’s October Ohio poll has an exceptionally sharp partisan split: within Ohioans’ overall 60%-40% disapproval, Democrats oppose the tariffs 97%-3%, and their independent neighbors oppose 83%-16%, while Republicans support 77%-23%.

Race & Ethnicity: African Americans are most opposed to tariffs, white Americans are most closely divided (though with anti-tariff majorities), and Hispanics are in between. For example, this January’s NYT/Siena poll (which seems to get the friendliest results for the administration) found white Americans opposing tariffs 51%-43%, African Americans 66%-25%, Hispanics 50%-29%, and “others” 63%-32%. Fox, meanwhile, had white Americans “disapproving” 61%-39%, African Americans 74%-26%, and Hispanics 67%-33%. Data on Asian American views is scarcer, but an AP poll last July showed Asian Americans and Pacific Islanders significantly more likely than Americans as a whole to believe tariffs would likely reduce job opportunities and raise prices, and the Pew Center’s April poll found 70%-28% Asian American “disapproval” of tariff increases. (We haven’t found a Native American survey, but try Native Voice One‘s in-depth radio discussion.)

Education: The education gap is a bit narrower, but socially illuminating. January’s NYT/Siena poll finds Americans with college degrees opposing tariffs by a very wide 65%-31% margin, and non-college Americans by a much narrower 48%-42%. The widest gulf is among white Americans: a 50%-43% plurality of non-college white respondents support the administration’s tariffs, while white Americans with college degrees oppose them by 63%-34%. NYT’s (very aggregated) “non-white” respondents are less sharply divided, with “non-college non-white” respondents opposing tariffs by 53%-30% and college degree holders by 72%-20%.

3. States: State polls add depth on regional opinion, and often ask distinctive questions that yield unexpected insights. Three examples (and more below):

New Hampshire: Relative importance of tariffs – The University of New Hampshire’s November poll provides a sense of the priority the public gives tariffs as an economic issue. Overall, 45% of their respondents approved of Mr. Trump’s economic management, while 54% disapproved. Among the “approving” minority, 27% cited tariffs as the most important reason for their good review. This was a higher share than any other issue got, and another 3% added “trade.” But an even larger 38% of the majority “disapprovers” cited tariffs as the most important factor in their opinion. So the New Hampshire public appears to agree that tariffs are very important, but on balance feels they’re important in a bad way.

Ohio: Tariff effects by economic class, business type, and unions – Bowling Green State University has polled Ohio twice, first in April and then in October. This went beyond broad approve/disapprove totals (60% disapproving and 40% approving in October, with 44% “strongly” disapproving and 18% “strongly” approving) to ask about the sort of people, institutions, and businesses who might benefit from tariffs. The answers suggest Ohioans developed an increasingly “un-populist” view of tariff impacts over the year. In April, 42% of respondents thought tariffs would help labor unions; by October, the share had fallen to 34. The share feeling tariffs might help small businesses likewise dropped from 41% to 35%, and those believing tariffs would help “the middle class” dropped from 42% to 36%. Meanwhile, the shares believing tariffs would benefit “the wealthy” and “large corporations” rose from 66% to 73% and from 60% to 67%

Texas: Levels of consensus on family finances, prices, and jobs – A December 2025 poll by the UT/Austin’s Texas Policy Project reports that 52% of respondents believe tariffs “will hurt my family,” while 20% think they will help, and 28% aren’t sure. Perceptions on price impacts were near-consensus: 67% believe tariffs are raising prices for “everyday goods,” while 9% think they’re lowering prices, and 25% weren’t sure. Guesses about job impact were most divided, with 42% feeling that tariffs mean fewer jobs for U.S. workers, while 29% predicted more jobs, and 29% didn’t know.

FURTHER READING

PPI’s four principles for response to tariffs and economic isolationism:

  • Defend the Constitution and oppose rule by decree;
  • Connect tariff policy to growth, work, prices and family budgets, and living standards;
  • Stand by America’s neighbors and allies;
  • Offer a positive alternative.

Some specialty polls:

AP’s July survey of Asian American views.

Also in July, Equis surveys Hispanic America; 58% “oppose” tariff increases and 31% “support.”

The Chicago Council on Global Affairs has public views on America’s broader role in the world — foreign policy, national security and military alliances, and humanitarian work, as well as trade and finance. The survey overall finds a public mood far removed from the Trump administration’s protectionism and confrontational approach to America’s historic allies, and the trade material meshes with the more political polls in showing Democrats and independents moving away from support for trade barriers.

Not a poll, but still illuminating: A Native Voice One radio call-in show features fabric designer Denise Hill (Wahpeton), Montana State Senator Susan Webber (Blackfeet), North Carolina economist Larry Chavis (Lumbee), and business owner Jeff St. Louis (Chippewa) on Native community and business experience with tariffs, including Sen. Webber’s role as lead plaintiff in the Blackfeet Nation’s case against ’emergency’ tariffs on Canadian goods as a treaty violation.

More nationals:

The Washington Post/ABC survey found 64% “disapproving” of Mr. Trump’s tariffs last April, and 34% “approving.” A September follow-up got the same 64%-34% split, and October’s 65%-33% was a little worse.

Fox News’ first survey last April found 58%-33% disapproval. September’s, their third, got 63%-36%, and the sixth, out last week, a statistically identical 63%-37%. To the extent this poll shows some shifting over time, it looks more like “hardening opinion” than “changing views”: 9% were “uncertain” or “don’t know” last April, and none — 0% — this January.

New York Times/Siena uses slightly different words — “support or oppose,” rather than “approve or disapprove.” Their results are modestly friendlier for the administration, but just as stable: in last July’s survey, 55% “opposed” and 40% “supported” tariffs; this January’s split was 55%-38%.

More States

Arizona: Phoenix surveyors Noble Predictive Insights in May found 51% of Arizonans saying tariffs hurt the economy, and 37% that they help.

California: The Public Policy Institute of California (PPIC, in San Francisco) reports 72% of Californians oppose new tariffs on imported goods, while 25% support them. This is about the same as the 73%-26% disapproval of Trump’s job performance.

Maine: In April, the University of New Hampshire found a 52%-41% negative result in Maine. The gap wasn’t huge, but disapprovers were much more strongly “con” than approvers were “pro”: 48% of respondents “strongly” disapproved while only 20% “strongly” approved.

MichiganTariffs on Canadian goods – In a September poll for the Detroit Regional Chamber of Commerce, 48% of Michiganders thought tariff increases had been bad for the Michigan economy, 28% thought they were good, and 23% weren’t sure or thought there hadn’t been any significant impact. Respondents were particularly alarmed by potential tariffs on Canadian products, with 57% believing this would be bad for the Michigan economy and 19% good.

North CarolinaPersonal v. national impact – Elon University’s September poll asked North Carolinians whether they have “experienced a personal positive or negative impact from the Trump administration’s tariffs.” Among their respondents, 46% reported negative impacts and 14% positive, while 40% didn’t notice much either way. Adding to this, a November poll by the John Locke Foundation (an against-the-tide small-government Raleigh think tank) found North Carolinians generally negative, but with more division on potential “national” benefit from tariffs than on personal impact. By 54%-38%, they thought tariffs hurt rather than help the U.S. economy; at home, by 56%-19%, they thought tariffs hurt rather than help their family finances.

South Dakota: An unusual exception, as a November poll done by Mason-Dixon found 49%-44% plurality support for tariffs. South Dakota is a youth-v.-age exception too, as the poll found younger South Dakotans more pro-tariff (50%) than the over-50s (44%).

WisconsinMarquette Law School gets 63% disapproving and 37% approving of Mr. Trump’s tariffs in November. This is very close to the 64%-36% disapproval majority of his economic policy in general, and worse than the 57%-43% disapproval of his presidency.

More crosstabs:

Youth v. Age: Polling for decades has found younger Americans more enthusiastic about trade, and less supportive of tariffs than their elders. Mr. Trump’s experiment hasn’t changed this. In CNN/SSRS’s January poll, for example, 18-34-year-olds disapproved of it by 71%-29%. In the grayer tiers, late-career respondents from 50 to 64 disapproved by a smaller 54%-46% margin, and retirement-eligible over-65s by a statistically identical 54%-45%.

Gender: Polling doesn’t indicate a very wide “gender gap” on tariffs, though women generally disapprove more than men. CNN/SSRS, for example, found men disapproving by 59% to 40%, and women by 64%-35%.

ABOUT ED

Ed Gresser is Vice President and Director for Trade and Global Markets at PPI.

Ed returns to PPI after working for the think tank from 2001-2011. He most recently served as the Assistant U.S. Trade Representative for Trade Policy and Economics at the Office of the United States Trade Representative (USTR). In this position, he led USTR’s economic research unit from 2015-2021, and chaired the 21-agency Trade Policy Staff Committee.

Ed began his career on Capitol Hill before serving USTR as Policy Advisor to USTR Charlene Barshefsky from 1998 to 2001. He then led PPI’s Trade and Global Markets Project from 2001 to 2011. After PPI, he co-founded and directed the independent think tank ProgressiveEconomy until rejoining USTR in 2015. In 2013, the Washington International Trade Association presented him with its Lighthouse Award, awarded annually to an individual or group for significant contributions to trade policy.

Ed is the author of Freedom from Want: American Liberalism and the Global Economy (2007). He has published in a variety of journals and newspapers, and his research has been cited by leading academics and international organizations including the WTO, World Bank, and International Monetary Fund. He is a graduate of Stanford University and holds a Master’s Degree in International Affairs from Columbia Universities and a certificate from the Averell Harriman Institute for Advanced Study of the Soviet Union.
Read the full email and sign up for the Trade Fact of the Week.

The U.S. lost 20,000 scientific research jobs last year

FACT: The U.S. lost 20,000 scientific research jobs last year.

THE NUMBERS: Real-dollar growth in R&D spending, 2020-2023* –

World known $400 billion
China $173 billion
United States   $93 billion
Western Europe**   $55 billion
Japan/Korea/Taiwan   $55 billion
All other known***   $24 billion

* PPP basis, constant 2020 dollars. OECD Research and Development Indicators database
** 27 EU members, the United Kingdom, Switzerland, Norway, and Iceland.
*** Australia, New Zealand, Israel, Turkey, Costa Rica, Chile, Colombia, Argentina, Russia, Singapore, South Africa. OECD’s database does not include ASEAN members other than Singapore, the Middle East other than Israel, Africa other than South Africa, and Latin America/Caribbean apart from the four above.

WHAT THEY MEAN: 

Headline from trade journal R&D World’s 2025 forecast:

“The question is no longer if China will surpass U.S. R&D spending, but what happens next. R&D World’s 2025 Global Funding Forecast projects China reaching effective parity with the U.S. this year ($1.05T versus $1.07T in PPP terms), with a full crossover expected by 2026.”

Background:

The post-COVID pandemic years were good ones for American science. Research investment stats take a few years to work out, but the National Science Foundation estimates that in 2023 Americans spent $923 billion on research and development — the world’s highest figure by about $100 billion, and up (without adjusting for inflation) from $730 billion in 2020. This was 3.45% of American GDP, tied with Japan for the world’s fifth-highest total and behind only Israel, Korea, Taiwan, and Sweden. Employment figures are more up-to-date, and show that from December 2020 to December 2024, America’s count of working scientists rose from 788,000 to 941,000 — over 150,000, raising the total by 20%. Altogether, Americans interested in mRNA vaccines, artificial intelligence, next-generation space telescopes, autonomous cars and planes, agricultural bee vectoring, etc., could feel proud of national accomplishment and excited about the future.

The U.S. isn’t alone, of course. The OECD tries to tally spending by country, and then to convert the yuan, euros, yen, won, pounds, etc., into dollar equivalents. Their count isn’t complete — it misses India, Brazil, and generally most large developing countries — but it probably gets most of the world’s science. They find R&D investment growing by about $400 billion from 2020 through 2023. Currency conversions and inflation adjustments mean you should read these figures more as approximations than precise comparisons, and likewise, “amount of money spent” isn’t identical to “actual scientific progress”. But they’re still pretty striking:

2020 2023 Real-dollar Growth
World known $2.4 trillion $2.8 trillion $400 billion
U.S. $730 billion $823 billion   $93 billion
China $608 billion $781 billion $173 billion
Western Europe $582 billion $637 billion   $55 billion
Japan/Korea/Taiwan $333 billion $388 billion   $55 billion
All other known $147 billion $171 billion   $24 billion

OECD, constant PPP-basis 2020 dollars.

In sum, despite the U.S.’s pretty big push, China by itself accounted for nearly half of all world R&D growth. In the abstract, competition among leading economies to put more money into research and invent more new things — whether for national prestige, for wealth and economic growth, or a better understanding of nature and broadly shared human progress — can be a net good. The startlingly fast growth in Chinese R&D, in this sense, might be a spur for Americans to try harder. But in fact, something quite different is happening.

American private-sector research remains strong. The government’s contribution doesn’t. The Trump administration’s first year brought large-scale firing of government scientists, a shrinking total science workforce, and attempts to “institutionalize” this for the future. This began with chaotic purges of science-agency talent and research-contract cancellations during the “Department of Government Efficiency” debacle — the U.S. Geological Survey and the National Air and Space Administration staff cut by a fifth, the Centers for Disease Control by a third, the National Oceanic and Atmospheric Administration by a sixth; $2.6 billion in National Institutes of Health and $1.6 billion in National Science Foundation awards contracts canceled — and has been followed up with a more systematic attempt to disinvest from science.

Last September, the venerable American Association for the Advancement of Science reported that, altogether, the administration planned to cut federal R&D support from $197.5 billion in FY2025 to $154.0 billion in FY2026. Whether in percentages or total dollars, this would be the largest science budget cut ever — probably large enough all by itself, assuming Chinese growth has continued, to fulfil R&D World’s prediction and push the United States down into second place. Private-sector research can’t really compensate for this, as government programs weigh more toward basic research, which lacks immediate commercial return — space exploration in the 1960s, the invention of computer networks in the 1970s — but sometimes have very large long-term payoff. And in any case, the Bureau of Labor Statistics’ job tallies indicate that private-sector science may be following the government down. Its count of working scientists fell by 20,000 last year, the first net loss in a decade:

December 2025 921,000
December 2024 941,000
December 2023 934,000
December 2022 913,000
December 2021 860,000
December 2020 788,000
December 2015 672,000

OECD, constant PPP-basis 2020 dollars.

Different policies might bring some of them back. But looking further ahead, drastic slowdowns in legal immigration, presaged in this month’s decision to stop processing immigrant visas for 75 countries, would mean a structurally smaller American talent pool. The National Science Foundation reports that a quarter of American scientists, engineers, and lab techs were born abroad, including nearly 60% of the doctorate-level mathematicians, computer scientists, and engineers.

As they say, sometimes decline is a choice. But:

The Trump administration’s fecklessness doesn’t have to be “America’s choice.” At least in budgeting, the administration’s declining overall reputation appears to have emboldened Congress to reclaim its Constitutional role as the arbiter of spending. Without diving too deeply into arcane appropriations jargon — budget authority, outlays and obligation, FTEs, omnibus and minibus, etc. — Congress two weeks ago passed the “Commerce, Justice, and Science Appropriations” bill, which funds the National Science Foundation (NSF), National Aeronautics and Space Administration (NASA), and the National Oceanic and Atmospheric Administration (NOAA. This restored nearly all the science investment Mr. Trump’s clan wanted to cut, and bars agencies from moving money from science to non-science offices. AAAS’s current tally foresees a cut of 3.6%, as against the nearly 25% it foresaw last summer. A pretty big step, though the bills funding the two agencies that comprise about 77% of all of the federal government’s RD funding — the Department of Defense and the badly wounded Department of Health and Human Services — aren’t yet done. Good start. Lots more to fix.

FURTHER READING

PPI’s four principles for response to tariffs and economic isolationism:

  • Defend the Constitution and oppose rule by decree;
  • Connect tariff policy to growth, work, prices and family budgets, and living standards;
  • Stand by America’s neighbors and allies;
  • Offer a positive alternative.

The way it ought to be:

Vannevar Bush’s 1945 report to the Truman administration, The Endless Frontier, makes the classic case for public commitment to science.

PPI’s Paying for Progress (2024), from PPI Vice President for Policy Development Ben Ritz and Laura Duffy, offers a comprehensive budget vision proposing — among lots else — much larger R&D investment and much lower tariff rates.

The way it is: 

The American Association for the Advancement of Science reports (July 2025) on Trump
administration’s science budget cuts.

Ritz and PPI Policy Analyst Alex Kilander on R&D budgeting (March 2025).

PPI Director of Health Care Policy Alix Ware on the implications for medical research and cancer treatments. (May 2025)

And back to AAAS for a more recent, and more hopeful, dashboard tracking Congressional appropriations. (January 2026)

Country comparisons

The National Science Foundation on R&D spending by country.

OECD’s Main Science and Technology Indicators.

AAAS compares the U.S., China, and the world.

And R&D World predicts that China will be the world’s top researcher in 2026.

And American Talent:

NSF on the U.S. sci/tech workforce – places, demographics, diversity, education, etc.

The Institute for International Education counts international students. In the 2024/25 academic year, 217,000 international students were studying engineering in U.S. universities, 305,000 in math and computer science, and 96,000 in physical and life sciences.

Read the full email and sign up for the Trade Fact of the Week.

The U.S. has no claim to Greenland

FACT: The U.S. has no claim to Greenland.

THE NUMBERS: Trump tariff threats last week –

10% tariffs on goods from Denmark, Finland, France, Germany, the Netherlands, Sweden, Norway, and the U.K., rising to 25% by summer.

WHAT THEY MEAN: 

Over the weekend, Mr. Trump threatened to impose tariffs of 10% on February 1, rising to 25% by summer, on goods from eight historic allies — Denmark, Norway, Sweden, Finland, France, the Netherlands, and the United Kingdom — over their unwillingness to support his strange ambition to acquire Greenland. So far, the White House has published no actual decree or other document giving this threat any force, and — as with last October’s threat for a similar 10% tariff on Canadian goods, meant to retaliate for an Ontario government advertisement quoting the late President Reagan on tariffs — perhaps it will simply go away.

That autumn threat, however, has done lasting harm: after a year of Mr. Trump’s provocations, the Canadian government has felt forced to make auto-trade and other arrangements with China to diminish the effect of any U.S. tariff on Canadian goods. The harm done by last week’s threat against America’s European friends will likewise escalate over time until it is reversed.

With this in mind, three points: the U.S. has no legal, historic, or other claim to Greenland; the administration’s effort to make such a claim is corroding American security; and Congress should repeal any tariffs on these countries immediately, and then reform trade law more generally to halt tariff innovation by decree and restore Constitutionally appropriate policymaking. More –

1. Greenland: Greenland is an autonomous country, constitutionally one of three realms of the Danish monarchy, with an elected government that sets its own policies. It is a NATO ally, with a large U.S. military base and an open economy. The governments of both Greenland and Denmark worked closely with the U.S. for eight decades on Arctic security (and often have been advocates of larger Arctic defense commitments than U.S. administrations have been willing to make), resource mining, and any other actual policy concerns, and remain willing to do so. Both have also made clear that sovereignty is not negotiable: neither Danes nor Greenlanders are interested, any more than Americans would be interested in selling off chunks of U.S. land and people to other countries. There is no Greenland “issue.”

2. Security: U.S. military alliance with the world’s advanced democracies — Western Europe, Canada, Japan, Korea, Australia — has been the foundation of American national security and world peace since the Second World War. It needs to remain so. Denmark specifically, as PPI’s Ed Gresser observed last year, is a four-generation ally and good neighbor, which committed 21,000 soldiers to the U.S.’s call for help in Afghanistan and Iraq and lost 50. National Security Director Peter Juul noted last week that threats and abuse against allies and good neighbors — that is, adventures which put this foundation of security at risk — are madness, and adds some time-to-break-the-glass ideas on ways Congress can usefully respond.

3. Tariffs: Congress has Constitutional authority over “Taxes, Duties, Imposts, and Excises,” and needs to use it now. Mr. Trump has shown, repeatedly, over the past year, that he cannot responsibly manage any delegated tariff powers. Congress, and in particular Rep. Jason Smith and House Speaker Mike Johnson, need to remove his temptation to use them. This requires laws to (a) cancel any tariffs on Americans buying Danish or other European goods, and (b) require Congressional approval of any future tariffs imposed under trade laws including the International Emergency Economic Powers Act (“IEEPA”, the basis for most of last year’s tariff decrees, presumably meant by Congress to help address rather than try to create emergencies); the various “Sections” of trade law 232, 301, 122, and 338; and (c) likewise require Congressional approval for entering, or leaving, trade agreements with tariff components.

Such bills already exist. With leadership from Sens. Ron Wyden and Rand Paul last October, the Senate has already voted to terminate Mr. Trump’s IEEPA tariff decrees. The House bill introduced last spring by Trade Subcommittee Ranking Member Linda Sanchez and the other Ways and Means Committee Democrats,  HR 2888, would cancel all of Mr. Trump’s “emergency” and “national security” tariffs and require Congressional approval of any new ones. Now would be a good time for them.

Last point: As we — again — noted last year, the world is full of complex challenges, painful choices among lesser evils, and chronic problems with no obvious solution. The status of Greenland isn’t one of them. To the extent there is any problem, it is quite new and has an obvious and easy solution: the Trump administration should stop causing it.

FURTHER READING

PPI’s four principles for response to tariffs and economic isolationism:

  • Defend the Constitution and oppose rule by decree;
  • Connect tariff policy to growth, work, prices and family budgets, and living standards;
  • Stand by America’s neighbors and allies;
  • Offer a positive alternative.

PPI on Denmark and Greenland:

National Security Director Peter Juul on Mr. Trump’s possible motivations, the costs they are imposing, and Congressional options, January 2026.

New Ukraine Project Director Tamar Jacoby on the European reaction, January 2026.

And Gresser on Greenland and Denmark as good neighbors and four-generation allies, April 2025.

Greenland background:

The Danish government explains Greenland’s constitutional status.

The Greenland Foreign Ministry.

The Danish Embassy is also home to the Greenland Representation Office.

The European Union’s comment yesterday.

Primary source:

The National Archives transcript of the Constitution; see Article I, first line for “Taxes, Duties, Imposts, and Excises.”

Next steps:

Sen. Ron Wyden (D-Ore.) on the Senate vote to repeal the April 2 “global baseline” tariff decree, and Sen. Rand Paul (R-Ky.) on the obvious absence of any Greenland emergency.

Rep. Linda Sanchez (D-Calif.) on ending tariff chaos.

Read the full email and sign up for the Trade Fact of the Week.

Venezuela oil production is down 75% since 1998

FACT: Venezuela oil production is down 75% since 1998.

THE NUMBERS: Venezuelan GDP (constant 2015 dollars*) –

2024 $42.6 billion
1998 $94.1 billion

World Bank

WHAT THEY MEAN: 

Assessing last week’s raid on Venezuela and the arrest of Chavista chief Nicolas Maduro, PPI’s National Security Director Peter Juul expects little good to come:

“Now-former Venezuelan President Nicolas Maduro was a brutal dictator whose dreadful politics and policies, largely inherited from his equally autocratic predecessor Hugo Chavez, ran his country into the ground. The U.S. military operation that captured Maduro once again demonstrated the tactical and operational proficiency of the American armed forces. But neither Maduro’s autocratic governance nor the audacity and skill of the U.S. military in executing assigned tasks are the primary issue at hand here: at the whim of one man and with no real explanation or apparent rationale, the United States has launched an unwise and illegitimate military intervention that only undermines American interests and international security.”

What might be next? Trump administration comments and actions suggest three things. First, the admin. expects to “run” Venezuela for some time to come. Second, its apparent plan is to leave Maduro’s “Chavista” subordinates in place and hope they will cooperate with American managers. And third, U.S. and international energy companies will rebuild Venezuela’s oil industry as the basis for the national economy. Some oil data, then a couple of observations on the challenges a plan like this will face:

Venezuela sits on top of a large pool of petroleum. The U.S. Energy Information Administration and OPEC both cite a figure of 303 billion barrels of “proven reserves” of crude oil. This would be the world’s largest reserve, with Saudi Arabia second at 267 billion barrels and Iran third at 209 billion. (The U.S. has about 45 billion.) The two sources diverge a bit on the worldwide reserve total — EIA guesses 1.80 trillion barrels, OPEC 1.57 trillion — but either way, a 300-billion-barrel figure for Venezuela would be a sixth or maybe even a fifth of the world’s currently recoverable crude oil.

A lot of oil, then. But so far it hasn’t done Venezuelans much good – rather the reverse.  Maria Corina Machado’s Nobel Peace Prize address last December explains:

“The concentration of oil revenues in the State created perverse incentives: it gave the government immense power over society which turned into privilege, patronage, and corruption.  … Oil wealth was not used to uplift, but to bind.  Washing machines and refrigerators were handed out on national television to families living on dirt floors, not as progress but as spectacle.  Apartments meant for social housing were handed to a select few as conditional rewards for obedience.   And then came the ruin: Obscene corruption; historic looting. During the regime’s rule, Venezuela received more oil revenue than in the previous century combined. And it was all stolen. Oil money became a tool to purchase loyalty abroad while at home criminal and international terrorist groups fused themselves to the state. The economy collapsed by 80%. Poverty surpassed 86%. Nine million Venezuelans were forced to flee.”

And looking ahead from this point of inflection, there are some good reasons to believe a rebuilding plan centered on energy income isn’t likely to work: challenging at best for objective reasons, relying on partners who probably aren’t very reliable, and maybe the wrong strategic direction in general.

(1) Objective problems: The Chavista governments may have exaggerated the “300 billion barrels” figure for political reasons, so it should be thought of as a “theoretical maximum” rather than a firm number.  And whatever the actual reserve level, Venezuela’s oil is pretty low quality — “heavy” and “sour” as opposed to the “light” and “sweet” refiners usually prefer. (“Heavy” meaning dense, carrying lots of asphalt and tar, harder to pump and transport; “sour” shorthand for high sulfur and sometimes metal content, thus needing more processing to reduce pollutants.)

(2) Likely unreliable partners: The 26 years of “Chavismo” featured regular large diversions of money from the state oil company PdVSA to regime loyalists and overseas clients, firings of skilled but politically independent-minded staff, and decaying infrastructure. So despite large reserves, the machines and wells needed to bring oil out of the ground and to ports are in bad shape. Venezuela’s real-world production is only about 1% of the world total:  810,000 barrels produced per day, down about 75% from 2.7 million barrels in 2014 and 3.1 million in 1998, and a bit less than 1% of the world’s 102.5 million-barrel daily output. Put bluntly, the administration seems to be relying on the people responsible for this to fix it.

(3) Probably the wrong strategy anyway: Venezuela is too reliant on oil. The WTO’s World Trade Profiles reports that oil exports — even in PdVSA’s current decrepit state — accounting for 75% of Venezuela’s $5 billion in exports. For a regional index, energy makes up 50% of Colombia’s $75 billion in total exports, 39% of Ecuador’s $33 billion, and 28% of Trinidad’s $13 billion.  Ms. Machado’s comments on Venezuela’s experience are an extreme case of a general problem: developing countries solely reliant on resource exports risk concentration of power and wealth, internal corruption, and economic “Dutch disease” in which oil revenue inflates currency values and perversely shrinks the more labor-intensive agriculture and manufacturing sectors.

So a plan based on reviving large-scale Venezuelan energy exports, if it works, will be expensive and slow. Relying on the Chavista officials who crippled it over the past quarter-century to fix it now, rather than experts overseen by democratic politicians, makes such a plan likely to fail. And even if it succeeds to some extent, that might make the logical larger goal — a pluralistic economy and society, a democratic political system, cooperative relationships with South American and Caribbean neighbors — harder to achieve. Juul’s skepticism has a pretty strong foundation.

FURTHER READING

PPI’s four principles for response to tariffs and economic isolationism:

  • Defend the Constitution and oppose rule by decree;
  • Connect tariff policy to growth, work, prices and family budgets, and living standards;
  • Stand by America’s neighbors and allies;
  • Offer a positive alternative.

Venezuela readings, chronological order:

Irish journalist Rory Carroll’s Comandante (2014) examines the Chavez years.

Exiled Venezuelan writer Karina Sainz Borgo’s It Would Be Night in Caracas (2021) has a fictionalized look at Maduro-era life in the capital.

The Journal of Democracy on election thefts in 2013 and 2024.

… and some advice on next steps from exiled academic Juan Miguel Mathews.

Nobel Laureate Maria Corina Machado’s December Nobel Prize lecture.

And PPI’s National Security Director Peter Juul assesses this month’s raid and its likely consequences.

Energy:

PPI’s Energy and Climate Solutions Initiative, featuring Managing Director Neel Brown and Energy and Climate Policy Director Elan Sykes, has energy policy and climate ideas for the United States.

OPEC’s Annual Statistical Bulletins have country-by-country data on reserves, production, trade, refining, operating rigs, etc., from 1999 through 2025.

… or direct to the 2025 edition.

The U.S. Energy Information Administration’s review of the Venezuelan energy sector.

And some jargon explained:

The Energy Information Administration walks you through “light,” “heavy,” “sour,” and “sweet.” 

Why does oil come in “barrels”? The Engineering and Technology History Wiki has the background. TL/DR: Early drillers in 19th-century Pennsylvania did in fact store their oil in 42-gallon wooden barrels. The U.S. Geological Survey and the Bureau of Mines adopted this as a standard measurement in 1882, and despite logic, the metric system, and real-world use of tankers and pipelines rather than “barrels” to move petroleum, it’s been barrels ever since.

ABOUT ED

Ed Gresser is Vice President and Director for Trade and Global Markets at PPI.

Ed returns to PPI after working for the think tank from 2001-2011. He most recently served as the Assistant U.S. Trade Representative for Trade Policy and Economics at the Office of the United States Trade Representative (USTR). In this position, he led USTR’s economic research unit from 2015-2021, and chaired the 21-agency Trade Policy Staff Committee.

Ed began his career on Capitol Hill before serving USTR as Policy Advisor to USTR Charlene Barshefsky from 1998 to 2001. He then led PPI’s Trade and Global Markets Project from 2001 to 2011. After PPI, he co-founded and directed the independent think tank ProgressiveEconomy until rejoining USTR in 2015. In 2013, the Washington International Trade Association presented him with its Lighthouse Award, awarded annually to an individual or group for significant contributions to trade policy.

Ed is the author of Freedom from Want: American Liberalism and the Global Economy (2007). He has published in a variety of journals and newspapers, and his research has been cited by leading academics and international organizations including the WTO, World Bank, and International Monetary Fund. He is a graduate of Stanford University and holds a Master’s Degree in International Affairs from Columbia Universities and a certificate from the Averell Harriman Institute for Advanced Study of the Soviet Union.

Read the full email and sign up for the Trade Fact of the Week.

The Trump administration is not protecting freedom of speech

FACT: The Trump administration is not protecting freedom of speech.

THE NUMBERS: Some people denied U.S. visas –

People Year
Thierry Breton,Anna-Lena von Hollenberg, Josephine Ballon, Clare Melford, Imran Ahmed   December 2025
Wole Soyinka       October 2025
Patricia Lara 1986
Dario Fo 1980
John Lennon 1972
Gabriel Garcia Marquez 1971
Miriam Makeba 1968
Carlos Fuentes 1962
Charles Chaplin 1950
Pablo Neruda 1946

WHAT THEY MEAN: 

Thomas Jefferson’s Second Inaugural calls for confidence in truth, the weakness of error and deceit, and the public’s capacity to reason — given freedom of speech — from facts informed by principles to a correct judgment:

“Since truth and reason have maintained their ground against false opinions in league with false facts … the public judgment will correct false reasonings and opinions on a full hearing of all parties.”

In this age of troll farmsprogrammed bots“influencers” subsidized by unfriendly powers, and other disinformation ops, sticking with Jefferson’s idealism takes nerve. The Trump administration hasn’t got it:  Over the holidays, its State Department banned five citizens of U.S. allies — a former EU Commissioner and four digital-monitor NGO officers — from entering the United States, based essentially on claims that they talk too much and say unwelcome things. A rundown, then some thoughts:

France: Thierry Breton, the former EU Commissioner for the Internal Market, because in 2024 he “ominously reminded [Twitter owner] Elon Musk of @X’s legal obligations” under the European Union’s Digital Services Act.

United KingdomClare Melford of Global Disinformation Index, apparently for involvement in Canadian controversies over Native American residential schools. Imran Ahmed of the Center for Countering Digital Hate gets a flag too, as a “key collaborator with the Biden administration’s effort [ed. note: non-existent] to weaponize the government against U.S. citizens,” for example, by publishing a list of 12 prominent anti-vaccine sites and their leaders, one of whom now has a Trump admin. job.

GermanyAnna-Lena von Hollenberg and Josephine Ballon of HateAid, a “digital watchdog” NGO based in Berlin, both of whom “cited threat of ‘disinformation’ from ‘right-wing extremists online’” and “support the U.K.’s Online Safety Act and EU’s Digital Services Act.”

In sum: An ex-EU official reminds a company of legal obligations (even if the law in question, in the PPI view, isn’t a very good one); an NGO works in good faith with a U.S. administration to identify and publicize disinformation ops; another lists anti-vaxx groups; a third gets involved in intra-Canadian disputes. The Department says that these (a) amount to an effort to “coerce U.S. platforms to censor, demonetize, and suppress American viewpoints”, and that (b) the five individuals’ “entry, presence, or activities in the United States” therefore “have potentially serious adverse foreign policy consequences [ed. note: none specified] for the United States,” (c) making the visa bans a way to “combat” a “global censorship-industrial complex.”

What to say about this? The Trump administration isn’t in general much of a free-speech defender. At home, the White House, the Federal Communications Commission, the Departments of Justice, Education, Defense, etc., and other agencies all frequently threaten to withdraw U.S. media companies’ broadcast licenses for unfavorable press coverage, accuse Members of Congress of “sedition” for the obviously correct statement that American soldiers must refuse illegal orders, sue overseas journalists, try to micro-manage university curricula, etc. Looking abroad, December’s visa decisions are more in a series of decisions meant to show petulance and hostility toward America’s European allies, but the Europeans aren’t the only targets. A few weeks earlier in October, the administration reanimated a particularly unfortunate Cold War policy — keeping artists and writers with inconvenient or objectionable opinions out of the U.S. — by canceling the visa of 91-year-old Nigerian Nobelist Wole Soyinka, apparently to express resentment for Soyinka’s unflattering comparison of Mr. Trump to the late Ugandan president Idi Amin.

None of this, of course, means that NGO critiques of U.S. platforms are always right, nor that the administration is invariably wrong. But the U.S. and the European democracies are certainly targets of disinformation campaigns. Governments ought to be cooperating to expose and counter them, and it’s good that British and German NGOs are trying – very much in Jefferson’s spirit of trying to provide the public a “full hearing” – to identify and publicize their origins and objectives.  They sometimes do miss, and they may at times wrongly blame ‘platforms’ for larger policy problems.  But the appropriate response is to provide accurate facts and let the public decide, not try to stop Americans from hearing them.  And as to “serious adverse foreign policy consequences,” that looks like just blather.  The administration’s real complaint seems to be about the expression of opinions and factual points that it, or some of its friends, dislikes hearing. In any such case, Jefferson remains the right guide.

FURTHER READING

PPI’s four principles for response to tariffs and economic isolationism:

  • Defend the Constitution and oppose rule by decree;
  • Connect tariff policy to growth, work, prices and family budgets, and living standards;
  • Stand by America’s neighbors and allies;
  • Offer a positive alternative.

Sec. Rubio announces visa bans, claims to be battling a “global censorship-industrial complex.”

… and Undersecretary of State Rogers tries to explain the particulars.

From the Monticello Foundation, Jefferson’s view that the truth is strong enough to defend itself.

… and the full Second Inaugural text.

More:

M. Breton’s European Commission bio.

… and a comment from Le Monde.

Homepages for HateAid, the Center for Countering Digital Hate, and the Global Disinformation Index.

“First as tragedy, then as farce”:

Then:

The Cold War-era visa denials, in contrast to the contemporary Soyinka case, usually at least reflected some sort of dispute over state policy or ideology, though in retrospect (and to lots of people at the time) they didn’t reflect well on the U.S. government. Typical examples: John Lennon for anti-war activism, Miriam Makeba for involvement in the U.S. “Black Power” movement, Gabriel García Márquez for sympathy for left-wing revolutionary movements, and Dario Fo for philosophical anarchism.

NPR looks back at the Nixon administration’s unsuccessful attempt to expel Lennon.

American Theater comments on the Dario Fo case.

Now:

The BBC and Nigeria’s National Post on Soyinka’s contemporary visa denial.

… for context, Uganda’s official Idi Amin bio.

… and a topical book rec. — Soyinka’s The Burden of Memory, the Muse of Forgiveness (2000) reflects on African politics, relations with the United States and the diaspora, human rights, and reconciliation.

ABOUT ED

Ed Gresser is Vice President and Director for Trade and Global Markets at PPI.

Ed returns to PPI after working for the think tank from 2001-2011. He most recently served as the Assistant U.S. Trade Representative for Trade Policy and Economics at the Office of the United States Trade Representative (USTR). In this position, he led USTR’s economic research unit from 2015-2021, and chaired the 21-agency Trade Policy Staff Committee.

Ed began his career on Capitol Hill before serving USTR as Policy Advisor to USTR Charlene Barshefsky from 1998 to 2001. He then led PPI’s Trade and Global Markets Project from 2001 to 2011. After PPI, he co-founded and directed the independent think tank ProgressiveEconomy until rejoining USTR in 2015. In 2013, the Washington International Trade Association presented him with its Lighthouse Award, awarded annually to an individual or group for significant contributions to trade policy.

Ed is the author of Freedom from Want: American Liberalism and the Global Economy (2007). He has published in a variety of journals and newspapers, and his research has been cited by leading academics and international organizations including the WTO, World Bank, and International Monetary Fund. He is a graduate of Stanford University and holds a Master’s Degree in International Affairs from Columbia Universities and a certificate from the Averell Harriman Institute for Advanced Study of the Soviet Union.

Read the full email and sign up for the Trade Fact of the Week.

Tariff bill on toys and Christmas ornaments up 300-fold this year

FACT: Tariff bill on toys and Christmas ornaments are up 300-fold this year, from $7 million to $2 billion.

THE NUMBERS: U.S. tariff collection, January-September* –

Product        2024               2025
Toys and dolls     $0 million $1,509 million
Video game consoles     $0 million    $448 million
Christmas ornaments     $7 million    $446 million
Other Christmas decorations     $0 million      $66 million
Nativity scenes     $0 million        $8 million
Sports equipment $309 million    $993 million
Musical instruments   $62 million    $144 million
Cards and magic tricks     $0 million      $38 million

* Most recent data available. About a third of toy imports arrive in October, November, and December, so the final 2025 totals will likely approach $2 billion for toys, $0.7 billion for ornaments, Nativity scenes, and other decorations, and $0.7 billion for video game consoles and accessories.

WHAT THEY MEAN: 

Having squeezed down the chimney, the Grinch pokes his head out of the fireplace and looks around:

“‘These stockings,’ he grinned, ‘are the first things to go!’
Then he slithered and slunk, with a smile most unpleasant,
Around the whole room, and he took every present!
Pop guns! And bicycles! Roller skates! Drums!
Checkerboards! Tricycles! Popcorn! And plums!
And he stuffed them in bags. Then the Grinch, very nimbly,
Stuffed all the bags, one by one, up the chimney!”

Then he takes all the food in the house and steals Cindy Lou’s tree.

The Trump administration’s comparably weird idea for a de facto two-doll-per-girl rationing system hasn’t entirely panned out. It hasn’t wholly failed, though. With tariffs higher and prices rising, Americans are spending less on Christmas gifts this year than last, and getting less for the money they do spend.

The National Retail Federation’s mid-October estimate notes that “tariffs remain on top of mind for most holiday shoppers, with 85% anticipating higher prices because of tariffs”. They predicted that the average American household would spend $890 on holiday gifts this winter, which would be a $12 drop from 2024’s $902, and adjusting for this year’s higher prices, a real-dollar drop of about 3%, to $863. Coincidentally or not, as PPI’s Fiscal Policy Analyst Alex Kilander points out this week, the 3% real-spending drop almost perfectly matches the BLS’s Consumer Price Index estimate of a 3% rise in toy prices this year.

NRF’s 85% aren’t wrong to worry. Census figures on tariffs are complete only through September, so they haven’t yet tallied the bill for holiday-season shipments in October and November. But even the January-to-September figures already show a hike in the toy-tariff bill from nothing in 2024 to $1.5 billion this year. Video-game consoles got a similar $0 to $448 million hike. Tariff collection jumped 80-fold on Christmas tree ornaments and other decorations — $7 million last year, more than half a billion dollars this year — and rose by $8 million even on creches and Nativity scenes.

In effect, rather than swiping the presents and throwing them off a mountain, the Trump team is heavily taxing them. (U.S. Supreme Court, 1819: “The power to tax involves the power to destroy”.) We can’t precisely line up the administration’s tariff bill with the Grinch’s raid on Whoville, because the Harmonized Tariff Schedule metaphorically stuffs all toys, dolls, tricycles, balloons, and so forth into a single bag (HTS line 95030000). But we can do a pretty close match, starting in the same way with the stockings:

PRODUCT 2024 TARIFFS 2025 TARIFFS
Socks & other hosiery      $225 million      $441 million
Toys, dolls, etc         $0 million   $1,509 million
Bicycles      $109 million      $159 million
Roller skates          $0 million          $5 million
Drums          $4 million          $7 million
Board games          $0 million        $59 million
Popcorn          $0.01 million           $0.2 million
Plums (fresh)          $0 million           $0.5 million
Plums (preserved/sugared)          $0.4 million           $0.6 million


So buyers of children’s gifts like tricycles and popguns (both in the toy group, along with the dolls) have taken a big financial hit. Bicyclists and gamers — traditionalist board aficionados and video and digital enthusiasts alike — only slightly less. The tariff impact on drums and roller skates is a bit less dramatic, in the seven-digit “millions” of dollars rather than the nine-digit “hundreds of millions.” Popcorn mostly comes from U.S.-grown corn and doesn’t attract many tariffs. Imported plums (mainly from South America) usually arrive between January and April, so most of the 2025 shipments got through Customs before the tariff decrees hit. As to your tree, no data yet. The administration’s lumber-tariff decree only went live at the end of September, so we don’t yet know how big the extra bill will be.

The Whos, of course, make the best of an unfortunate situation and go out for their sunrise caroling anyway. American parents, couples, and friends next week will probably do likewise.  But it shouldn’t have to be this way. Congress has all the power it needs to put a stop to this sort of thing, if it wants to, before the 2026 holidays.

Special note: PPI trade staff will be on holiday through the New Year. Our Trade Fact service will accordingly take a two-week break and resume on January 7. We wish PPI’s friends and readers, at home and abroad, a peaceful and happy holiday season

FURTHER READING

Dr. Seuss’s The Grinch Who Stole Christmas.

The White House press office elaborates on Mr. Trump’s doll-rationing idea. So far, they haven’t hinted at things boys should give up, but there’s still a week left.

And PPI’s Alex Kilander and Nate Morris on Trump administration economic policy, tariffs, and their impact on Christmas.

Outlook and prices:

The National Retail Federation’s 2025 holiday survey (out October 16th).

Data:

The New York-based Toy Association reports that Americans spend about $28 billion a year on toys, exactly a quarter of the $112 billion world market. This figure appears to combine some of the relevant tariff codes (toys as such get one 4-digit line, electronics another, sports equipment a third), so the tariff-to-product match is a little awkward.

The Bureau of Labor Statistics’ CPI inflation calculator.

… and the Federal Reserve’s “FRED” service has 40 years of Consumer Price Index toy data.

ABOUT ED

Ed Gresser is Vice President and Director for Trade and Global Markets at PPI.

Ed returns to PPI after working for the think tank from 2001-2011. He most recently served as the Assistant U.S. Trade Representative for Trade Policy and Economics at the Office of the United States Trade Representative (USTR). In this position, he led USTR’s economic research unit from 2015-2021, and chaired the 21-agency Trade Policy Staff Committee.

Ed began his career on Capitol Hill before serving USTR as Policy Advisor to USTR Charlene Barshefsky from 1998 to 2001. He then led PPI’s Trade and Global Markets Project from 2001 to 2011. After PPI, he co-founded and directed the independent think tank ProgressiveEconomy until rejoining USTR in 2015. In 2013, the Washington International Trade Association presented him with its Lighthouse Award, awarded annually to an individual or group for significant contributions to trade policy.

Ed is the author of Freedom from Want: American Liberalism and the Global Economy (2007). He has published in a variety of journals and newspapers, and his research has been cited by leading academics and international organizations including the WTO, World Bank, and International Monetary Fund. He is a graduate of Stanford University and holds a Master’s Degree in International Affairs from Columbia Universities and a certificate from the Averell Harriman Institute for Advanced Study of the Soviet Union.
Read the full email and sign up for the Trade Fact of the Week.


Worldwide HIV/AIDS mortality down 80% since PEPFAR launch

FACT: Worldwide HIV/AIDS mortality down 80% since PEPFAR launch.

THE NUMBERS: Eswatini life expectancy at birth –

2023 64
2022 63
2020 60
2015 55
2010 48
2005 44
1989 62

WHAT THEY MEAN: 

On this year’s World AIDS Day: The principal U.S. support program — the “President’s Emergency Plan for AIDS Relief,” or PEPFAR, for short — is a success story with an uncertain future. As a point of entry, here’s one of the countries the HIV/AIDS pandemic hit hardest:

Eswatini is a small inland kingdom of 1.3 million people bordering South Africa and Mozambique. Its HIV-positive rate, 23.4% of adults, is the world’s highest. In the early 2000s, Swazi health officers were counting 11,000 AIDS deaths a year — one in every hundred people – and reported a drop in life expectancy at birth from 62 years to 42. A grim point of comparison suggests how extreme that is: Chinese life expectancy at birth appears to have fallen by 1.5 years during World War II, and by six months during the Great Leap Forward/Cultural Revolution decade from 1959 to 1969.

Pulling back: In the early 2000s, about 40 million people were HIV-positive — 2 million in the United States and other “developed” countries, 25 million in sub-Saharan Africa, 7 million in South and Southeast Asia, 2.1 million in Latin America and the Caribbean, 4 million elsewhere around the world. Over 3 million died annually. UNAIDS’ 2005 report is a reminder:

“Acquired Immunodeficiency Syndrome (AIDS) has killed more than 25 million people since it was first recognized in 1981, making it one of the most destructive epidemics in recorded history. Despite recent, improved access to antiretroviral treatment and care in many regions of the world, the AIDS epidemic claimed 3.1 million [2.8–3.6 million] lives in 2005; more than half a million (570 000) were children. The total number of people living with the human immunodeficiency virus (HIV) reached its highest level: an estimated 40.3 million [36.7–45.3 million] people are now living with HIV. Close to 5 million people were newly infected with the virus in 2005.”

Governments and charities attempting to respond in lower-income countries were trying to manage multiple large challenges, each of which made all the others harder to solve:

  • Low patient awareness. Most HIV-positive adults in developing countries were untested and unaware of their status.
  • Medicine scarcity: Antiretroviral triple-drug therapy was launched only in the late 1990s, and availability worldwide was very limited.
  • Difficulty delivering care when patients were aware and medicines available: Millions of potential patients lived in rural areas and large city slums with few clinics and fewer trained nurses and doctors.
  • Finance: Most developing-country health ministries are small and lack the money to meet any one of these practical challenges, let alone all of them at once.

PEPFAR, which the second Bush administration launched in 2003, and the following administrations continued through 2024, has been the U.S.’s big response. Its various national accounts — prevention and education, testing, medicine, orphan and dependent care — and contributions to the Global Fund and UNAIDS combined for just under $7 billion per year during the Biden administration. This was about a third of the world’s $22 billion in total HIV/AIDS support. Taken as a whole, it aimed to support education, make testing widely available, provide large volumes of medicine, and train staff in delivery and care. Run by seven agencies headed by the Global AIDS Coordinator at the State Department, but mainly administered by professional staff and contractors at USAID and the Centers for Disease Control, PEPFAR programs were operating in 120 countries this past January, providing anti-retroviral medicines to 20.1 million people, care and shelter for 7 million orphans, and “PrEP” preventative treatment for 1.5 million people.

Since the launch, treatment has spread to reach nearly 32 million of the 41 million people now believed HIV-positive worldwide. Annual new infection estimates have dropped from 3.4 million to about 1.3 million a year. And mortality is down from the 3 million annual deaths of the early 2000s to about 630,000 per year now. In sum, over its two decades, PEPFAR has earned a plausible claim to the mantle of the postwar Marshall Plan: an ambitious concept on a global scale, efficient practical implementation, and commitment to the common good.

This year, the Trump administration shut down the main PEPFAR administrator, the U.S. Agency for International Development. According to the U.S. government’s aid tallies, American support for global health aid fell from $13.2 billion in FY 2024 to $4.7 billion in 2025. The administration did, though, promise to preserve PEPFAR by shifting program management to the State Department. This has, in fact, happened, though with lots of transitional damage — fired contractors, lost human talent, interrupted care — over the spring and summer, with consequences such as loss of PrEP access for 2.5 million people worldwide, closed clinics in Zimbabwe, and doubling counts of secondary mpox infections in Kenya. Taking into account the much larger drop in U.S. support for health and humanitarian relief, the Gates Foundation predicts a rise in childhood deaths of about 200,000 in 2025. Looking to 2026, the administration’s September strangely titled “America First Global Health Strategy” proposes to continue PEPFAR programs but cut U.S. government spending on them by about $1.7 billion, while asking beneficiary countries to contribute more to close the resulting gaps.

Returning to Eswatini, where U.S. health support has dropped from $75 million in 2024 to $19 million this year: The pandemic is far from over. But measured both by health policy criteria and by real-world results, as of 2024, Eswatini was meeting its main challenges. A 2023 national survey showed 94% of adults with HIV were aware of their status; 97% of them were using antiretroviral medicines, and virus suppression was achieved in 96% of antiretroviral patients. More generally, (a) HIV-positivity rates have dropped from the 29.4% peak in the mid-2010s to this year’s 23.4%; (b) 213,000 Swazi were taking antiretrovirals, as against 500 in 2005; (c) 20,000 are testing each month; (d) AIDS mortality has dropped by 75%, from the 11,000 deaths per year of the early 2000s to 2,600 last year; and (e) national life expectancy in 2023 for the first time exceeded pre-HIV pandemic rates and continues to rise. And two weeks ago, residual PEPFAR money helped add a new treatment — lenacapavir, a twice-yearly injection medicine — to Eswatini’s health program.

On this World AIDS Day, the President’s Emergency Plan for AIDS Relief has accomplished an astonishing amount of good in its first two decades. PEPFAR authors and the U.S. aid staff who ran the programs should take great pride in their contribution to this 80% drop in mortality. It isn’t finished, and 630,000 deaths is still a very large number. Congress shouldn’t let it stop before it’s done.

FURTHER READING

U.S. government HIV/AIDS page.

… and the PEPFAR site.

Then and now:

UNAIDS’ grim December 2005 report.

And the 2025 edition, noting past progress, the impacts of the closure of USAID, and the risks of declining future support.

Data:

KFF (formerly Kaiser Permanente Foundation) summarizes PEPFAR goals and results.

The World Bank has published HIV/AIDS prevalence rates by country since 1990.

The U.S. government’s PEPFAR data site has numbers. As of today, they’re frozen and given an unsettling asterisk: “data.pepfar.gov is currently undergoing updates and will return soon with refreshed data and interactive dashboards.”

Foreignassistance.gov reports health, humanitarian relief, democracy, food aid, and other U.S. aid spending by country.

PPI on USAID, the 100-year American humanitarian aid tradition, and the Trump administration’s folly.

Eswatini:

2025 status report from the Health Ministry.

report from the Global Fund.

Updates from the UNAIDS office in Mbabane.

Trump administration and PEPFAR:

The administration’s global health strategy document.

KFF’s analysis.

A mixed assessment from the George W. Bush Presidential Center.

more critical look — “Tough Times, Tough Choices” — from the Center for Global Development.

And the Gates Foundation fears a rise of 200,000 in childhood deaths.

ABOUT ED

Ed Gresser is Vice President and Director for Trade and Global Markets at PPI.

Ed returns to PPI after working for the think tank from 2001-2011. He most recently served as the Assistant U.S. Trade Representative for Trade Policy and Economics at the Office of the United States Trade Representative (USTR). In this position, he led USTR’s economic research unit from 2015-2021, and chaired the 21-agency Trade Policy Staff Committee.

Ed began his career on Capitol Hill before serving USTR as Policy Advisor to USTR Charlene Barshefsky from 1998 to 2001. He then led PPI’s Trade and Global Markets Project from 2001 to 2011. After PPI, he co-founded and directed the independent think tank ProgressiveEconomy until rejoining USTR in 2015. In 2013, the Washington International Trade Association presented him with its Lighthouse Award, awarded annually to an individual or group for significant contributions to trade policy.

Ed is the author of Freedom from Want: American Liberalism and the Global Economy (2007). He has published in a variety of journals and newspapers, and his research has been cited by leading academics and international organizations including the WTO, World Bank, and International Monetary Fund. He is a graduate of Stanford University and holds a Master’s Degree in International Affairs from Columbia Universities and a certificate from the Averell Harriman Institute for Advanced Study of the Soviet Union.

Read the full email and sign up for the Trade Fact of the Week.

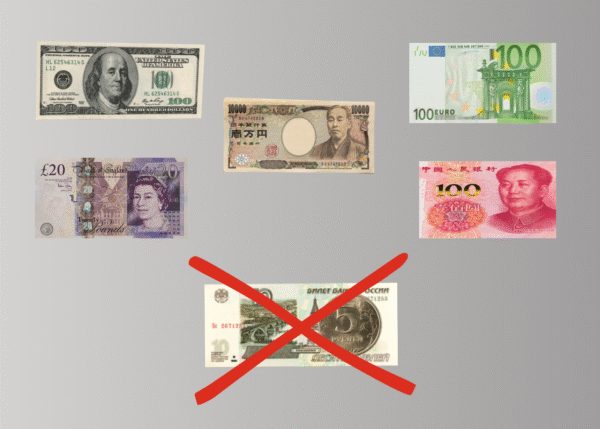
Foreign exchange trading in rubles is down by 96%

FACT: Foreign exchange trading in rubles is down by 96%.

THE NUMBERS: Daily currency exchange* —

             2019              2025 Change
All currencies   $6.58 trillion   $9.60 trillion    +45%
Dollar   $5.81 trillion   $8.56 trillion    +47%
Euro   $2.13 trillion   $2.77 trillion    +30%
Yen   $1.11 trillion   $1.61 trillion    +45%
Renminbi   $0.29 trillion   $0.82 trillion  +187%
Pound   $0.84 trillion   $0.98 trillion    +16%
Ruble   $0.07 trillion   $0.003 trillion     -96%

* Bank of International Settlements 2025 Triennial Central Bank Survey of Foreign Exchange

WHAT THEY MEAN: 

Every three years, the Bank of International Settlements in Basel guesses at how much money currency traders – government ministries and central banks, firms buying and selling across borders, tourists, computerized hedge-fund trading programs — exchange in a day. Their 2025 “Triennial Central Bank Survey of Foreign Exchange,” out in September, reports $9.6 trillion (combining sellers’ earnings with buyers’ payments). Over a full year that comes to almost exactly $3.5 quadrillion. A few particulars:

Dollar role little changed: U.S. dollars figured in 89.2% of the world’s currency exchanges this spring.  This figure has been stable throughout the 21st century, as earlier Triennial Surveys found dollars used in 88.6% of all currency transactions in 2022, a slightly lower 84.9% in financial crisis-plagued 2010, and 89.9% in 2001. Looking at other currencies, the Survey gives some substance to financial-press speculation about the Chinese renminbi’s rising role: renminbi showed up in 2% of currency exchanges in 2013, 4% in 2019, and 7% in 2025. The euro, yen, and pound shares have meanwhile dipped a bit, with euros down from 39% of transactions in 2013 to 31% in 2025, yen from 23% to 17%, and sterling from 13% to 10%.

U.K. the forex center: City of London banks and firms handle 38% of all world currency trades, or about $1 quadrillion worth each year. As context for a twelve-zero number like this — $1,000,000,000,000,000 — “world GDP” is about $120 trillion, so London’s quadrillion in forex turnover is about 10 times the size of the ‘real’ goods and services world economy. New York ranks second with 19%, while Asia’s three big currency trading centers — Singapore, Hong Kong, and Tokyo — have 12%, 7%, and 4% respectively, or 23% combined. Most exchange of major currencies basically track this division of labor, but renminbi trading is a little unusual; it isn’t concentrated in any one place, but instead is roughly evenly divided between London, Hong Kong, Shanghai, Singapore, and New York.

Collapse of ruble trading: The survey’s calculations, which show 39 individual currencies as well as worldwide totals, typically show trading levels in any particular currency rising over time, though at different rates. One bright-red exception: under the weight of international sanctions — for example, U.S., UK, EU, and Japanese prohibitions on transactions with the Russian central bank, purchasing of ruble-denominated bonds, and lending to Russian financial institutions — along with Russia’s own currency restrictions, trading in Russian rubles has plunged by 96% since the full-scale invasion of Ukraine in early 2022.

The actual numbers here: the $72 billion in daily ruble trading in 2019 fell to $13 billion in 2022, and to $3 billion in 2025. As a point of comparison, this $3 billion is just above the $1 billion in daily trading in Argentine pesos and a notch below the $4 billion in Bulgarian lev exchange. By market, ruble trading is down 95% in Singapore, 96.5% in London, 99% in New York, 99.4% in Hong Kong, and 99.9% in Zurich. Those wishing to dispose of rubles do, though, have one notable refuge: ruble trading has grown about 100-fold in the United Arab Emirates — $18 million in 2019, $2.7 billion in 2025 — which now does almost two-thirds of all world ruble trading.

FURTHER READING

BIS’ 2025 Triennial Survey of the $3.5 quadrillion annual, $9.6 trillion daily, world foreign exchange market.

Regulators and sanctions:

The U.K.’s Financial Conduct Authority regulates the City of London, the world’s largest currency-exchange center.

Japan’s Finance Ministry imposes new Russia sanctions.

sanctions brief from the European Council.

And the U.S. Treasury Department monitors dollar exchange rates and explains sanctions on ruble-trading.

And some comparisons:

Then and now: A generation ago, in the last days of the managed-exchange-rate “Bretton Woods System,” currency turnover was a comparatively modest $6 trillion a year, mostly facilitating tourism, debt repayments, and import/export trade. The “floating exchange,” which replaced Bretton Woods, launched in March 1973, has since become the largest market of any sort in human history. The BiS estimates, converted from their “daily turnover” headlines to the annual totals:

2025 $3.502 quadrillion
2022 $2.726 quadrillion
2019 $2.402 quadrillion
2016 $1.849 quadrillion
2010 $1.450 quadrillion
2001 $0.452 quadrillion
1992 $0.298 quadrillion
1970 $0.006 quadrillion

“All the money in the world”: Dividing BiS’s double-entry forex totals in half to make them comparable to trade flows, wealth held in banks and securities, etc., currency trading matches up against world GDP, privately held wealth, circulating money, and goods-services trade like this:

Currency exchange, 2025 $1,750 trillion
Total privately held wealth, 2024  ~$475 trillion
World GDP, 2025    $117 trillion
All physical money in banks, bills, & coins      $50 trillion
All goods/service trade, 2024      $33 trillion
All circulating bills and coins      ~$8 trillion

The WTO’s trade statistics dashboard shows trade in goods at $24.4 trillion last year, and trade in services $8.6 trillion.

The IMF’s World Economic Outlook database has the total global GDP at $117 trillion this year, with the U.S. contributing $30.6 trillion, China $19.4 trillion, the EU $21.2 trillion, Japan $4.3 trillion, the U.K. $4.0 trillion, and all other countries $36 trillion.

UBS’s 2025 Global Wealth Report reviews economic data from 56 countries and territories,* which they believe hold about 92% of all privately held world wealth. (I.e., the value of homes and properties, stocks and bonds, bank deposits, etc., excluding government assets.) They place this total at about $475 trillion, so adding the other 8% would yield a world wealth total of about $515 trillion.

ABOUT ED

Ed Gresser is Vice President and Director for Trade and Global Markets at PPI.

Ed returns to PPI after working for the think tank from 2001-2011. He most recently served as the Assistant U.S. Trade Representative for Trade Policy and Economics at the Office of the United States Trade Representative (USTR). In this position, he led USTR’s economic research unit from 2015-2021, and chaired the 21-agency Trade Policy Staff Committee.

Ed began his career on Capitol Hill before serving USTR as Policy Advisor to USTR Charlene Barshefsky from 1998 to 2001. He then led PPI’s Trade and Global Markets Project from 2001 to 2011. After PPI, he co-founded and directed the independent think tank ProgressiveEconomy until rejoining USTR in 2015. In 2013, the Washington International Trade Association presented him with its Lighthouse Award, awarded annually to an individual or group for significant contributions to trade policy.

Ed is the author of Freedom from Want: American Liberalism and the Global Economy (2007). He has published in a variety of journals and newspapers, and his research has been cited by leading academics and international organizations including the WTO, World Bank, and International Monetary Fund. He is a graduate of Stanford University and holds a Master’s Degree in International Affairs from Columbia Universities and a certificate from the Averell Harriman Institute for Advanced Study of the Soviet Union.

Read the full email and sign up for the Trade Fact of the Week.

Testimony: USMCA is Not Broken, Doesn’t Need Major Changes

Hearing on Operation of the USMCA (December 3, 2025)

Thank you very much for this opportunity to testify this morning, as the U.S. Trade Representative Office considers the functioning of the U.S.-Mexico-Canada Agreement over the past six years in preparation for next July’s scheduled “review.”

By way of introduction, I am Vice President of the Progressive Policy Institute (PPI) in Washington, D.C., a 501(c)(3) nonprofit research institution established in 1989, which publishes a wide range of public policy topics. In this position, I oversee PPI’s research and publications on trade and global economy matters. Before joining PPI, I served at USTR from 2015 to 2021 as Assistant U.S. Trade Representative for Trade Policy and Economics, with responsibility for overseeing USTR’s economic research and use of trade data, interagency policy coordination, including chairing the interagency Trade Policy Staff Committee, and administration of the Generalized System of Preferences.

The U.S.-Mexico-Canada Agreement, successor to the North American Free Trade Agreement, has been in force since July 1, 2020. As approved by Congress in 2019, its Final Provisions chapter includes a clause directing the U.S., Mexican, and Canadian governments to conduct a “review” after six years — that is, by July 2026 — and decide whether changes to the Agreement might be useful.

Our core view is that USMCA is working reasonably well. It is a very large agreement, spanning many different industries and applying to nearly $2 trillion in U.S. goods and services trade. And like any large human creation, USMCA is by definition imperfect. But it is accomplishing its main goals — facilitating trade in agriculture, services, energy, and manufacturing, helping digital trade channels stay open, encouraging joint work on wildlife trafficking and ocean health, providing Americans with reliable and low-cost consumer goods and industrial supplies, and experimenting with a novel approach to labor issues.

Meanwhile, and quite recently, very large problems unrelated to the agreement have emerged in U.S. trade, generally, and in relations with Canada and Mexico specifically. Since this past February, the Trump administration’s profligate imposition of tariffs, and accompanying threats against Canada and Mexico, have caused a series of genuine crises: damage to the Constitutional separation of powers; erosion of relationships at the core of U.S. national security; and a deteriorating economy as tariffs raise the cost of living for families, sap growth, and diminish the competitiveness of U.S. farming and manufacturing.

The Final Chapter “review” clause entails assessment rather than requiring any particular action. And while in different circumstances it might be useful to look in detail at ways to bring the agreement closer to perfection, in the actual circumstances of 2025 and 2026, policy vis-à-vis Mexico and Canada should focus on ending these self-created crises and mitigating their effects.

If the administration nonetheless wants to proceed with revisions to the agreement, our view is that such a program should come only after three steps:

  • Congressional passage of legislation terminating “emergency” and “national security” tariff decrees under laws like “IEEPA,” “Section 232,” and “Section 301” and requiring votes on any future Presidential imposition of tariffs (or other import limits) with some carefully circumscribed exceptions.
  • Stabilization of North American security by restoring trust, mutual respect, and common interest as the foundation of U.S. policy for America’s neighbors.
  • Restoration of Constitutionally appropriate policymaking, with Congress setting negotiating objectives for any significant changes in USMCA and voting to approve, or not, any resulting accord.

With these done, it would be appropriate, and might be useful, to look closely at the USMCA and see whether broad consensus exists for changes that would improve it. Absent them, we do not believe such a program is currently appropriate.

Read the full testimony.

Trump administration tariff increases through July 2025: $888 million on toys and dolls, $81 million on bananas, $71 million on tampons, $45 million on bandages

FACT: Through July 2025, tariffs up $888 million on toys and dolls, $81 million on bananas, $71 million on tampons, and $45 million on bandages.

THE NUMBERS: Tariff collection, 2024 vs. 2025* –


Jan. – July 2024 Jan. – July 2025
Total Tariff Collection   $43 billion $122 billion
… on cars    $1,968 million  $12,974 million
… on toys and dolls                      $0       $888 million
… on sports equipment       $243 million       $694 million
… on TV sets       $134 million       $500 million
… on coffee        $1.3 million       $359 million
… on tampons         $14 million         $85 million
… on bananas      $0.24 million         $81 million
… on wigs & hair extensions         $10 million         $66 million
… on Band-Aids & other bandages                      $0         $45 million

USITC Dataweb, most recent data available. As the Trump administration’s July 31st revision of its April 2nd tariff decree sharply increased tariff rates on many countries, the full-year increases will probably be much larger.

WHAT THEY MEAN: 

The late Emperor Napoleon Bonaparte began the Grand Army’s retreat from Moscow in the autumn of 1812 with a small symbolic gesture. He sent home 1,500 injured soldiers, presumably hoping that would calm Paris’ opinion while the other 100,000 stayed on. Trump administration officials are trying something similar. Having read the opinion polls and the election returns, they scrapped Mr. Trump’s tariffs on coffee and bananas last Friday. Here’s the Treasury Secretary, Scott Bessent, pitching the idea to a friendly TV outlet:

“You’re going to see substantial announcements over the next couple of days in terms of things we don’t grow here in the United States. Coffee being one of them, bananas, other fruits. Things like that. So that will bring the prices down very quickly.”

The actual list covers 238 tariff lines, including coffee and bananas, and adds beef, Chinese water chestnuts, cassava, taro root, cocoa beans, mangoes, and so on. What does this actually mean? The 238 lines together totaled $51.6 billion worth of imports in 2024. Tariff collection on these products, comparing January to July in 2024 to the same period this year, has jumped from $240 million to $1.72 billion. Bessent’s coffee and bananas illustrate how it works:

Bananas: The Congressionally authorized “MFN” tariff on bananas is zero, except for a 1.4% rate on dried bananas and chips. From January to July last year, CBP collected $0.24 million in tariffs on bananas. The $81 million through July this year — up 33,650% — mainly comes from new 10% tariffs on Guatemalan bananas, and 15% tariffs on bananas from Ecuador and Costa Rica. They brought $64 million, and 10% tariffs on Honduran, Colombian, and Peruvian varieties added $15 million more. As a legal/policy note, the Trump administration’s application of tariffs to these bunches overwrites the actual U.S. tariff system and breaches U.S. WTO commitments, and badly violates the U.S. FTAs with Central America, Colombia, and Peru.

Coffee: Coffee’s Congressionally authorized “MFN” tariff is zero, again with the small exception of a 1.5 cent/kilo tariff on “coffee substitutes containing coffee.” CBP’s coffee take is up $1.3 million in 2024 to $359 million in 2025, for a “28,170%” increase. As with bananas, the increase has hit Latin growers hardest. An initial 10% tariff on Brazilian coffee rose to 50% in July, out of pique over the prosecution of ex-president Yair Bolsonaro, and has brought $69 million. The 10% tariffs on Colombian and Guatemalan coffees brought $53 million and $36 million, respectively. The 20% tariff on Vietnamese coffee brought $13 million, the 10% on Ethiopian yirgacheffe $11 million, and the 19% on Indonesian Sumatra and kopi luwak $7 million.

The rise in banana and coffee tariffs is statistically striking — you don’t often get a chance to talk about 33,500% increases — and beef likewise. But the combined $1.7 billion is only a couple of pennies on the dollar, 2%, when placed against the $79 billion in overall cost increases the Trump administration’s tariff decrees entail. The biggest new costs so far are on industrial consumers — factories buying metal and parts, farmers buying fertilizer, construction sites, utilities, etc. — but the tariff increases in retail and household goods are striking too. Here’s a representative list, with some of Friday’s new exclusions in italics:

Jan. – July 2024 Jan. – July 2025
Total tariff collection  $43 billion  $122 billion
… on cars    $1,968 million   $12,974 million
… on shoes     $1,871 million     $3,227 million
… on toys and dolls                      $0        $888 million
… on sports equipment       $243 million        $694 million
… on beef       $135 million        $627 million
… on TV sets       $134 million        $500 million
… on coffee        $1.3 million        $359 million
… on makeup          $85 million        $301 million
… on vacuum cleaners         $90 million        $180 million
… on OTC medicines                       $0        $144 million
… on tampons         $14 million          $85 million
… on bananas      $0.24 million          $81 million
… on cocoa butter                       $0          $67 million
… on olive oil            $8 million          $66 million
… on wigs & hair extensions         $10 million          $66 million
… on personal computer keyboards                       $0          $48 million
… on bandaids & other bandages                       $0          $45 million
… on musical instruments          $19 million          $38 million
… on ginger, turmeric, & spices            $4 million          $17 million

In sum: The retreat on coffee, beef, and bananas, like Emperor Napoleon’s initial dispatch of a few wounded soldiers home, is in principle quite a large concession: the administration has abandoned its claims earlier this year that tariffs don’t raise prices, and that foreigners pay them anyway. In practice, though, it’s a cosmetic gesture rather than a solution. Mr. Trump’s tariff increase on tampons is about as big as the one on bananas, but (at least for now) the tampon tax is staying in place. The tariff hike on toys is twice as big as that of the banana and coffee tariffs put together, and that on shoes tariff increase alone offsets the entire 238-product exclusion list. And since tariffs got much higher in August and we don’t yet have post-July revenue figures, the actual totals now will be much higher.

In the Emperor’s case, the cosmetic gesture was a mistake. The invasion had failed, and the longer he waited to liquidate it, the worse things got. In the end, only 10,000 of his men made it home. There’s maybe a lesson there.

FURTHER READING

PPI’s four principles for response to tariffs and economic isolationism:

  • Defend the Constitution and oppose rule by decree;
  • Connect tariff policy to growth, work, prices and family budgets, and living standards;
  • Stand by America’s neighbors and allies;
  • Offer a positive alternative.

Napoleon retreats from Moscow.

Bessent on coffee and bananas.

PPI background:

PPI Trade Fact from August 21, 2024: Tariffs raise consumer prices. That’s what they’re supposed to do. It usually works. No surprises. Trust Alice, not the Queen.

Laura Duffy’s October 2024 “It’s Not 1789 Anymore: Why Trump’s Backward Tariff Agenda Would Hurt Americans,” explains why tariffs are a poor form of taxation: they can’t raise enough revenue, are opaque and regressive, causing downstream harms.

Tariff decrees:

The actual, Congressionally authorized, Harmonized Tariff Schedule of the United States.

The April 2 “international emergency” trade balance decree.

… the July 31 revision with current country-by-country rates.

… and last Friday’s November 14 re-revision excluding tropical agriculture, metal ores, etc.

The March 26 “national security” decree on cars and parts.

Tariff data:

USITC’s Dataweb has tariff revenue, import values, and more by product and country. Updated only through July 2025.

CBP breaks out FY 2025 tariff collection by decree, but not product and only a few countries; data through September.

ABOUT ED

Ed Gresser is Vice President and Director for Trade and Global Markets at PPI.

Ed returns to PPI after working for the think tank from 2001-2011. He most recently served as the Assistant U.S. Trade Representative for Trade Policy and Economics at the Office of the United States Trade Representative (USTR). In this position, he led USTR’s economic research unit from 2015-2021, and chaired the 21-agency Trade Policy Staff Committee.

Ed began his career on Capitol Hill before serving USTR as Policy Advisor to USTR Charlene Barshefsky from 1998 to 2001. He then led PPI’s Trade and Global Markets Project from 2001 to 2011. After PPI, he co-founded and directed the independent think tank ProgressiveEconomy until rejoining USTR in 2015. In 2013, the Washington International Trade Association presented him with its Lighthouse Award, awarded annually to an individual or group for significant contributions to trade policy.

Ed is the author of Freedom from Want: American Liberalism and the Global Economy (2007). He has published in a variety of journals and newspapers, and his research has been cited by leading academics and international organizations including the WTO, World Bank, and International Monetary Fund. He is a graduate of Stanford University and holds a Master’s Degree in International Affairs from Columbia Universities and a certificate from the Averell Harriman Institute for Advanced Study of the Soviet Union.

Read the full email and sign up for the Trade Fact of the Week.

Gresser in The Washington Post: Trump goes on defense over tariffs as prices on everyday items keep rising

Having effectively conceded that tariffs are contributing to high prices, the administration has opened the door to demands for further modifications in its strategy, said Ed Gresser, vice president at the Progressive Policy Institute in Washington.

U.S. importers this year have paid far more in tariffs on a wide range of consumer products, including automobiles, vacuum cleaners and makeup, Gresser said. Tariffs on imported coffee have cost Americans $358 million so far this year, up from $1.3 million last year, according to U.S. International Trade Commission data.

But tariffs on automobiles have cost more than 36 times as much — amounting to $13 billion.

“There is a heavy price for this policy, and families are paying a lot of it,” said Gresser, who was a trade official in the first Trump administration.

Read more in The Washington Post.

30% of all U.S. goods trade is with Canada and Mexico

FACT: 30% of all U.S. goods trade is with Canada and Mexico.

THE NUMBERS: Canadian and Mexican shares of U.S. goods exports* –

Native American-owned businesses 93%
Hispanic-owned businesses 46%
Farm exports 34%
All U.S. exporters 33%
African American-owned businesses 32%
Small businesses 28%

* 2024 or most recent year available. Census/BEA for exporters by race and ethnicity, Census for small businesses and total exports, and Commerce TradeStats Express for states. 

WHAT THEY MEAN: 

Next July, the U.S., Canadian, and Mexican governments are supposed to review their six years’  experience with the “U.S.-Mexico-Canada Agreement” that replaced the earlier North American Free Trade Agreement in 2020. Should they wish, they can suggest changes in it. Per a new Policy Memo today from PPI’s Ed Gresser, the “USMCA” is working reasonably well, and big revisions would be a mistake.

This year brought genuinely large crises in intra-North American security and trade, and in U.S. trade policy more generally. But the “USMCA” didn’t cause them – they’re the result of the Trump administration’s tariffs and threats against Canada and Mexico – and changing it won’t fix them. Congress should therefore confine any changes in USMCA to technical, consensus matters on which the three governments can easily agree, and focus the next year’s work on these larger matters.

Should the administration nonetheless want some more ambitious thing, Congress should insist on passage of legislation like Rep. Linda Sanchez’s HR 2888, terminating the administration’s “emergency” and “national security” decrees and requiring Congressional approval of any similar new tariffs, first.

Background and detail:

“USMCA” is the third-generation version of the North American integration policy launched in 1965 with the Lyndon Johnson-Lester Pearson “U.S.-Canada Agreement Concerning Automotive Products”. The Ronald Reagan-Brian Mulroney U.S.-Canada FTA in 1988, and its expansion to Mexico in 1993 with the North American Free Trade Agreement came a quarter-century later, and USMCA is the most recent version. As the Policy Memo says:

“Each step rested on the once-uncontroversial idea that it’s good strategy to have close and friendly relationships with one’s immediate neighbors. Pooling strengths can make everyone a bit better off, with more suppliers, more customers, and more common interests. Close relations among neighbors can make these common interests easier to realize, while making problems less explosive and easier to solve or mitigate. Contrariwise, in a tense and economically fragmented region, everyone is a bit worse off, common interests fade, and problems not only grow harder to solve but tend to multiply.”

USMCA maintained its predecessors’ tariff-free trade principle and added some new things: digital trade topics such as cross-border data flow and anti-spam policy; labor rules including a “rapid response” program examining allegations of failure to enforce labor laws in specific facilities; environmental issues including marine pollution, sustainable fisheries, and endangered species protection; a revised and much more restrictive “rule of origin” defining what it means for an automobile to be “made in” North America.

How is it working? Since 2020, Gresser’s Policy Memo observes, “real-world U.S./Canada/Mexico trade has grown rapidly, both in traditional goods and digitally deliverable services. The Biden administration used USMCA’s labor provisions heavily, with (for example) 32 “rapid response” cases. And until the second Trump administration took office last winter, the vast majority of goods and services flowed back and forth in easy and mutually beneficial ways.”

To put some numbers on this, trade with Canada and Mexico accounted for $1.6 trillion of the U.S.’s $5.3 trillion in worldwide international goods trade in 2024 — 30% — and $141 billion of $1.24 trillion in services trade. Canada and Mexico rank 1st and 2nd as buyers of American goods, and are overwhelmingly important as customers for Native American and Hispanic-owned exporters. As buyers of U.S. farm goods, they provide 7 cents in each dollar of American farm income. And typically, they buy anywhere from a fifth to nearly all of a given state’s exports. Samples:

State Canada/Mexico share of STATE exports*
North Dakota                                                              86%
New Mexico                                                              59%
Ohio                                                              53%
Maine                                                              46%
Wisconsin                                                              45%
Montana                                                              41%
Pennsylvania                                                              37%
Texas                                                              35%
Alabama                                                              33%
North Carolina                                                              32%
California                                                              29%
Nevada                                                              26%
Georgia                                                              26%
Rhode Island                                                              23%
Louisiana                                                              20%

* Goods trade only — i.e., manufacturing, agriculture, mining, scrap, small packages, etc. The U.S. government doesn’t collect services trade data by state.

In sum, it’s working pretty well. Whether over the past six years or the past sixty, patient work by the U.S., Canadian, and Mexican governments — based, to paraphrase Pearson in 1965, on “the mutual understanding, goodwill, and confidence which has grown up between our countries” — has accomplished a lot.

And where to now?  

Big human things are by definition imperfect; USMCA isn’t an exception, and in some idyllic world, it might be useful to attempt something a little closer to perfection. But even that world would have limits on what agreements like USMCA can achieve. The Trump administration’s focus on trade balances is particularly naive, since its first- and second-term tax and fiscal policy is the main reason U.S. trade deficits are higher. (From the Memo: “If the administration is seeking an explanation for the higher post-USMCA imbalances with Mexico and Canada, the best place to look is a mirror.”) And others, such as revising auto rules, may have complex and possibly unwelcome consequences — the stricter USMCA rules haven’t brought the surge of U.S. auto output the first Trump administration predicted, and even stricter rules could do more to raise costs than encourage investment — and would need close study.

And of course, we don’t now live in that idyllic world. Over the past 10 months, mutual understanding, goodwill, and confidence have steadily eroded in the aftermath of the Trump administration’s February tariff decrees targeting Canada and Mexico, its subsequent threats of more, and Mr. Trump’s inexplicable attacks on Canada. This has had economic consequences – both specific, such as the collapse of some U.S. exports (e.g. wine, beer, and spirits, down from $440 million last year to $190 million this year) as Canadians turn away from visibly “American” goods, rising unemployment in Las Vegas as tourism revenue falls, and worries about heating oil prices in New England this winter; and more systemic, as tariffs raise prices for American families and production costs for American factories and farms.  And these economic problems, in turn, may be modest next to the new and radically unfamiliar national security problems long-term mistrust, ill-will, and lost confidence with Canada and Mexico would create for the Americans of the 2030s and 2040s.

In these circumstances, and since next July’s review requires no action, the Policy Memo concludes that Congress should confine the review to technical and consensus matters, and focus policy on fixing these larger matters. The close:

“Canada and Mexico are America’s permanent neighbors, and close working relationships with them are profoundly important in ways far beyond economics. And in economic terms specifically, Canada and Mexico are the largest two customers for American exporters, reliable suppliers of energy for American utilities, food and consumer goods for American families, and equally reliable providers of essential inputs for American industry. The terms of these relationships can always in principle be improved and adapted, but they’re already good and the USMCA is a strong foundation for them.

“Meanwhile, the second Trump administration’s approach to trade and to our two large neighbors is weakening the U.S. economy, eroding American national security, and damaging the Constitution. The USMCA did not create these crises, and changing it will not solve them. As the review approaches, Congress should make clear that the agreement does not need major revisions, and confine the administration’s work on it to consensus issues on which the U.S., Canadian, and Mexican governments can agree without controversy. Instead it should focus trade policy in 2026 on settling the larger problems:

  • Arresting the damage that uncontrolled tariff escalation is doing to American family living standards and U.S. industrial competitiveness.
  • Healing, or at least mitigating, the national security harm the administration has done through its approach to Canada and Mexico.
  • Restoring constitutionally appropriate development of trade policy.

“Passage of the bill introduced by Rep. Sanchez, which would reverse most of Mr. Trump’s tariff decrees and ensure Congressional votes on any similar future ideas, would be an ideal first step in this. With it passed, the task of improving and perfecting existing agreements might return to the center of policy. But not before.”

FURTHER READING

PPI’s four principles for response to tariffs and economic isolationism:

  • Defend the Constitution and oppose rule by decree;
  • Connect tariff policy to growth, work, prices and family budgets, and living standards;
  • Stand by America’s neighbors and allies;
  • Offer a positive alternative.

PPI’s newest: Gresser on USMCA at 6.

USMCA:

The USMCA itself.

… for the review clause, see Chapter 34, “Final Provisions”, Article 34.7.

… for some innovations, Chapter 19 on Digital Trade, Chapter 23 on Labor, and Chapter 24 on Environment.

… and for a challenging but illuminating read, Chapter 4 on Rules of Origin, pp. 4-B-1-1 to 4-B-1-47, explains automotive rules of origin. TL/DR: 75% of the value must be North American (as opposed to 65% during the NAFTA period); metals used in cars and trucks must all be North American (current average is about two tons of metal per vehicle); and 40% of labor content must be “high wage.”

Next step:

Rep. Linda Sanchez and Ways and Means Committee Democrats’ HR 2888.

And backstory:

The 1993 North American Free Trade Agreement.

The 1988 U.S.-Canada FTA.

The 1965 U.S.-Canada Agreement Concerning Automotive Products.

ABOUT ED

Ed Gresser is Vice President and Director for Trade and Global Markets at PPI.

Ed returns to PPI after working for the think tank from 2001-2011. He most recently served as the Assistant U.S. Trade Representative for Trade Policy and Economics at the Office of the United States Trade Representative (USTR). In this position, he led USTR’s economic research unit from 2015-2021, and chaired the 21-agency Trade Policy Staff Committee.

Ed began his career on Capitol Hill before serving USTR as Policy Advisor to USTR Charlene Barshefsky from 1998 to 2001. He then led PPI’s Trade and Global Markets Project from 2001 to 2011. After PPI, he co-founded and directed the independent think tank ProgressiveEconomy until rejoining USTR in 2015. In 2013, the Washington International Trade Association presented him with its Lighthouse Award, awarded annually to an individual or group for significant contributions to trade policy.

Ed is the author of Freedom from Want: American Liberalism and the Global Economy (2007). He has published in a variety of journals and newspapers, and his research has been cited by leading academics and international organizations including the WTO, World Bank, and International Monetary Fund. He is a graduate of Stanford University and holds a Master’s Degree in International Affairs from Columbia Universities and a certificate from the Averell Harriman Institute for Advanced Study of the Soviet Union.

Read the full email and sign up for the Trade Fact of the Week.

New PPI Memo Urges Congress to Deemphasize 2026 USMCA Review, Address Economic and Constitutional Trade Challenges First

WASHINGTON — The Progressive Policy Institute (PPI) today released a new policy memo authored by Ed Gresser, Vice President and Director for Trade and Global Markets at PPI, arguing that the United States-Mexico-Canada Agreement (USMCA) is functioning effectively and does not require major revisions ahead of its scheduled six‑year review in July 2026. Instead, Congress should confine the review to consensus issues on which the three governments can easily agree, and focus urgently on three larger crises created by the Trump administration’s tariff and trade‑policy actions.

The memo, titled “USMCA is Not Broken, Doesn’t Need Major Changes,” outlines how USMCA has helped sustain robust trade flows with Canada and Mexico, and the primary threats to U.S. trade and national‑security interests stem from the unilateral tariff and “emergency” decree actions taken under this administration.

“USMCA remains a sound foundation for North American trade and integration,” said Gresser. “There are serious problems in North American relations and trade, but these are the result of the Trump administration’s tariff decrees and threats against Mexico and Canada. Before trying to perfect what basically works, Congress must first fix what’s broken.”

“Rolling back President Trump’s illegal and costly tariffs that he recklessly imposed on our friends and closest trade partners should be Congress’s top trade priority, not picking apart the USMCA,” said Rep. Don Beyer (D-Va.). “This agreement is working as intended, delivering meaningful results and lowering costs for the American people. Our trade relationships with Canada and Mexico are already under attack by an endless onslaught of tariffs and threats emanating from the White House that are driving up prices and reducing growth. We need to keep the USMCA stable and in force in order to protect ordinary Americans from the economic chaos that the President seems determined to inflict on the nation.”

Revising and updating the North American Free Trade Agreement in 2020, the USMCA added new features, including digital trade protections, strengthened labor and environmental provisions, and stricter automotive‑manufacturing rules of origin. Under USMCA, U.S. trade with Canada and Mexico remains substantial: in 2024, $1.6 trillion of the $5.3 trillion in U.S. goods traded globally was with Canada and Mexico. Altogether, the memo concludes that it is delivering value and requires no major overhaul.

Conversely, the memo identifies three urgent policy failures that demand action before any USMCA renegotiation:

  1. Escalating tariffs that raise costs for American families and reduce manufacturing competitiveness.

  2. Strained relations with Canada and Mexico, weakening North American economic and security integration.

  3. constitutional risk from the Trump administration’s use of emergency and national‑security tariff declarations to bypass Congress’s Article I trade authority.

Because the USMCA’s six‑year review clause is voluntary (it “requires no action at all” next year), Congress should signal that the review should be confined to technical and consensus matters, and instead require the Trump administration to first rectify the deeper crises.

Specifically, the memo recommends the passage of legislation such as H.R. 2888 to revoke emergency tariff decrees and restore congressional oversight, a diplomatic reset to rebuild trust with Canada and Mexico, and reform of trade‑policy governance with renewed congressional direction of negotiating objectives.

With the USMCA review window opening next July, the memo urges policymakers to:

  • Resist launching broad renegotiations of USMCA for appearance’s sake.

  • Prioritize legislative and diplomatic reform to repair tariff‑driven damage and restore the constitutional trade framework.

  • Only after those steps, consider whether targeted, high‑consensus enhancements to USMCA deserve attention.

Read and download the memo here.

Founded in 1989, PPI is a catalyst for policy innovation and political reform based in Washington, D.C. Its mission is to create radically pragmatic ideas for moving America beyond ideological and partisan deadlock. Find an expert and learn more about PPI by visiting progressivepolicy.org. Follow us @PPI.

###

Media Contact: Ian OKeefe – iokeefe@ppionline.org

USMCA is Not Broken, Doesn’t Need Major Changes

In 2026 USMCA Review, Congress Should Focus on Crises Caused by Trump Administration

The U.S.-Mexico-Canada Agreement, successor to the North American Free Trade Agreement, has been in force for just over five years. That means a deadline of sorts is coming up. As passed by Congress in 2019, the USMCA includes a clause directing the three partner countries to “review” the agreement after six years — that is, by July 2026 — and decide whether they like it more or less as is, or want to see changes.

In principle, that’s fine. The agreement is a big human creation, with some notable innovations. As such, it has lots of features that look good to some groups but bad to others. With the “review” ahead, industry associations, pressure groups, labor unions, and agricultural commodity groups are all dutifully writing up lists of ways to improve it. But fundamentally, the agreement is working reasonably well — facilitating trade in agriculture, energy, and manufacturing, helping digital channels stay open, encouraging joint work on wildlife trafficking and ocean health, and experimenting with a novel approach to labor issues. At the same time, though, the Trump administration’s profligate tariffs and threats against Canada and Mexico are causing a series of genuine crises: usurpation of Congress’s Constitutional authority; erosion of relationships at the core of U.S. national security; and a deteriorating economic environment as tariffs raise costs for families and diminish the competitiveness of U.S. farming and manufacturing.

The “deadline,” meanwhile, is a very soft one. In fact, it requires no action at all. And in the circumstances of 2025 and 2026, the best choice is “let well enough alone.” Congress should make it clear that the USMCA does not need major changes at this point, and that policy should instead focus on ending these self-created crises. If the administration nonetheless wants to proceed, Congress should require three steps first:

  • Approve legislation such as Representative Linda Sanchez’s HR 2888, which would terminate the administration’s “emergency” and “national security” decrees under laws like “IEEPA,” “Section 232,” and “Section 301” and require votes on any future Presidential imposition of tariffs (or other import limits) with some carefully circumscribed exceptions.
  • Stabilize North American security by restoring trust, mutual respect, and common interest as the foundation of U.S. policy for America’s neighbors.
  • Restore Constitutionally appropriate policymaking, with Congress setting negotiating objectives for trade policy agencies and voting to approve, or not, any agreements making changes in U.S. tariff rates or trade laws.

With these done, it would be appropriate, and might be useful, to look closely at the USMCA and see whether a broad consensus exists for changes that would improve it. But not before.

Read the full policy memo.

Gresser in Politico: LNG Exporters Urge Permanent Port Fee Exemption

LEAVE IT ALONE: The Trump administration has received more than 1,500 comments full of advice regarding the future of USMCA, which faces a mandatory review in 2026 — the sixth anniversary of its entry into force.

In a new policy memo, Gresser, who is vice president and director for trade and global markets at the Progressive Policy Institute, a centrist Democratic think tank, called for a “let well enough alone” approach to the North American trade pact.

“Congress should make it clear [to the Trump administration] that the USMCA does not need major changes at this point, and that policy should instead focus on ending these self-created crises,” Gresser wrote, referring to tariffs the president has imposed on Canada and Mexico this year.

If the administration insists on proceeding, lawmakers should reassert their constitutional authority over trade by passing legislation to terminate Trump’s tariff actions, establish key negotiating objectives for trade agreements and require any tariff changes be approved by Congress, Gresser said.

Read more.