PPI’s Trade Fact of the Week: The U.S. tariff system is biased against poor families

FACT:

The U.S. tariff system is biased against poor families.


THE NUMBERS: 

U.S. MFN tariff rates:

On silver-plated forks:       0.0%

On stainless steel forks     15.8% + 0.9c each
values under 25 cents:


WHAT THEY MEAN: 

As Americans prepare 1040 forms and tax payments this week, some observations on the U.S.’ oldest and most regressive tax:

In principle, tariffs are simple. An American auto dealership pays the Customs Bureau the 2.5% tax on a German car and includes it in the sales price. But in practice, tariffs can be very complicated. Even setting aside the system’s many add-ons and holes,* the basic U.S. “Most Favored Nation” tariff schedule is a mini-tax code all to itself, arranged in 11,111 different “lines” from horses at the beginning (line 01012100) through salt, cars, butter, planes, powdered zinc, playing cards, computers and more, to antiques between 100 and 250 years old at the end (line 97069000), each with its own tax rate.

Information on this system’s operation is scarce. Congress appears to have held its most recent hearing on tariff policy in 1974. It has been even longer since the Treasury Department reported on the distributional and other economic effects of tariffs. And the only regular review of the tariff system’s impact on employment, production, and living standards — the U.S. International Trade Commission’s admirable if limited “Economic Effects of Significant Import Restraints” report — last came out in 2017.  But enough information is available to make three main points: (1) the tariff system is a small part of federal revenue; (2) it mainly taxes consumer necessities like clothes and shoes; and (3) it is, by far, the most regressive U.S. tax.  Some detail on each of these points, plus an additional fourth observation unrelated to taxation:

1. Tariffs provide about 2% of federal revenue. According to the Congressional Budget Office’s November estimates, the U.S. Treasury took in $4.06 trillion in Fiscal Year 2021 (i.e., Sept. 30, 2020 through Sept. 30, 2021). The Treasury used six major taxes to raise this money, topped by the $2.04 trillion income tax, the $1.31 trillion payroll tax, and the $0.37 trillion corporate tax. Tariffs placed fourth at $81 billion (for the Fiscal Year; the calendar year 2021 total was $85 billion), about equally divided between the administrative and provisional Trump-era tariffs on Chinese goods and metals, and the permanent “MFN” tariff system established by law. Rounding out the six taxes, excise taxes on fuels, alcohol, and tobacco placed fifth at $75 billion, and inheritance taxes sixth at $25 billion.

2. The U.S. tariff system is mainly a way to tax clothes, shoes, and a few other consumer necessities, and is therefore a “regressive” tax. The Trump-era tariffs hit manufacturers and construction firms hardest. (More on this in a few weeks.) The permanent tariff system is quite different, mainly taxing retailers and families by putting its highest rates on clothes, shoes, and a few other home goods such as silverware, plates and cups, and drinking glasses. Tariff rates on this set of goods average about 11.3%, roughly 16 times the 0.7% average for everything else. Thus in 2017, the last year before the Trump tariffs, these products accounted for about 6% of America’s goods imports ($144 billion of a $2.37 trillion total), but raised about 55% of tariff revenue ($17 billion of $33 billion). Any tax focused on clothes, shoes, and other home needs is “regressive” — that is, it hits low-income families harder than middle-class or rich families — since the poor must devote more of their income to these necessities.

3. Because consumer goods tariffs are high for cheap goods, and low for luxuries, they single out the poor to pay more. Worldwide, most tariff systems tax these goods more heavily than industrial products and natural resources. Thus the U.S. system is not unusual in being a regressive tax; but it is nearly alone in taxing cheap mass-market goods much more heavily than the exactly analogous luxury products bought by the wealthy. For example, Australian tariffs on shoes are almost all either 5% or zero, and do not set higher rates on cheap shoes than on expensive ones. American shoe tariffs by contrast are 8.5% for dress leathers, 20% for elite basketball and track shoes, and 48% for cheap sneakers imported at $3.00 and below. The fork example above is much the same:  buyers of sterling silver pay no tax at all, while buyers of cheap stainless steel pay about 20% (counting the 0.9 cent per fork flat fee as well as the 15% “ad valorem” tariff).

This skew is systematic, appearing in almost all tariffed consumer goods. A quick PPI table gives twelve typical examples:
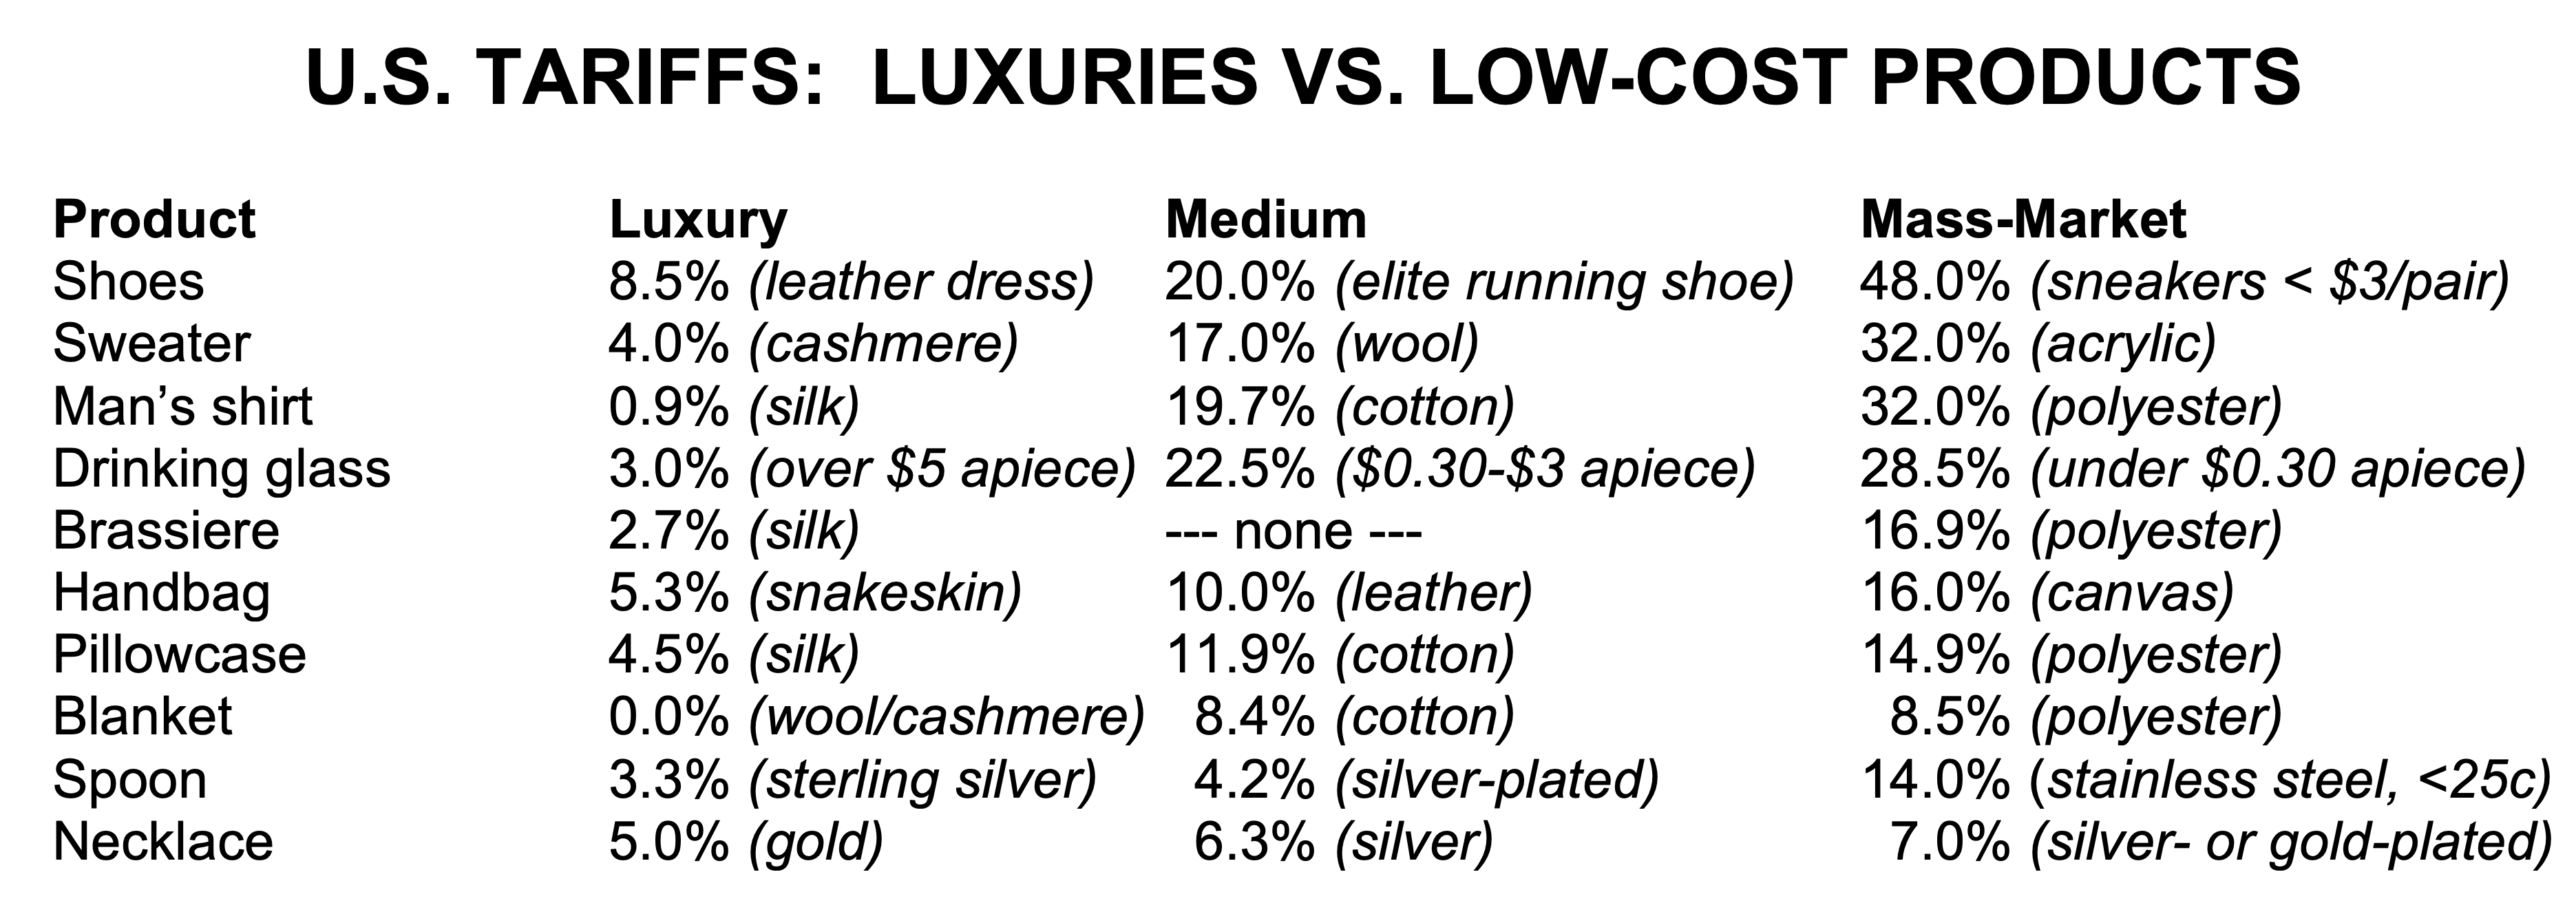
Explanatory note: These home goods — clothes, shoes, home linens, luggage and handbags, jewelry, and tableware — account for a relatively small proportion of imports, totaling $123 billion in 2017, or 5% of the U.S.’ $2.3 trillion in merchandise imports. Nonetheless, these products account for $17 billion of the $32.4 billion in 2017 tariff revenue. Thus average tariff rates applied to these products are about 15%, 20 times higher the 0.8% average for other goods. About $25 billion worth of these products arrived duty-free under FTAs and trade preference programs, while $100 billion came under the MFN tariff s above.  

For the sake of simplicity, we have not included the actual tariff line numbers in the table above. They are available at the U.S. International Trade Commission’s tariff site. If you have a specific request, please email us. 

4. Tariffs do not appear effective as job or production protectors. Finally, though not a tax issue as such, the consumer goods tariffs appear not to have powerful effects on employment and production. For example, 98% of shoes are imported and no cheap sneakers have been made here since the 1970s; likewise 97% of clothes are imported, and most arrive under the normal tariff system rather than FTAs or preferences. Silverware is made in the United States, but in the high-priced luxury low-tariff category rather than the cheap high-tariff category.

Perhaps we can do better, and treat low-income Americans more fairly, than this.

* Add-ons: anti-dumping and countervailing duty penalties on particular goods, Trump-era “301” and “232” tariffs on metals and Chinese goods. Holes:  waivers of tariffs for particular countries through FTAs and preferences.

FURTHER READING


The U.S.’ “Harmonized Tariff Schedule”

Obama administration Council of Economic Advisers luminaries Jason Furman, Jay Shambaugh, and Kadee Russ on the tariff system as an “arbitrary and regressive tax.”

The U.S. International Trade Commission’s “Economic Effects of Significant Import Restraints,” the last edition was authorized in 2016 and released in 2017.

In this Form 1040 season, tariff reform and PPI’s big-picture tax reform

PPI’s July 2019 tax proposal envisions scrapping Trump-era tariffs and the regressive-but-ineffectual parts of the MFN tariff system.  This is part of a larger reform program designed to create a “simpler, fairer, and more pro-growth tax system that raises adequate revenue”.  The program includes 14 specific reforms that reduce taxes on income from labor while increasing them on unearned sources of income for the wealthy; rein in the biggest tax expenditures; encourage reduction or elimination of other wasteful and distortionary elements of the tax code; and improve collection.  Examples include replacing the relatively regressive payroll tax with a value-added tax; revising the estate and gift tax system; adding a marijuana excise tax, and more. See pp. 44-56.

And for reference, the basic data from CBO

The Congressional Budget Office’s latest outlay-and-revenue summary.

And the six main taxes in Fiscal Year 2021:

Total federal revenue         $3,842 billion
Personal income taxes        $1,705 billion
Payroll taxes                        $1,296 billion
Corporate income taxes       $268 billion
Tariffs                                       $81 billion
Excise taxes                             $75 billion
Estate & gift taxes                   $28 billion
Misc. other fees and fines        $32 billion


ABOUT ED

Ed Gresser is Vice President and Director for Trade and Global Markets at PPI.

Ed returns to PPI after working for the think tank from 2001-2011. He most recently served as the Assistant U.S. Trade Representative for Trade Policy and Economics at the Office of the United States Trade Representative (USTR). In this position, he led USTR’s economic research unit from 2015-2021, and chaired the 21-agency Trade Policy Staff Committee.

Ed began his career on Capitol Hill before serving USTR as Policy Advisor to USTR Charlene Barshefsky from 1998 to 2001. He then led PPI’s Trade and Global Markets Project from 2001 to 2011. After PPI, he co-founded and directed the independent think tank ProgressiveEconomy until rejoining USTR in 2015. In 2013, the Washington International Trade Association presented him with its Lighthouse Award, awarded annually to an individual or group for significant contributions to trade policy.

Ed is the author of Freedom from Want: American Liberalism and the Global Economy (2007).  He has published in a variety of journals and newspapers, and his research has been cited by leading academics and international organizations including the WTO, World Bank, and International Monetary Fund. He is a graduate of Stanford University and holds a Master’s Degree in International Affairs from Columbia Universities and a certificate from the Averell Harriman Institute for Advanced Study of the Soviet Union.

Read the full email and sign up for the Trade Fact of the Week

PPI’s Trade Fact of the Week: ‘Trade’ is generally popular among Americans

FACT:

“Trade” is generally popular among Americans. 


THE NUMBERS: 

Gallup 2022 poll: International trade “is an opportunity for growth through exports”*

All respondents                    61%
Self-declared Democrats     72%

*The alternative, international trade is more “a threat to the economy through foreign imports,” gets 35% support among the general public; Gallup’s writeup does not cite Democratic support for this proposition.


WHAT THEY MEAN:

Gallup’s February trade poll asks, for the 22nd time since 1992, whether we are more inclined to see “exports as an opportunity for growth” or “foreign” imports as a “threat to the economy.” Lamentably off on the economics! But faced with this choice, 61% of respondents choose “opportunity” and 35% “threat.” This result is on the “optimistic” side of the poll’s average, which over the full 30 years comes out at 53%-33%. Its partisan filter, meanwhile, finds self-identified Democrats more “pro-trade” than average at 72%; Republicans are for now more pessimistic, with 44% choosing “opportunity” and 52% “threat.” Independents, at 65% “opportunity,” are closer to the Democratic view.

The second very recent trade poll, released last November by the Chicago Council for Global Affairs, asks about two specific trade agreements — the Comprehensive and Progressive Trans-Pacific Partnership (previously the more concise TPP), and U.S.-Mexico-Canada Agreement (before its renegotiation, the North American Free Trade Agreement) and whether in general “globalization” and “international trade” are good for the United States. Though the questions are different, the Council’s results are similar to Gallup’s: an overall positive view, with a noticeable partisan divergence.  Asked about a hypothetical decision by the U.S. to rejoin the CPTPP, 62% of Council respondents favored the idea while 33% opposed. Among Democrats, the split was a decisive 75% yes and 19% no; Republicans were also positive but less emphatic, at 50%-38%. Likewise, asked whether “international trade” is good for the U.S. economy in general, 86% of Democrats concurred as against 66% of Republicans; and asked whether trade is good for “creating jobs,” 68% of Democrats and 51% of Republicans agreed.

Both results are pretty typical of the last decade’s trade polling, showing a generally positive public view of trade but with Democrats more enthusiastic. A trawl back through earlier Gallup and Chicago Council polls, along with more by Pew Research, NBC/Wall Street Journal, Monmouth and others, finds at least three different demographic axes of divergence, suggesting that the partisan gap has a stronger foundation than simple reactions to a current administration:

1. Youth and Age: Young people generally seem more positive about trade than their elders.  As an example, Pew’s 2018 poll found 18-29-year-olds most likely to agree in a general sense that “trade is good” (84%), and also most likely to agree that trade creates jobs, lowers prices, and raises wages.

2. Race and Ethnicity: Monmouth University asked in 2019 (during the Trump administration’s burst of tariffing) whether “tariffs on products imported from our trading partners” would help or harm the U.S. economy. This poll divides the public a little simply, contrasting the views of non-Hispanic whites with those of all other races and ethnicities combined.  It found non-Hispanic white Americans tilting against tariffs (28% help the U.S. economy, 41% harm); among Hispanic, Asian Americans, and African Americans, by contrast, the split was a decisive 19% “help” and 57% “harm.”

3. Education: The same Monmouth poll, found differences on tariffs to be modest among the public as a whole, but with less-educated white Americans noticeably less likely than other demographics to see tariffs as harmful to the economy.  Among all Americans with college degrees, 23% predicted that tariffs would help the economy while 56% predicted harm; for all those without degrees, the split was a similar though less emphatic 25% “help” and 43% “harm”.  Among non-Hispanic white Americans, specifically though, views diverged sharply by education level:  respondents with college degrees viewed tariffs as likely to harm the economy by 54%-23%, while respondents without degrees split nearly evenly, at 31% “help” and 35% “harm.”

FURTHER READING


Gallup on the 2022 view of trade.

Pew’s 2018 survey.

The Chicago Council’s 2021 poll.

Monmouth University’s 2019 poll on tariffs.

And NBC/WSJ, also from 2019.

Time capsule

The Chicago Council on Global Affairs has the longest continuous record of trade polling, spanning 42 years from last November’s report to the March 1979 American Public Opinion and U.S. Foreign Policy release. Forty-three years ago, the U.S. public’s top international economic concerns were inflation and the declining value of the dollar, and the public at large appears to have been more inclined to keep tariffs while national leaders mostly favored abolishing them. The Chicago Council archive.


ABOUT ED

Ed Gresser is Vice President and Director for Trade and Global Markets at PPI.

Ed returns to PPI after working for the think tank from 2001-2011. He most recently served as the Assistant U.S. Trade Representative for Trade Policy and Economics at the Office of the United States Trade Representative (USTR). In this position, he led USTR’s economic research unit from 2015-2021, and chaired the 21-agency Trade Policy Staff Committee.

Ed began his career on Capitol Hill before serving USTR as Policy Advisor to USTR Charlene Barshefsky from 1998 to 2001. He then led PPI’s Trade and Global Markets Project from 2001 to 2011. After PPI, he co-founded and directed the independent think tank ProgressiveEconomy until rejoining USTR in 2015. In 2013, the Washington International Trade Association presented him with its Lighthouse Award, awarded annually to an individual or group for significant contributions to trade policy.

Ed is the author of Freedom from Want: American Liberalism and the Global Economy (2007).  He has published in a variety of journals and newspapers, and his research has been cited by leading academics and international organizations including the WTO, World Bank, and International Monetary Fund. He is a graduate of Stanford University and holds a Master’s Degree in International Affairs from Columbia Universities and a certificate from the Averell Harriman Institute for Advanced Study of the Soviet Union.

Read the full email and sign up for the Trade Fact of the Week

Trade Fact of the Week: America’s ‘non-MFN’ tariffs on natural resources are usually low

FACT:

America’s “non-MFN” tariffs on natural resources are usually low.


THE NUMBERS: 

Tariff rates on two Russian imports

Palladium, “MFN”:           0%
Palladium, “Column 2”:    0%

King crab, “MFN”:            0%
King crab, “Column 2”:     0%


WHAT THEY MEAN:

The Biden administration’s ban on Russian oil, coal, and gas is a large though not total trade sanction, cutting off about 60% of American imports of Russian goods. (Last year’s import total was $26 billion; energy made up $16 billion.) Congress, meanwhile, is considering a bill to revoke Russia’s “Most Favored Nation” tariff status. Some observations on this more complex measure:

Fundamentally, it means the tariff rates a country applies generally — as an example, the U.S.’ 6.5% “MFN” tariff on umbrellas (tariff line 66019100) applies to European umbrellas, Chinese umbrellas, Brazilian umbrellas, etc. (Following the late Senator Daniel Moynihan’s noble but forlorn hope to make trade policy terms of art more comprehensible, the U.S. also uses the term “permanent Normal Trade Relations or “NTR” to mean the same thing, but others don’t.) MFN tariffs are also a core feature of relationships among WTO members, as membership entails accepting a “non-discrimination” obligation requiring them to give one another equal tariff rates.

What then does “revoking” MFN status mean? In practice, should Congress pass such a law, buyers of Russian goods would no longer pay the current U.S. tariff rate. Instead they would pay the rates created in the 1930 “Smoot-Hawley” Tariff Act during the Hoover presidency.  These rates are now listed in “Column 2” of the U.S. Harmonized Tariff Schedule; as an example, an umbrella gets a 40% Column 2 tariff. More broadly, standard estimates of Smoot-Hawley average tariffs are (a) about 20% overall, based on dividing tariff revenue by import value, as opposed to 2.8% in 2021 (or 1.4% excluding the Trump-era tariffs on Chinese goods and metals) or (b) an even higher average of 59% excluding duty-free goods.

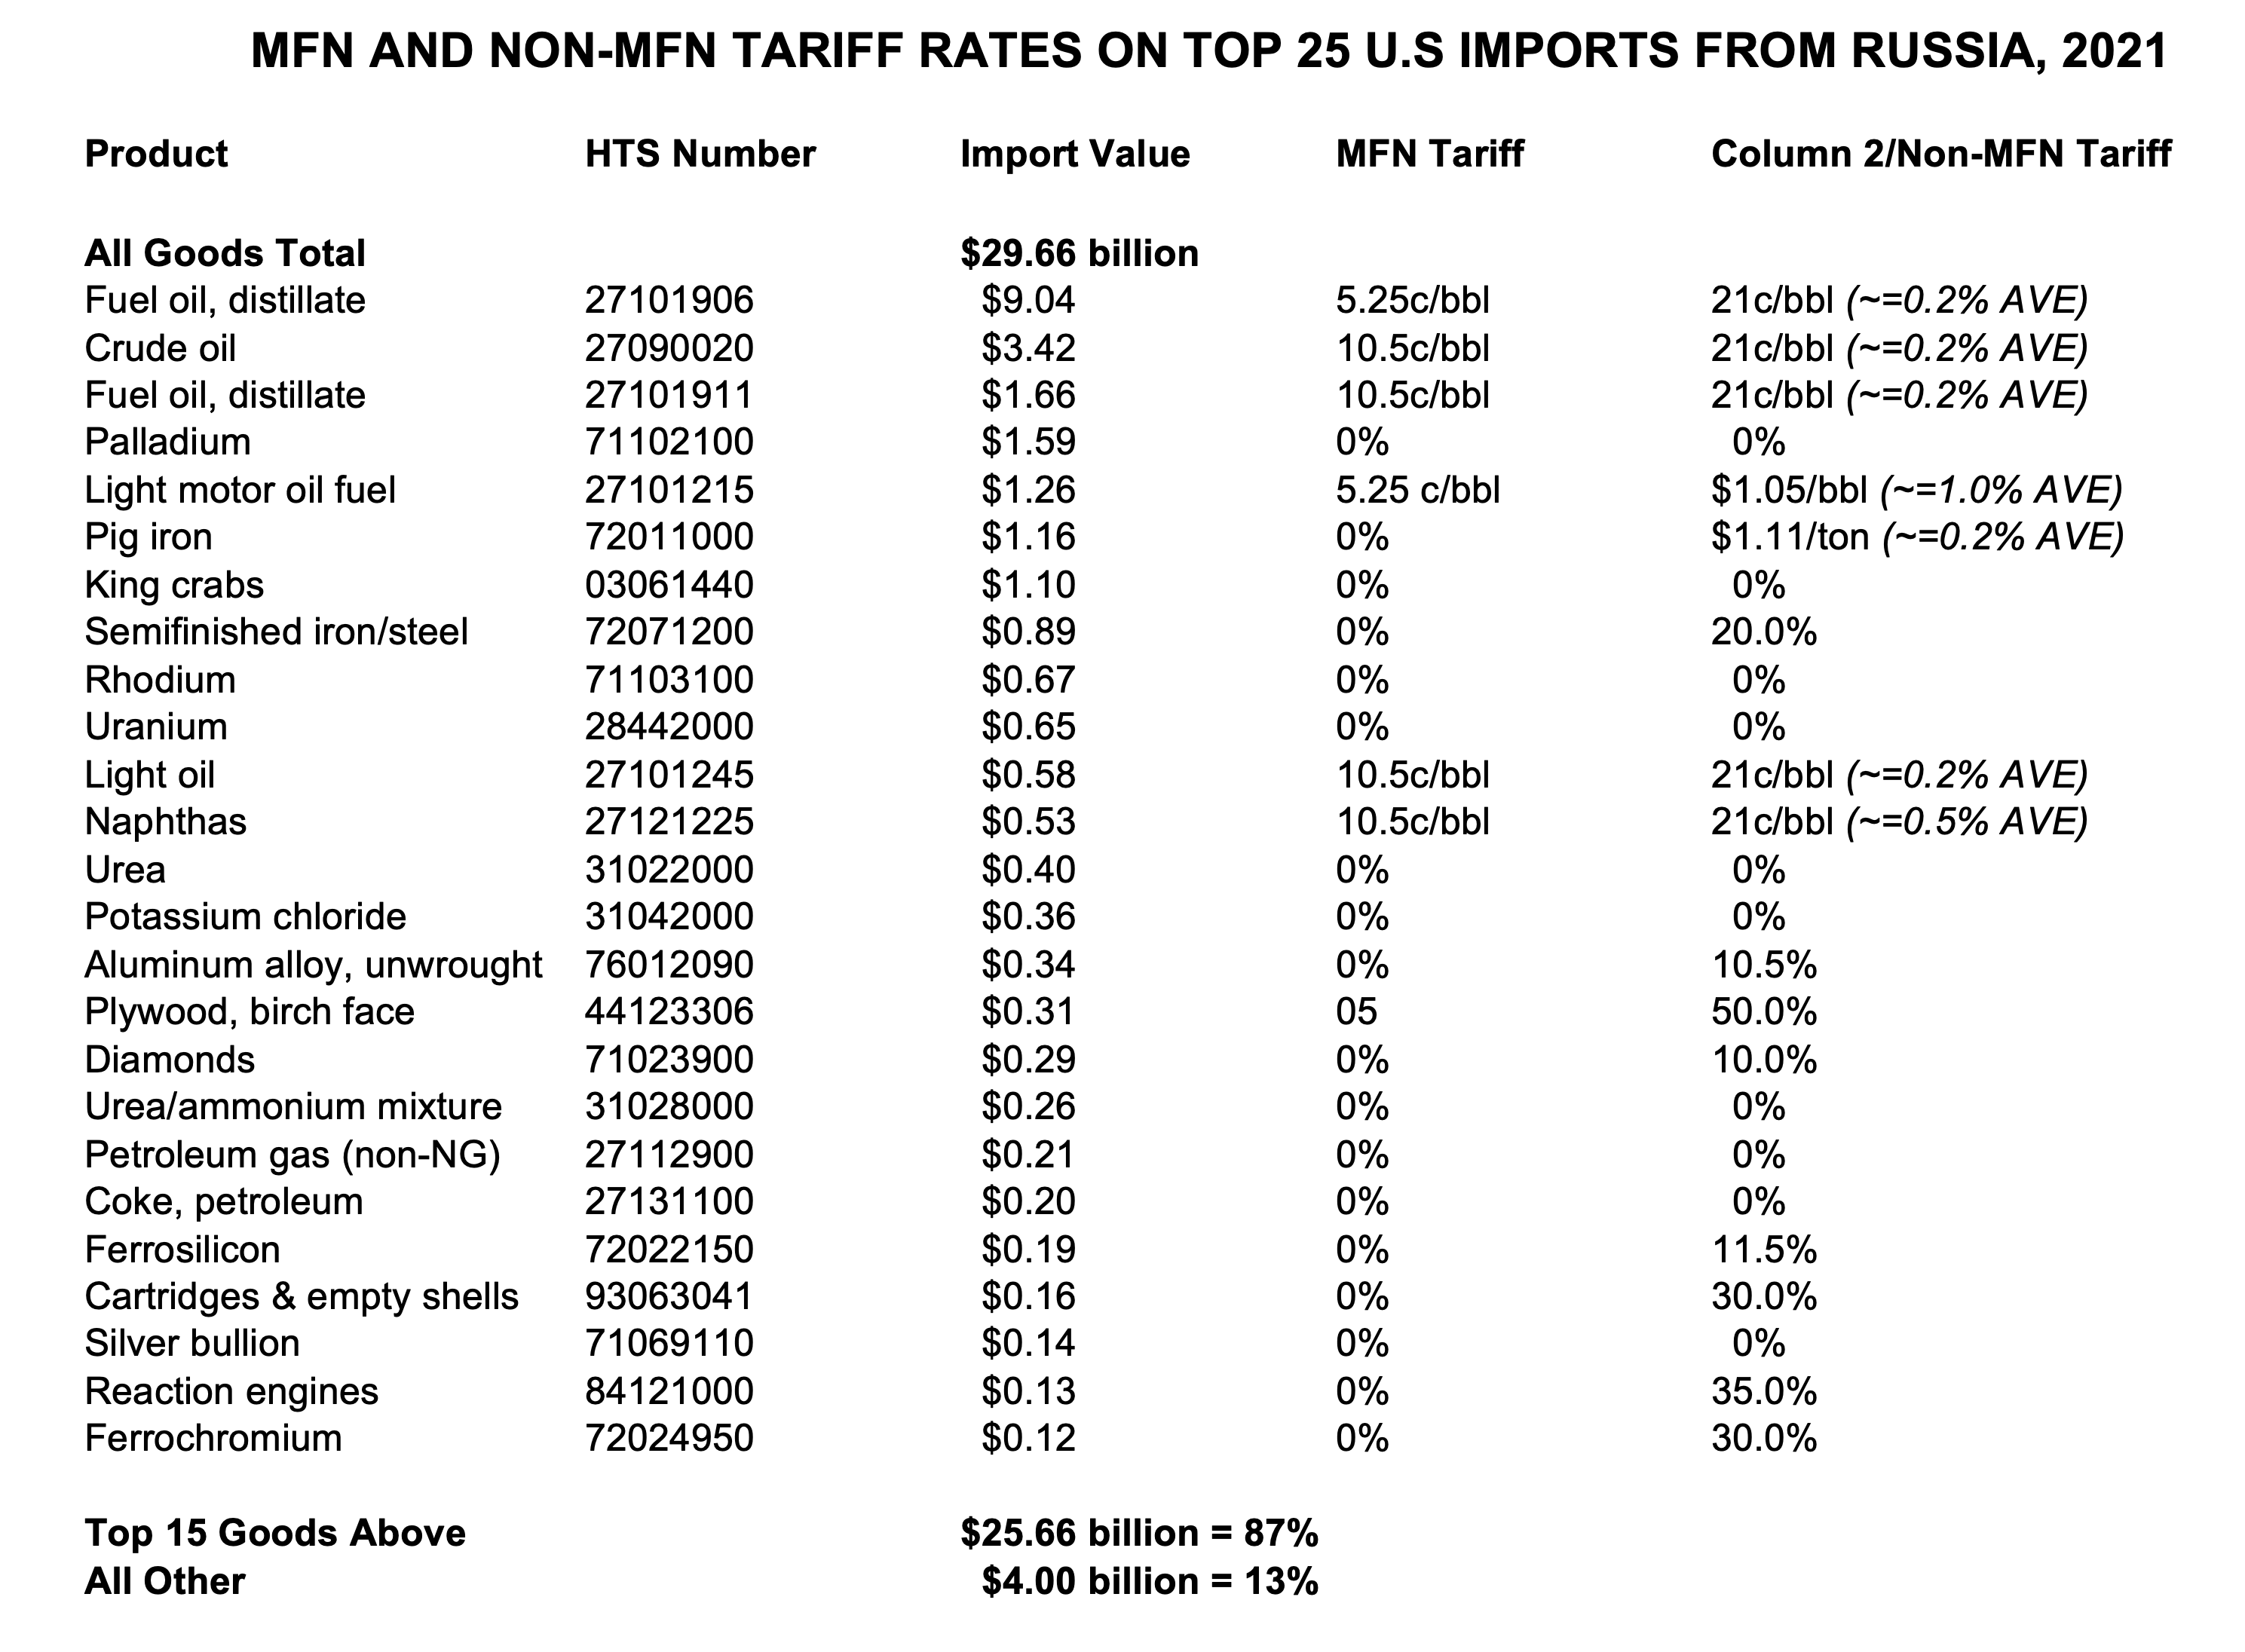
As the averages and the umbrella example both suggest, non-MFN tariffs are generally seen as quite punitive, and often are so in reality. However, they are much less punitive in the specific Russian case.  This is because Russia is mainly a natural-resource exporter, and Column 2 tariffs on natural resources are actually rarely high and often zero. In 1930, both Congress and Mr. Hoover wanted very high tariffs on manufactured goods and farm products, but avoided them on raw materials to keep costs low for U.S. factories. These sorts of things — energy, specialty metals, chemical inputs for fertilizer — make up most of America’s 21st-century purchases from Russia. A look at MFN and “Column 2” rates on the U.S.’ top 25 Russian imports last year (accounting for $22 billion of a $26 billion total) yields this result:

1. Energy ($16 billion): Eight crude and refined oil, gas, and coal products made up about 60% of all U.S. imports from Russia last year.  The Column 2 tariff on crude oil is 21 cents per barrel —twice the “MFN” 10.5 cents per barrel, but still insignificant.  So revoking MFN tariffs on energy would be unlikely to change trade flows at all, since the increases basically raise rates from about 0.1% to about 0.2%.  If the goal is to impose economic costs, yesterday’s ban will do a lot more.

2. Four specialty metals ($2.1 billion): palladium, rhodium, uranium, and silver in bullion form. Here, revoking MFN changes nothing, as U.S. tariffs are zero on these things at MFN, and also zero in Column 2.

3. Five natural resources and basic chemical products (also $2.1 billion): Diamonds are zero at MFN, and 10.5% in Column 2; likely some impact, but not a huge one.  The others — king crab, potassium chloride, urea, and urea/ammonium mixture (the latter two used as fertilizer precursors) — are all zero tariff now and also zero in Column 2.

4. Four industrial metals ($2.5 billion): The largest is pig iron at $1.2 billion, for which rates rise from zero to $1.11 per ton.  This was probably a lot in 1930, but is about 0.2% — not significant — at the 2022 market price of about $500 per ton. Increases are higher for the other three:  zero to 10.5% for unwrought aluminum alloy, zero to 11.5% for ferrosilicon, and zero to 30% for ferrosilicon.

5. Four value-added manufactured products ($1.5 billion): Here, a shift to Column 2 means a steep tariff increase.  For birch-faced plywood, tariffs rise from zero to 30%; for bullets and cartridge shells, zero to 50%; for semi-finished steel products, zero to 20%; and for reaction engines, zero to 35%.

Altogether, then, revoking MFN status for Russia imposes some penalties, but in most cases not very significant ones given Russia’s unusual export pattern.  It may nonetheless be an appropriate symbolic and moral gesture, in particular if many WTO members join in it.  But as a policy measure meant specifically to impose economic cost, the energy import ban is the one with practical real-world impact.

FURTHER READING


President Biden on blocking Russia energy imports; also summarizes current sanctions, coordination with allies, and measures to ease impacts at home.

Trade Subcommittee Chair Rep. Earl Blumenauer on the case for revoking Russia’s PNTR.

Finance Committee Chair Wyden with a similar bill.

A quick PPI table: The top 25 U.S. imports from Russia (at HTS-8 level in tariff lingo, accounting for 87% of the $26 billion in U.S. imports from Russia last year), with import value, tariff code, and MFN/non-MFN rates:

Tariff System Background

The Harmonized Tariff Schedule, from the U.S. International Trade Commission (MFN rates in Column 1, non-MFN in Column 2).

Also from the ITC, the invaluable (though a bit challenging for those not yet initiated into tariff codes) Dataweb allows you to check imports, exports, and balances country-by-country and product-by-product.

And trade policy historian Doug Irwin looks back at the notorious Tariff Act of 1930.

A Note on Platinum-Group Metals

Where does it hurt? Overall, Russia is a modest U.S. trading partner, supplying 1% of U.S. imports and buying 0.3% of exports. Though the largest chunk of this is energy (again, $16 billion of $26 billion in total imports, and of $32 billion in total trade), adjustment for the U.S. might be most challenging in a few specialty metals (e.g. palladium and rhodium, “platinum-group” metals used in automotive engines to absorb pollutants in exhaust, in medical device manufacturing, and so on). The U.S. Geological Survey’s summary of platinum-group metal reserves around the world suggest it isn’t impossible. Russia has a lot, but South Africa has more, and the U.S. and Canada have some, too.

Here’s where it is — Sibanye Stillwater, a South African-owned U.S. mine in Montana, is the principal non-Russian source of palladium.


ABOUT ED

Ed Gresser is Vice President and Director for Trade and Global Markets at PPI.

Ed returns to PPI after working for the think tank from 2001-2011. He most recently served as the Assistant U.S. Trade Representative for Trade Policy and Economics at the Office of the United States Trade Representative (USTR). In this position, he led USTR’s economic research unit from 2015-2021, and chaired the 21-agency Trade Policy Staff Committee.

Ed began his career on Capitol Hill before serving USTR as Policy Advisor to USTR Charlene Barshefsky from 1998 to 2001. He then led PPI’s Trade and Global Markets Project from 2001 to 2011. After PPI, he co-founded and directed the independent think tank ProgressiveEconomy until rejoining USTR in 2015. In 2013, the Washington International Trade Association presented him with its Lighthouse Award, awarded annually to an individual or group for significant contributions to trade policy.

Ed is the author of Freedom from Want: American Liberalism and the Global Economy (2007).  He has published in a variety of journals and newspapers, and his research has been cited by leading academics and international organizations including the WTO, World Bank, and International Monetary Fund. He is a graduate of Stanford University and holds a Master’s Degree in International Affairs from Columbia Universities and a certificate from the Averell Harriman Institute for Advanced Study of the Soviet Union.

Read the full email and sign up for the Trade Fact of the Week
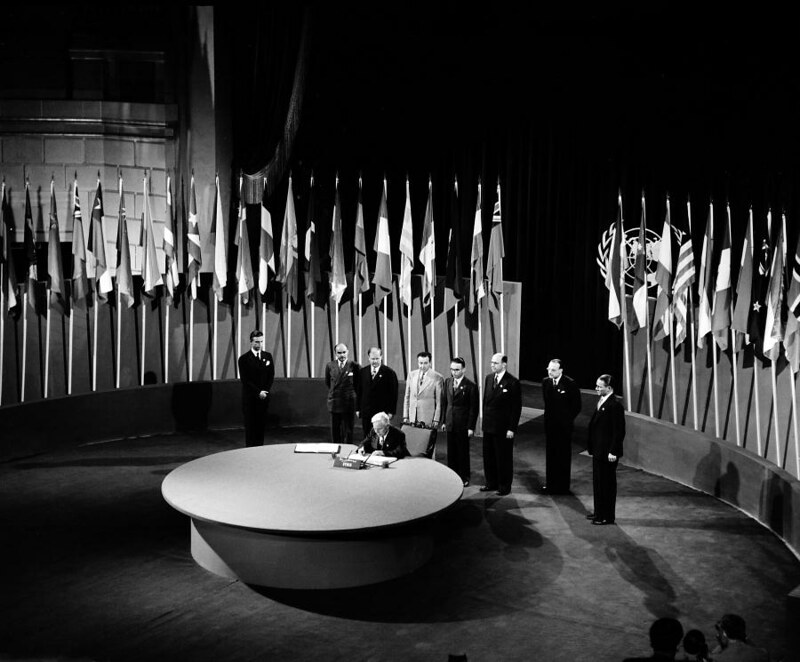
Trade Fact of the Week: The only previous attempt to erase a U.N. member country from the map: 1990

FACT:

The only previous attempt to erase a U.N. member country from the map: 1990.

THE NUMBERS: 

U.N. member states as of February 2022: 193

WHAT THEY MEAN: 

From the transcript of Ukrainian Ambassador Sergei Kyslytsya’s remarks to the U.N. Security Council a week ago Tuesday:

“The internationally recognized borders of Ukraine have been and will remain unchangeable.  Ukraine unequivocally qualifies the recent actions by the Russian Federation as violation of sovereignty and territorial integrity of Ukraine. … President Putin, who has taken a decision that we discuss today as a threat to the rules-based order, to the U.N. Charter, in particular its Article 2, as well as to international peace and security.”

Particularly relevant in the Ambassador’s reference to the U.N. Charter is Article 2’s Clause 3, on wars of conquest: “All Members shall refrain in their international relations from the threat or use of force against the territorial integrity or political independence of any state, or in any other manner inconsistent with the Purposes of the United Nations.”

Obviously, the actual U.N. members have frequently fallen short of the Charter’s aspirations over the 78 years since its signature. In the last decade especially, after a long period of peace among great powers, even close allies found it difficult to sustain a sense of common interest.  But however far governments have fallen short of the Charter’s goals, they have almost invariably respected its ban on wars of conquest. Only once before last week’s attack on Ukraine (in Saddam Hussein’s 1990 attempt to annex Kuwait to Iraq) has one U.N. member state attempted to erase another from the map. Three thoughts on the events since:

(1)    Respect for the ban on wars of conquest is at the foundation of any international aspiration, whether related to peaceful settlement of disputes among countries, scientific and medical progress, common action against environmental threats, prosperity and reduction of poverty, or reduction of the risk of war.

(2)    The breach of this principle in the attack on Ukraine last week is very rare in modern history and exceptionally dangerous, in that it was ordered not by the rogue dictator of an isolated minor power but by a permanent member of the U.N. Security Council.  Should it succeed, we may well expect more such events and a much more dangerous world.  Should it fail, the taboo on wars of conquest will be greatly strengthened, and future attempts far less likely.

(3)    The Biden administration and partner democracies have responded with a model of muscular, calm, and principled cooperation, first in attempting to dissuade the Russian government from attacking Ukraine, and then in their coordinated response, combining extensive financial and other sanctions with practical and moral support for Ukraine.  The contrast between this response and the self-pitying folly of “America First” movements — in the 1940s or the 2020s — is stark, reminding us that isolationism makes the world more dangerous and ultimately Americans themselves less safe; and that when defense of international order and the principles Ambassador Kyslytsya cites prove necessary, the world’s democracies have many and powerful options.


FURTHER READING

Ukrainian Ambassador Kyslytsya at the U.N. Security Council last week.

The U.N. Charter full text.

Current policy review

NATO summarizes military aid to Ukraine.

The Treasury Department’s Office of Foreign Assets Control reports the addition of four individuals to the “Specially Designated Nationals” list.

The European Union itemizes current sanctions.

The U.K. sanctions.

Australia sanctions.

New Zealand on Ukraine.

Japan sanctions.

Korea on Ukraine.

Canada sanctions.

Some relevant PPI readings 

PPI President Will Marshall on the meaning of Putin’s war on Ukraine.

A reprise of our Trade Fact launch last October, “Liberalism is Worth Defending.”

And Paul Bledsoe on ways to undo Europe’s natural gas dependency on Russia.

ABOUT ED

Ed Gresser is Vice President and Director for Trade and Global Markets at PPI.

Ed returns to PPI after working for the think tank from 2001-2011. He most recently served as the Assistant U.S. Trade Representative for Trade Policy and Economics at the Office of the United States Trade Representative (USTR). In this position, he led USTR’s economic research unit from 2015-2021, and chaired the 21-agency Trade Policy Staff Committee.

Ed began his career on Capitol Hill before serving USTR as Policy Advisor to USTR Charlene Barshefsky from 1998 to 2001. He then led PPI’s Trade and Global Markets Project from 2001 to 2011. After PPI, he co-founded and directed the independent think tank ProgressiveEconomy until rejoining USTR in 2015. In 2013, the Washington International Trade Association presented him with its Lighthouse Award, awarded annually to an individual or group for significant contributions to trade policy.

Ed is the author of Freedom from Want: American Liberalism and the Global Economy (2007).  He has published in a variety of journals and newspapers, and his research has been cited by leading academics and international organizations including the WTO, World Bank, and International Monetary Fund. He is a graduate of Stanford University and holds a Master’s Degree in International Affairs from Columbia Universities and a certificate from the Averell Harriman Institute for Advanced Study of the Soviet Union.

Trade Fact of the Week: Russian share of world GDP and trade: 1% to 2%

FACT:

Russian share of world GDP and trade: 1% to 2%


THE NUMBERS: 

GDP by country, IMF 2022 estimate

World.  $102.0 trillion
U.S.         $24.8 trilion
EU          $18.4 trillion
Russia.      $1.7 trillion

WHAT THEY MEAN:

As international sanctions responses to Russia’s attack on Ukraine evolve this week, what are they working with? Some measures of Russia’s place in the world economy along seven lines of data, covering GDP, trade, energy, currency trading, FDI, financial reserves, and scientific research:

GDP: Russia’s economy is more volatile than that of most other big countries, as it inflates rapidly when energy and metal prices rise and deflates fast when prices fall. This noted, the International Monetary Fund’s most recent estimate places Russian GDP at $1.7 trillion in 2022. This places it midway between Mexico’s $1.4 trillion and Canada’s $2.2 trillion, and about 1.5% of the $102 trillion world economy. Others in the same neighborhood include Brazil at $1.8 trillion, Taiwan at $1.6 trillion, and Indonesia at $1.2 trillion. IMF estimates for other big economies include: U.S. $25 trillion, China $18.5 trillion, EU $18.4 trillion, Japan $5.4 trillion, Germany $4.6 trillion, the U.K. $3.4 trillion, India $3.3 trillion, France $3.1 trillion, and Korea $1.9 trillion.

Trade: Russian exports vary, again with energy and metal prices, in a range from $200 billion to $400 billion per year. At the high end, this is about 2% of the world’s annual $20 trillion in goods exports. Relative to output, exports accounted for 25.5% of GDP in 2020, just below the worldwide 26.5% average. The EU is the main partner, buying 40% of Russian exports and providing 31% of imports; China is next as the market for 13% of Russian exports and source of 22% of imports. The U.S. is a minor player in both accounts, at about 5% each; for the U.S., Russia’s main significance is as a supplier of some specialty metals such as titanium and palladium.

Energy: DoE’s Energy Information Administration reports that Russia is the third-largest producer of petroleum in the world (after the United States and Saudi Arabia), and holds the world’s largest proven reserves of natural gas. With respect to trade, figures compiled by BP suggest that Russia accounts for 11.4% of world oil exports (7.4 million bbl/day out of 65.1 million), and a quarter of gas exports (238 billion cubic meters out of 940 billion. This means that the Russian government is more dependent on exports for revenue, and Russian private-sector businesses less dependent, than is the case for large manufacturing or agricultural exporting economies. About half of Russian oil exports go to the EU and a third to China; with respect to gas, determined by pipeline construction, 89% of exports go to the EU, Turkey, and Belarus.

Currency: The Bank of International Settlements’ most recent triennial report (2019) reports $46 billion in daily Russian currency turnover, or about 0.5% of the daily $8.3 trillion in worldwide currency trading.

Foreign Direct Investment: Russia’s role in currency trading is minimal; the Bank of International Settlements’ most recent triennial report (2019) reports $46 billion in daily Russian currency turnover, or about 0.5% of the daily $8.3 trillion in worldwide currency trading. As reported last November by UNCTAD, about $416 billion of the world’s $41.4 trillion in foreign direct investment stock are in Russia. Measured the other way, Russian firms and state enterprises hold a similar $379 billion in other countries. These figures, however, are likely large overstatements; IMF staff research suggests that about 60% of FDI in Russia comes from “foreign phantom corporations” — that is, “empty shell corporations with no real activities.”

Financial Reserves: The IMF reports Russian financial reserves, which presumably are less vaporous than FDI figures, at $630 billion. This is a large but not extraordinary sum, just below India’s $634 billion and not vastly above those of some smaller countries; for example, Israel is at $209 billion and the Czech Republic $175 billion. China’s reserves are the world’s largest at $3.4 trillion, with Japan next at $1.4 trillion.

Science: The OECD reports Russian spending on research and development at $44 billion, which is about 2% of an identified world total (including OECD members, China, Russia, Taiwan, and a few others) of $2.2 trillion. OECD places Russia’s R&D at 1% of GDP, similar to the level for Turkey and about 40% of the 2.5% OECD. The U.S. is at 3.1%; Israel and Korea have the highest known figure at 4.9% and 4.6%.

In sum, Russia is a large country and mid-tier economy. It is significant in energy production and exports (especially as a supplier for western Europe); it can use energy income to finance a large military establishment and a modest research base; and it has a large financial reserve but also likely relies heavily on energy exports to maintain this reserve. Otherwise, its role in global growth, investment, or invention is modest.


FURTHER READING

The Embassy of Ukraine in D.C.

And an update on U.S. policy, from the U.S. Embassy in Ukraine.

Sanctions background

White House staff review Russia energy and financial sanctions, as of Feb. 22.

European Union decisions.

The Japan Foreign Ministry can be found here.

The Treasury Department’s Office of Foreign Assets Control lists/reviews existing sanctions.

And a 2009 assessment of economic sanctions as a foreign policy tool, from Peterson Institute for International Economics scholars Hufbauer/Schott/Elliott/Clegg.

Background

The U.S. Energy Information Agency on Russia’s role in gas and oil.

PPI’s Paul Bledsoe’s report on natural gas, including the role of Russian gas.

The IMF economic database, with GDP, exports, debt, etc.

… and IMF staff on “phantom FDI” in Russia and elsewhere.

The OECD’s “Main Science and Technology Indicators.”


ABOUT ED

Ed Gresser is Vice President and Director for Trade and Global Markets at PPI.

Ed returns to PPI after working for the think tank from 2001-2011. He most recently served as the Assistant U.S. Trade Representative for Trade Policy and Economics at the Office of the United States Trade Representative (USTR). In this position, he led USTR’s economic research unit from 2015-2021, and chaired the 21-agency Trade Policy Staff Committee.

Ed began his career on Capitol Hill before serving USTR as Policy Advisor to USTR Charlene Barshefsky from 1998 to 2001. He then led PPI’s Trade and Global Markets Project from 2001 to 2011. After PPI, he co-founded and directed the independent think tank ProgressiveEconomy until rejoining USTR in 2015. In 2013, the Washington International Trade Association presented him with its Lighthouse Award, awarded annually to an individual or group for significant contributions to trade policy.

Ed is the author of Freedom from Want: American Liberalism and the Global Economy (2007).  He has published in a variety of journals and newspapers, and his research has been cited by leading academics and international organizations including the WTO, World Bank, and International Monetary Fund. He is a graduate of Stanford University and holds a Master’s Degree in International Affairs from Columbia Universities and a certificate from the Averell Harriman Institute for Advanced Study of the Soviet Union.


Read the full email and sign up for the Trade Fact of the Week
Trade Fact of the Week: The U.S.-Canada trade relationship is the largest in world history

FACT:

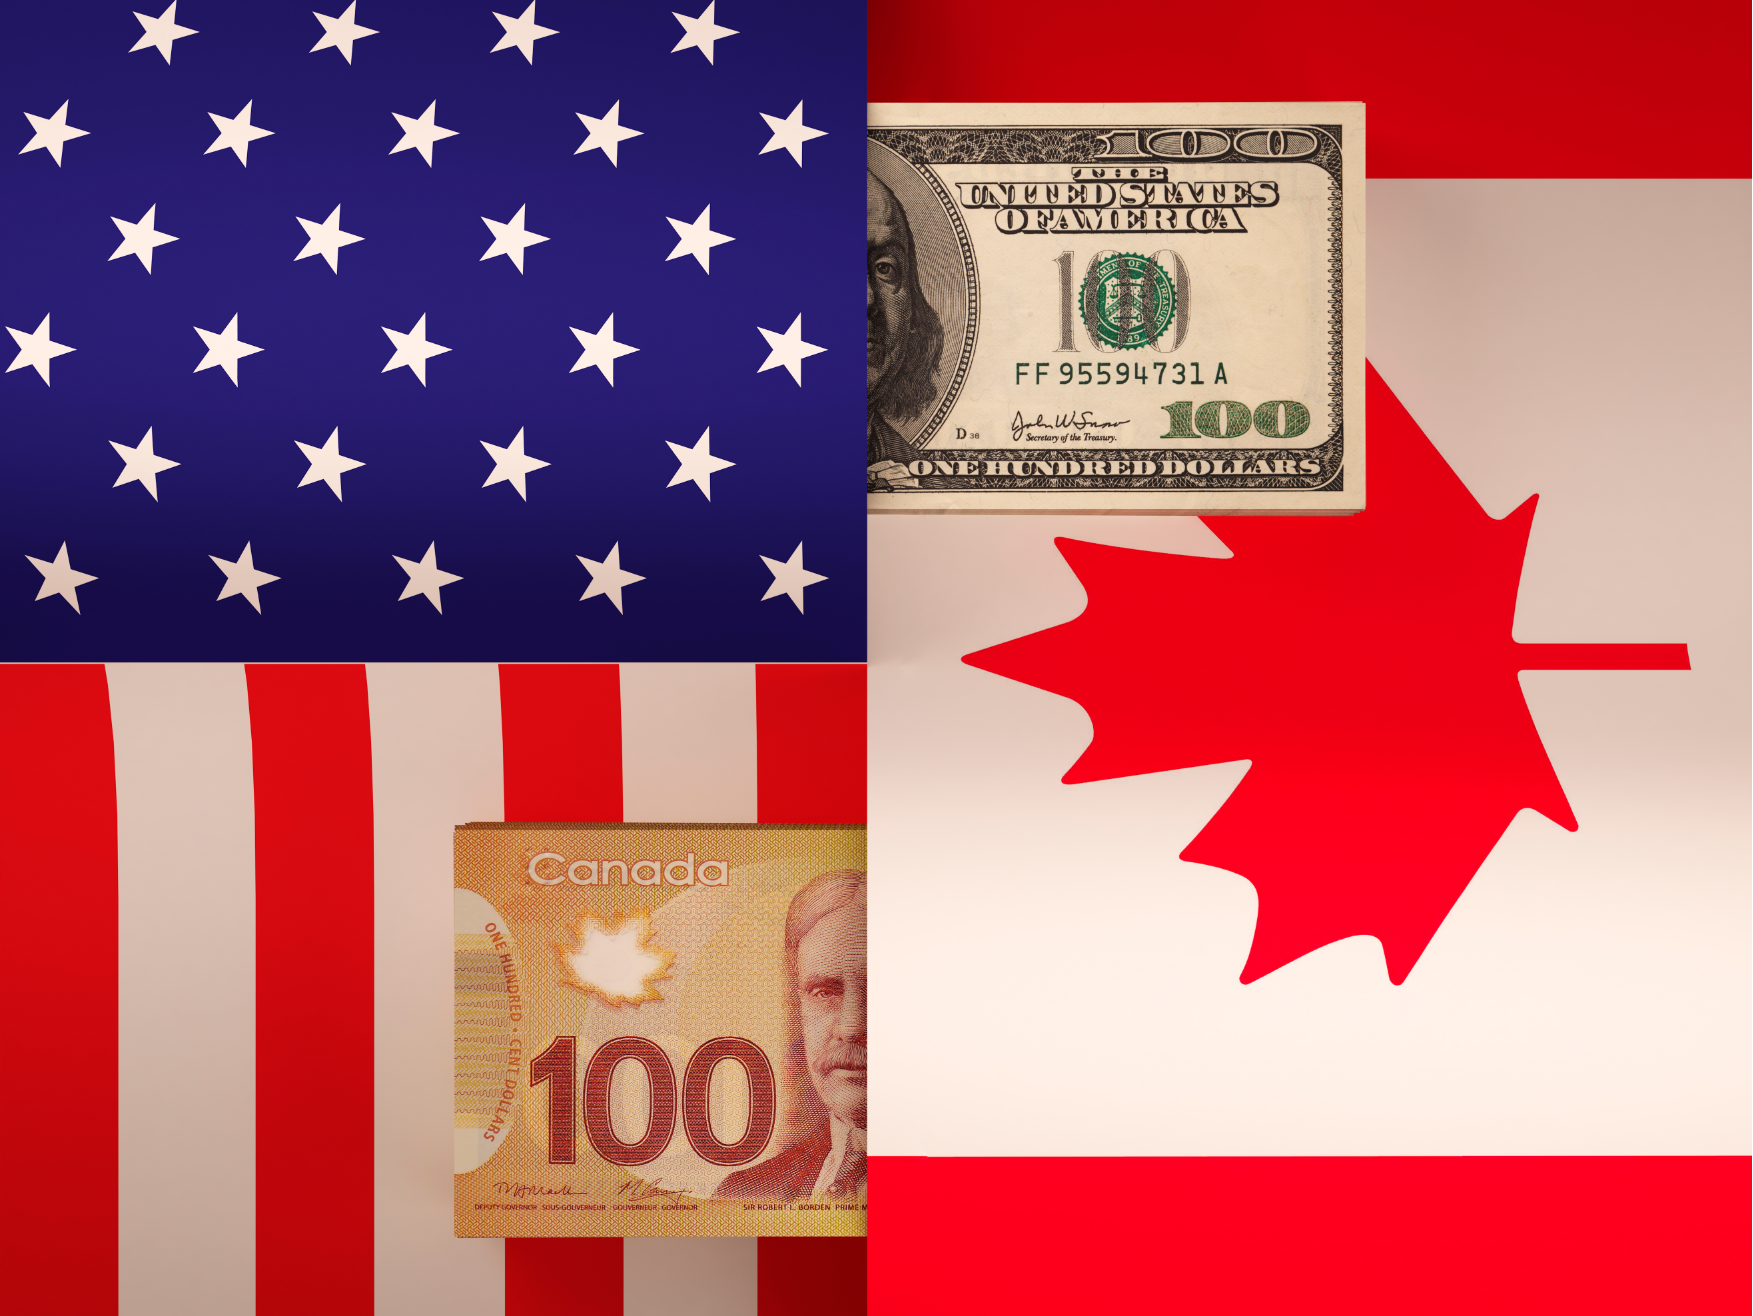
The U.S.-Canada trade relationship is the largest in world history.


THE NUMBERS: 

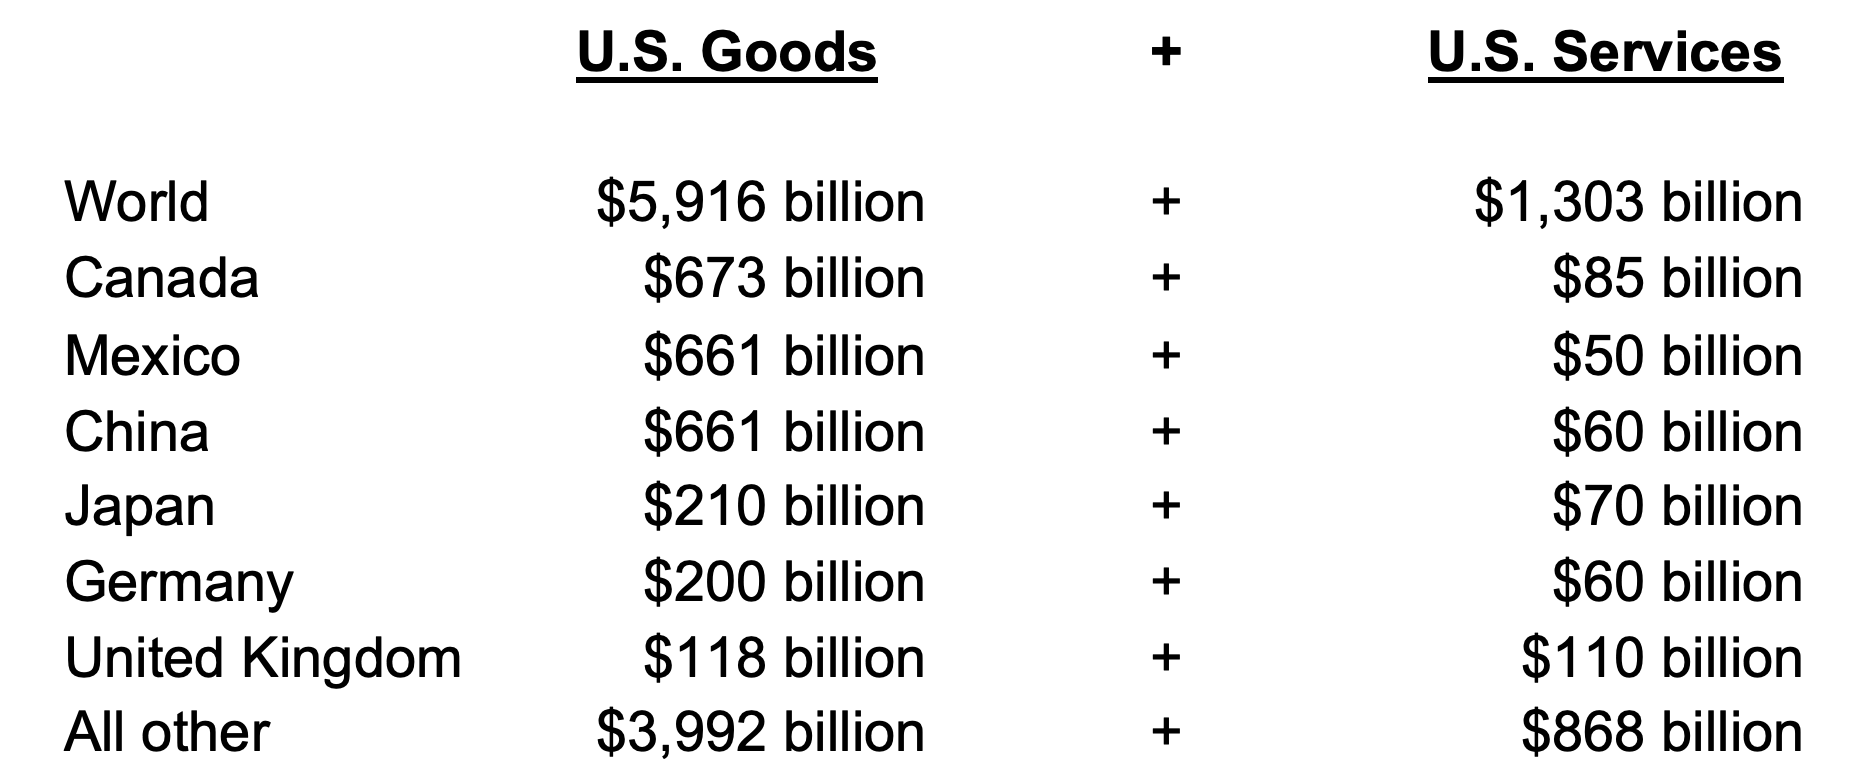
Top six U.S. goods + services trade partners in 2021*

* Estimates for services based on the nine months available data. Goods trade are full-year figures.


WHAT THEY MEAN:

Then-President Reagan in September of 1988, eloquently closing as he signs the U.S.-Canada Free Trade Agreement: “Let the 5,000-mile border between Canada and the United States stand as a symbol for the future. No soldier stands guard to protect it. Barbed wire does not deface it. And no invisible barrier of economic suspicion and fear will extend it. Let it forever be not a point of division but a meeting place between our great and true friends.”

A generation into this future:

(1)      Canada accounts for a ninth of all U.S. goods trade and (with some uncertainty as final services data aren’t yet in) about a fifteenth of services trade. The total places Canada slightly ahead of Mexico and China as top trade partner, and thus as the largest single trade relationship in the world.  Matching this against history is tricky — should one compare last year’s $740 billion in U.S.-Canada trade to the $95 trillion in world GDP? To the $20 trillion in trade flows? To something else? But in the simplest sense, counting the nominal value of paper dollars or shiny loonies, last year’s U.S.-Canada relationship was the largest two-way trade relationship ever.

(2)    Canada is the top U.S. export market for 29 states, and second-ranked for another 13. Canadians buy more American goods ($308 billion in 2021) than the 27 EU countries ($272 billion) combined; or, alternatively, nearly as much as China ($150 billion) plus Japan ($75 billion) plus Korea ($66 billion) plus Hong Kong ($30 billion) plus Taiwan ($37 billion). Only the U.K. is a larger buyer of American services.

(3)    President Reagan seems to have low-balled the border length a bit; by the International Border Commission’s estimate, it is 5,528 miles, including 4,000 along the “continental U.S.” northern border and 1,500 on Alaska’s western and southern frontier. Either way, as events elsewhere in the world continually remind us, a friendly, unguarded, border-cum-meeting-place, where the most troubling events are COVID-related tourism interruptions and temporary blockages of auto-parts shipments, is (a) a rarity in history, (b) something to greatly value, and (c) a heritage to protect.


FURTHER READING

Governments 

Then-President Reagan signs the U.S.-Canada FTA, September 1988.

USTR’s “USMCA” page, a generation later.

Trade section for the U.S. Embassy in Ottawa.

… and for the Canadian Embassy on vice versa.

Borders

Official data on state, provincial, and other border facts from the International Border Commission.

Wait times on the Ambassador Bridge, said to be the world’s single busiest international commercial crossing, from U.S. Customs and Border Patrol.

The Canadian Customs Border Services Agency tracks wait times at the 126 U.S.-Canada crossing points.

Exasperated comment from Michigan Gov. Whitmer.

The Missoulian reports on protests, blockages, and local reactions at the Sweetgrass (MT) crossing point.

Remarks from Deputy Prime Minister Chrystia Freeland regarding the blockades and the Emergencies Act


ABOUT ED

Ed Gresser is Vice President and Director for Trade and Global Markets at PPI.

Ed returns to PPI after working for the think tank from 2001-2011. He most recently served as the Assistant U.S. Trade Representative for Trade Policy and Economics at the Office of the United States Trade Representative (USTR). In this position, he led USTR’s economic research unit from 2015-2021, and chaired the 21-agency Trade Policy Staff Committee.

Ed began his career on Capitol Hill before serving USTR as Policy Advisor to USTR Charlene Barshefsky from 1998 to 2001. He then led PPI’s Trade and Global Markets Project from 2001 to 2011. After PPI, he co-founded and directed the independent think tank ProgressiveEconomy until rejoining USTR in 2015. In 2013, the Washington International Trade Association presented him with its Lighthouse Award, awarded annually to an individual or group for significant contributions to trade policy.

Ed is the author of Freedom from Want: American Liberalism and the Global Economy (2007).  He has published in a variety of journals and newspapers, and his research has been cited by leading academics and international organizations including the WTO, World Bank, and International Monetary Fund. He is a graduate of Stanford University and holds a Master’s Degree in International Affairs from Columbia Universities and a certificate from the Averell Harriman Institute for Advanced Study of the Soviet Union.


Read the full email and sign up for the Trade Fact of the Week
Trade Fact of the Week: U.S. has lost 35,000 exporting businesses since the mid-2010s

FACT:

U.S. has lost 35,000 exporting businesses since the mid-2010s.


THE NUMBERS: 

U.S. export share of GDP:

2021:        10.8%
2020:       10.2%
2019:        11.8%
2018:        12.3%
2014:        13.5%


WHAT THEY MEAN:

Three Census Bureau reports provoke some thoughts on the U.S.’ export economy, workers and pay, growth with and without inflation, and the next three years of policy:

(1)  The “FT-900,” released Tuesday morning, is the Census’ regular monthly summary of the basic U.S. trade data, with figures on exports, imports, goods, services, countries, and so on. Tuesday’s edition covers December 2021, and is a good point for stock-taking as it covers the full year 2021, the Biden/Harris administration’s first year in office. This found U.S. exports at $2.53 billion: 2.1 million cars and $2 billion in sports and fishing equipment; 170 million cubic meters of liquefied natural gas; $59 billion in telecommunications, information, and computer services; 25 million tons of wheat; $5 billion in wine, liquors, and beer; $30 billion worth of medical devices, etc. This represents a $394 billion jump from $2.13 trillion in COVID-stricken 2020, which in one way is a very impressive pace of growth, unmatched since 2010 but in another way essentially brings exports back to the pre-COVID levels of $2.53 trillion in 2019 and $2.54 billion in 2018.

(2)  The second report, out last November, is “U.S. Exporting Firms by Demographics”.  This is a deep dive into the nature of the businesses that produce these things, using tax, trade, and other data for 2018 to provide a survey of the ownership, employment, payrolls, and foreign markets of 178,000* of that year’s 293,000 known U.S. exporters.  Some findings:

*    Exporters offer high employment and pay:  Exporting businesses averaged 274 workers, at payroll per worker of $69,000.  Non-exporters, by comparison, employed 14 workers on payroll at $44,000 per worker. About 16,500 exporting businesses are large, presumably publicly held forms (in Census’ terminology, “unclassifiable” by ownership type).  Dropping these from the tables, U.S. exporters averaged employed 54 workers, on payroll at $64,210 per worker. The comparable figures for “unclassifiable by ownership type” non-exporters were 10 workers and $41,027 per worker. The sharpest pay premium appears to be among the 23,500 women-owned exporters: They average 38 workers at $61,000 in payroll per worker, as against 9 workers and $38,000 in women-owned non-exporting businesses.

*    Diverse business ownership is a national asset:  An ethnically and racially diverse business community appears to help the U.S. find customers and income abroad.  As one example, about 1 in 12 U.S. exporters sell to Africa; for African American owned firms, the share is 1 in 7. A similar comparison from a different angle finds Hispanic-owned firms making up 5.5% of all U.S. exporters, but 10% of exporters to Latin America and 12% of exporters to Central America specifically.

(3)  Finally, “Profile of U.S. Importing and Exporting Companies,” also from this past November (though in “preliminary” form, pending a final count in April) counts the total number of exporting businesses as of early 2020.  It glumly reports 270,000 such firms, about 35,000 below the peak count of 305,000 in 2013/2014, and 23,000 below the 293,000 reported for 2016 and 2018. Mirroring this decline in numbers, the export sector’s place in the U.S. economy has diminished in recent years, falling as a share of GDP from a 13.5% peak in 2013 and 2014 to 11.8% in 2018, and then 10.3% of GDP in 2020 — the lowest level since 2006.


Against this long-term backdrop, the big jump in yesterday’s FT-900 is good news, but still leaves the U.S. exporting well short of the role it held five or 10 years ago.

What explains the erosion?  And will it last?  One obvious but presumably transient contributor is the impact of COVID-related economic closures (especially in the first half of 2020).  These affected almost all exporting sectors, and are still powerful in “transport” and “travel” services, whose exports remain far below pre-COVID levels. Another is recent policy choices: Trump-era tariffs provoked direct retaliations against U.S. exporters, and may also, by raising the cost of parts and materials for American manufacturers and farmers, be contributing to a slower erosion of export competitiveness.  Beyond this, and not yet felt, implementation of the Asia-based “Regional Closer Economic Partnership” — a 15-country Asia-Pacific trade agreement joining China, Japan, Korea, Australia, New Zealand, and the 10 ASEAN members, together accounting for about a third of all world imports outside the U.S. — presages a Pacific tariff tilt in favor of the cars, wines, fishing rods, wheat, etc. produced by U.S. competitors.

In sum, Census numbers say many good things about the U.S. export economy in 2021.  And they suggest some ways for exporters might contribute more to both workers and macroeconomic health in the next few years.  But they also offer grounds for concern, and reasons for energetic policy.

Note: PPI Trade and Global Markets staff thank Census staff for helping with interpretation of several of these releases, and more generally for their sustained excellence in statistical work in trade and other areas.


FURTHER READING

From Census 

The “FT-900” series has the basic monthly trade figures, updated Tuesday for full-year 2021.

… and the accompanying “Historical Series” has a convenient one-page annual summary of imports, exports and balances from 1960 through 2021.

And “U.S. Exporting Firms by Demographics” looks deeply into 178,000 of 2018’s 293,000 exporting businesses* by owner type: male/female; race and ethnicity (with white, African American, Hispanic, Asian American, Native American, and Pacific Islander); veteran ownership; and 200 export markets ranging in scale from “Vanuatu” and to “Africa” to “EU-27” and “All Countries.” Available with data for 2018, 2017, 2012, and 2007.

* The 115,000 whose ownership couldn’t be accounted for include non-employing firms, agricultural producers, and businesses located in Puerto Rico and the U.S. insular territories.

The “Profile of Importing and Exporting Companies” looks at exporters and importers by size, with state-by-state figures, SMEs, 25 countries, sectors, etc.

Also on exporters, from two of Census’ sister Commerce Department agencies

Writing for the Minority Business Development Agency in 2015, Sharon Freeman reviews export opportunities and challenges for African American, Hispanic, Asian American, and Native American small businesses.

And the International Trade Administration summarizes research on the count and nature of “jobs supported by exports.”

And overseas

ASEAN announces entry into force for RCEP.


ABOUT ED

Ed Gresser is Vice President and Director for Trade and Global Markets at PPI.

Ed returns to PPI after working for the think tank from 2001-2011. He most recently served as the Assistant U.S. Trade Representative for Trade Policy and Economics at the Office of the United States Trade Representative (USTR). In this position, he led USTR’s economic research unit from 2015-2021, and chaired the 21-agency Trade Policy Staff Committee.

Ed began his career on Capitol Hill before serving USTR as Policy Advisor to USTR Charlene Barshefsky from 1998 to 2001. He then led PPI’s Trade and Global Markets Project from 2001 to 2011. After PPI, he co-founded and directed the independent think tank ProgressiveEconomy until rejoining USTR in 2015. In 2013, the Washington International Trade Association presented him with its Lighthouse Award, awarded annually to an individual or group for significant contributions to trade policy.

Ed is the author of Freedom from Want: American Liberalism and the Global Economy (2007).  He has published in a variety of journals and newspapers, and his research has been cited by leading academics and international organizations including the WTO, World Bank, and International Monetary Fund. He is a graduate of Stanford University and holds a Master’s Degree in International Affairs from Columbia Universities and a certificate from the Averell Harriman Institute for Advanced Study of the Soviet Union.


Read the full email and sign up for the Trade Fact of the Week
PPI Applauds Passage of America COMPETES Act

Today, the House of Representatives passed the America COMPETES Act, which will help ease supply chain tension, invest in American innovation, and strengthen our standing in the race to technological leadership.

Aaron White, Director of Communications for the Progressive Policy Institute (PPI) released the following statement:

“The Progressive Policy Institute is encouraged to see the House passage of the America COMPETES Act, a companion bill to the Senate’s bipartisan United States Innovation and Competition Act, which will invest in American innovation, ease the tensions on U.S. and global supply chains, and strengthen America’s standing in our race with China for technological leadership.

“This bill has the potential to spur long-term growth through significant investment in scientific innovation and new-age manufacturing and logistics advancements. The American technology sector has long been a leading global innovator; by investing in emerging technologies, research and development, the future workforce and the U.S. high-tech productive base, America can once again lead the world with a robust 21st century economy and expand opportunity for generations to come.

“Notably, it is unfortunate that House Republicans refused to vote for legislation that mirrored bipartisan bills and committee provisions, particularly given the Senate was willing to compromise and pass their companion bill on a bipartisan vote months ago. Important issues like supporting American innovation, technological leadership, and strengthening our economy should transcend partisanship, especially as we recover from the pandemic.

“We must acknowledge that there is still room for improvement. As the Senate and House begin the conference process for the United States Innovation and Competition Act and the America COMPETES Act, PPI encourages conference committee members to more closely examine the trade provisions within the final bill, and take the time needed — through hearings, public comments or other means — to consider the wide ranging implications for U.S. exporters and importers of several of the bill’s trade provisions.

“We also encourage the conference committee to consider reverse the Trump and GOP-era tax increase on scientific research that took effect this year. If left in place, this tax change threatens to undo much of the good that this legislation would do for American innovation. Finally, we hope lawmakers will wait for an official score from the Congressional Budget Office before voting on passage of the bill in its final form. Even if some public investments generate high enough returns to justify borrowing to pay for them, as PPI believes may be the case for some provisions in this bill, it is essential that our leaders have the necessary information to consider all the costs and tradeoffs.

“We thank Speaker Pelosi and Majority Leader Schumer for their continued work in advancing this legislative package, and congratulate President Biden for spearheading this historic advancement in American economic leadership. The finished product will be a major win for American workers, consumers, and manufacturers alike.”

###

Trade Fact of the Week: Florida’s sea turtle nest counts are growing

FACT:

Florida’s sea turtle nest counts are growing.


THE NUMBERS: 

Average counts of green turtle nests at 27 Florida “core index beaches,” two-year average*

2020-2021    ~23,000 nests
2010-2011     ~10,000 nests
2000-2001    ~4,000 nests
1990-1991      ~1,000 nests

* Florida Wildlife Commission; using two-year averages as green turtle nesting totals appear to vary in a two-year cycle.  These are not total statewide (or U.S.) nesting estimates; they are counts of nesting at 27 long-studied beaches, representing about 10% of the known Florida nesting beaches.

WHAT THEY MEAN:

Here’s a good idea:  Somewhere around 320 B.C., proto-conservationist Mencius offers King Hui of Liang (near present-day Kaifeng) a simple solution to a complex problem:

“If you ban nets with fine mesh from ponds, there will be more fish and turtles than the people can eat.  If you ban axes from the forests on the hillsides except in the proper season, there will be more timber than the people can use.”  

Twenty-three centuries later, and in the ocean rather than in ponds, all seven sea turtle species are “endangered,” “threatened,” or “critically endangered.” As large, armored reptiles with few natural predators, these turtles are very tough. Their nesting season this summer will be roughly the 150 millionth; the series has outlasted not only the last seven ice ages, but the end-of-Cretaceous asteroid that wiped out their early contemporaries the ammonite and the plesiosaur.

But maybe they are no longer tough enough. Some are caught and traded for shell jewelry.  Many more fall victim to “by-catch,” as shrimp and fishing fleets suck them into bag-shaped shrimp trawl nets or catch them on long lines meant for shark and tuna.  And many more, with beach erosion and harvesting of nests for eggs, never hatch at all.  This series of losses accelerated in the mid-20th century; to take one example, the global estimate of nesting leatherback females done by the International Union for the Conservation of Nature dropped from about 90,000 in 1980 to 54,000 in 2010.

How to respond?  Sea turtle protection in the United States may, tentatively, be succeeding, with a mix of three measures:

(1)    Trade restriction:  The 184 countries and territories in the Convention on International Trade in Endangered Species, the world’s first international trade-and-environment agreement, listed all sea turtles in ‘Appendix I,’ in the 1980s, banning trade in turtle jewelry and other products.

(2)    By-catch reduction:  To reduce by-catch, the United States in 1987 banned sale or import of shrimp caught by boats which do not use Turtle Excluder Devices or “TEDs.”  These are barred metal grills — something like the wide meshes like those Mencius recommended for fishnets in ponds — placed in the neck of the bag-shaped shrimp nets to let mistakenly captured turtles swim out.  They cost about $375.  Each summer, the State Department publishes a list of countries which, through compliance with this rule, can export ocean-caught shrimp to the U.S.  The most recent certifies 41 countries and territories as “equivalent” to the U.S. in turtle protection, and thus able to export wild-caught shrimp to the United States.

(3)    Beach protection:  National and state laws, and local regulations set aside beaches for nesting, and limit their use.  As an example, Florida’s Marine Turtle Conservation Act (passed in 1991 under then-Gov. Lawton Chiles) bars over-building, lighting schemes that can disorient hatchlings in season, and disruption of nesting by tourists.

Does it work?  Tentatively, yes.  Florida’s green turtle population is a case in point:  while totals vary up and down each year, Florida Wildlife Commission figures shows about 20 times as many nests in the 2020/2021 season as there were in the early 190s, when the national TED and Florida beach protection laws began.  Kemp’s Ridley turtle nesting levels (almost exclusively on a single stretch of Mexican beach, though with outposts in Texas and Cape Hatteras) are up from a near-extinction low of 200 in the 1980s to about 5000 a decade ago, and perhaps as many as 20,000 in 2020.  On a larger scale, the International Union for the Conservation of Nature’s estimate of leatherback nesting females has risen from 54,000 in 2010 to 64,000 as of 2020, and looks ahead under current population trends (driven by strong growth in Atlantic populations) to 79,000-110,000 by 2040.

Just a start, of course.  Hardly Mencius’ “more than you can eat”; and (as an example) the IUCN’s optimistic take on Atlantic leatherbacks is offset by continuing Pacific leatherback decline.  And apparently positive trends remain open to newer questions about rising ocean temperatures, acidification, plastics accumulation, and beach erosion as sea levels rise.  But this said, a promising start and some validation for Mencius’ rather old, still simple, and still good idea.

FURTHER READING


The Florida Wildlife Commission reports on nesting totals for five turtle species at “index beaches” from 1989 forward.

A worried World Wildlife Fund fact-sheet.

The IUCN has assessments for all seven sea turtle species; optimistic projections for the leatherback here.

Reports from:

Florida: UCF ponders growth in small-turtle nesting.

… and Fort Myers explains beach lighting rules in the May to October nesting season.

Hawaii: NOAA’s Pacific Islands office on hawksbills in Hawaii.

Texas: The National Park Service on Kemp’s Ridley nesting.

Australia: Australia’s Department of Agriculture, Water, and the Environment on flatback turtle conservation.

Oman: The Oman Times reports on green turtle nesting and tourism at Ras al-Hadd in Oman (certified as U.S.-equivalent in turtle protection).

Belize: Oceana reports on hawskbills.

Policy

The State Department announces 2021 shrimp trade certifications: Oman, Australia, Belize joined by Bahamas, Malaysia, Fiji, et al.

The CITES (Convention on the International Trade in Endangered Species) homepage.

Sea turtle protection page from the National Oceanic and Atmospheric Administration.

Litigation

A famous WTO dispute of the 1990s, “DS-58”, wound up validating the U.S. TED rule against complaints.

And last…

Mencius, with the brief passage on nets, excluder devices and turtles in Chapter A3.

In A New Voyage Round the World (1699), English professional navigator, part-time pirate, and amateur naturalist William Dampier discusses the massive Caribbean green turtle populations of the 17th century:

“I heard of a monstrous green turtle once taken at Port Royal in the Bay of Campeachy that was four foot deep from the back to the belly, and the belly six foot broad.  Captain Roch’s son, of about nine or ten years of age, went in it as in a boat on board his father’s ship, about a quarter mile from the shore.  … One thing is very strange and remarkable in these Creatures; that in the breeding-time they leave for two or three months their common Haunts, where they feed most of the year, and resort to other places only to lay their Eggs: and ‘tis not thought that they eat any thing during this Season: so both the He’s and the She’s grow very lean. … Altho’ multitudes of Turtles go from their common places of feeding and abode, to those laying eggs:  and at the time the Turtle resort to these places to lay their Eggs, they are accompanied by abundance of Fish, especially Sharks; the places that the Turtle then leave being at that time destitute of Fish, which follow the Turtle.”

Dampier’s New Voyage, with the turtle passage in Chapter 5.

ABOUT ED

Ed Gresser is Vice President and Director for Trade and Global Markets at PPI.

Ed returns to PPI after working for the think tank from 2001-2011. He most recently served as the Assistant U.S. Trade Representative for Trade Policy and Economics at the Office of the United States Trade Representative (USTR). In this position, he led USTR’s economic research unit from 2015-2021, and chaired the 21-agency Trade Policy Staff Committee.

Ed began his career on Capitol Hill before serving USTR as Policy Advisor to USTR Charlene Barshefsky from 1998 to 2001. He then led PPI’s Trade and Global Markets Project from 2001 to 2011. After PPI, he co-founded and directed the independent think tank ProgressiveEconomy until rejoining USTR in 2015. In 2013, the Washington International Trade Association presented him with its Lighthouse Award, awarded annually to an individual or group for significant contributions to trade policy.

Ed is the author of Freedom from Want: American Liberalism and the Global Economy (2007).  He has published in a variety of journals and newspapers, and his research has been cited by leading academics and international organizations including the WTO, World Bank, and International Monetary Fund. He is a graduate of Stanford University and holds a Master’s Degree in International Affairs from Columbia Universities and a certificate from the Averell Harriman Institute for Advanced Study of the Soviet Union.

Read the full email and sign up for the Trade Fact of the Week
Trade Fact of the Week: Energy accounts for 3/5 of Russian exports

FACT:

Energy accounts for 3/5 of Russian exports.


THE NUMBERS: 

Russia GDP (IMF estimates, currency-basis) 

2021    $1.7 trillion
2016    $1.3 trillion
2013    $2.3 trillion
2009    $1.3 trillion


WHAT THEY MEAN:

Most economies “grow” incrementally and undramatically (with occasional incremental dips in recessions).  Through productivity growth, investment, and slight rises in the populations of consumers and workers, they steadily add a couple of percentage points each year.  The Russian economy looks different: More like an inflating and deflating bellows, nearly doubling in size from 2009 to 2013, then contracting by nearly half over the next three years, and since 2016 another burst of growth.

Why?  The pattern reflects Russia’s exceptionally high dependence on energy production and energy sales.  According to the WTO’s Trade Profiles 2021, an annual country-by-country summary of imports, exports, partners and balances for 197 countries, “fuels and mining products” accounted for 59% of Russian exports in 2020.  This figure is quite large — among developed economies, only Norway’s is higher — and likely understates the actual role of energy in Russian trade.  The WTO lists Russia’s top four exports in 2020 as:

Crude oil, $122 billion;
Refined petroleum products, $67 billion;
Coal, $16 billion; and
Natural gas, $10 billion.

These four products combine for $215 billion, or 65% of $332 billion in total Russian goods exports that year, with the “refined petroleum products” category, presumably including include some goods classified as manufactures rather than primary “fuels and mining” products.  Overall, Russia was the world’s second-ranking exporter of these goods; the U.S. ranked second, but with energy making up a much smaller 15% of the U.S.’ $1.4 trillion in exports.

Two frequent consequences of this level of dependence on energy sales:

(1)    Countries this reliant on energy and metal ore exports are economically volatile — they boom when world prices rise and crash when prices fall — unless they have especially sophisticated ways of banking excess resource rents in good years.  Thus the odd pattern of Russian GDP.  With large shares of GDP and government revenue coming through a small group of companies and individuals, they also frequently (though again not always) develop political systems centralized around a few government officials and top executives of state or quasi-private enterprises.  The Russian examples are Gazprom, Rosneft, Lukoil, and a few similar organizations.

(2)    Their customers need to diversify sources, so as to avoid reliance on potentially unstable partners.  Paul Bledsoe examines this question in PPI’s most recent energy and climate paper, reviewing the implications of Western and Central European reliance on Russian natural gas for heating and electricity.  He suggests an important place for the United States as an alternative source for European energy needs:

“New sources of gas, including liquefied natural gas (LNG) imports from the United States and other clean sources, can reduce the EU’s reliance on methane-heavy Russian gas. But of course, that will require the United States and other exporters to drive down methane and carbon dioxide emissions from the lifecycle as close to zero as possible, and verify their reductions with credible methodologies.  Moreover, the geopolitical costs of Russian gas continue to plague the EU broadly, and Ukraine and other Eastern European nations specifically. EU imports of Russian gas have actually increased since Moscow’s illegal annexation of the Crimea in 2015. Over time, limiting Russian gas imports thus could diminish its political leverage over Europe while also helping the EU achieve its climate goals.”


Don’t miss this PPI report by Paul Bledsoe

The report covers natural gas, Atlantic economics, and European security. Read it below:


FURTHER READING

Read PPI’s Bledsoe on natural gas, Atlantic economics, and European security here.

And read this from PPI President Will Marshall on the Biden administration, Putinist threats, and re-anchoring American foreign policy in liberal and democratic values.

Data 

The World Bank’s Russia Economic Report can be found here.

The WTO’s World Trade Profiles has exports/imports/partners by country for 197 economies can be found here.

Background reading

Anna Politkovskaya’s essay collection “Putin’s Russia: Life in a Failing Democracy,” on Russian life and politics circa 2005:

The State Department’s European and Eurasian Affairs Bureau can be found here.

The European Union is Russia’s main trading partner, buying 41% of Russian exports and providing 34% of Russian imports in 2020. Read about the EU’s Moscow mission.

The Ukrainian Embassy in D.C., can be found here.

Read about Russian gas giant Gazprom.


ABOUT ED

Ed Gresser is Vice President and Director for Trade and Global Markets at PPI.

Ed returns to PPI after working for the think tank from 2001-2011. He most recently served as the Assistant U.S. Trade Representative for Trade Policy and Economics at the Office of the United States Trade Representative (USTR). In this position, he led USTR’s economic research unit from 2015-2021, and chaired the 21-agency Trade Policy Staff Committee.

Ed began his career on Capitol Hill before serving USTR as Policy Advisor to USTR Charlene Barshefsky from 1998 to 2001. He then led PPI’s Trade and Global Markets Project from 2001 to 2011. After PPI, he co-founded and directed the independent think tank ProgressiveEconomy until rejoining USTR in 2015. In 2013, the Washington International Trade Association presented him with its Lighthouse Award, awarded annually to an individual or group for significant contributions to trade policy.

Ed is the author of Freedom from Want: American Liberalism and the Global Economy (2007).  He has published in a variety of journals and newspapers, and his research has been cited by leading academics and international organizations including the WTO, World Bank, and International Monetary Fund. He is a graduate of Stanford University and holds a Master’s Degree in International Affairs from Columbia Universities and a certificate from the Averell Harriman Institute for Advanced Study of the Soviet Union.


Read the full email and sign up for the Trade Fact of the Week

Trade Fact of the Week: The U.S. Generalized System of Preferences program has been expired for more than a year

FACT:

The U.S. Generalized System of Preferences program has been expired for more than a year.


THE NUMBERS: 

GSP imports, 2020 –

tons of Ukrainian pickles
3,700 traditional Mongolian ger (nomadic living tents)
11,900 liters of Georgian wine
1.5 tons of Pakistani spice mix
$5 million in Namibian stonework
412 tons of taro root from Tonga and Samoa
90,000 Rwandan travel bags
492 tons of Fijian ginger (candied and sushi-grade)
1 million dog collars and leashes from Cambodia
14,000 Senegalese wicker baskets
15 tons of vegetable oil from Timor-Leste
$9.5 million in Armenian-made golden jewelry
217 tons of South African essential oils (eucalyptus, orange, lemon, grapefruit)
27.3 million Thai orchids
870,000 Haitian-woven flags
32,700 Bolivian-made wooden doors


WHAT THEY MEAN:

The U.S.’ oldest and largest effort to help the poor abroad is the “Generalized System of Preferences”, or “GSP” for short.  Dating to 1974, it waives tariffs on about 3,500 types of products (more precisely, on 3,500 “tariff lines”) from 119 low- and middle-income countries meeting 15 eligibility criteria covering cooperation against terrorism, labor standards, intellectual property, expropriation, trade policy, and other issues.  The law authorizing GSP benefits lapsed at the end of 2020, so for a year the program has been stopped.  As Congress works on renewal, PPI Vice President Ed Gresser – who among other things directly oversaw GSP system administration from 2015-2020 – has observations and ideas in PPI’s newest policy paper:


By way of background, GSP is fairly simple. By waiving U.S. tariffs – 7.0% on flags, 9.6% on pickles, 2.3% on fresh taro root, etc. – imposed on things made or grown in places like Haiti, Ukraine, and the Pacific Islands, it encourages buyers otherwise drawn to the EU, China, or other larger suppliers to these smaller and poorer countries, helping them diversify their economies and create better job opportunities. Australia, EU, Canada, Japan, and other high-income countries have their own GSP programs launched around the same time as the U.S. GSP; other countries such as China, Taiwan, Chile, and Korea have created their own similar systems more recently.

The program’s scale is modest.  Imports of variously picturesque and mundane GSP products totaled $16.9 billion in 2020 – 0.8% of the U.S.’ $2.351 trillion in total goods imports, and (more relevant) 11.1% of the $152 billion in imports from the 119 participating countries – but the impact is useful.  Reviewing the results in 2016 (along with those of regional preference programs AGOA and CBI) the Obama administration concluded that “U.S. trade preference programs have encouraged exports from developing countries, with particular effect in value-added and labor-intensive goods … This is corroborated by a large body of economic literature [which has] also found that U.S. trade preference programs have made a contribution to the reduction of poverty.”

Gresser’s paper applauds Congressional interest in renewing the system – the Senate has passed a reauthorization bill and House Democrats have introduced one which differs in some areas from the Senate bill but shares much with it – noting that reauthorization will be good for the countries participating in the system and, in a small but tangible way, for the Biden administration’s effort to show that America “is back”.  It also endorses Congress’ interest in rethinking aspects of the program.  GSP’s list of “eligibility criteria” (that is, a set of policy goals a country needs to meet to qualify for tariff waivers) mainly dates to the 1970s and 1980s.  So does its list of “import-sensitive” products excluded as overly competitive with U.S. goods and its “Competitive Need Limits” on the levels of particular products a country is allowed to send duty-free.  All these could probably use a fresh look.

On the other hand, the paper expresses concern about a large proliferation of new eligibility rules in both the Senate and House Democratic bills.  It argues for dialing this back a bit and balancing new rules with new product coverage (as a complementary proposal by Representatives Stephanie Murphy (D-Fla) and Jack Walorski (R-Ind) suggests).  Three thoughts as Congress moves ahead:

1.    Set priorities when adding new eligibility rules.

The current list of 15 eligibility criteria includes some moribund issues (“domination by the international Communist movement”), misses some contemporary concerns, and overall is a bit of a hodge-podge.  But it also has some virtues, including brevity: the list is short enough to set clear priorities, so governments of GSP countries know what they need to do to retain benefits.  Both reauthorization bills risk losing this virtue by adding many new criteria: human rights, poverty reduction, environment, gender policy, anti-corruption, economic reform, microcredit availability, political participation, rule of law, digital trade, and others.  Though all appear well-intended, expansion on this scale can overload a small system, and risk forcing wholesale unintended expulsions of countries which fall short on one or two of many criteria, or pushing administrations into unsystematic and essentially arbitrary enforcement to avoid such an outcome.

2.    Recognize good-faith effort.

A second virtue is that the current eligibility criteria are flexibly written, enabling officials administering the system to recognize good-faith if imperfect efforts to comply.  Overly strict rules for low-income countries can be unrealistic: “low-income countries often have well-trained and well-intentioned leaders and senior bureaucrats who design good policies … [but] few such countries have the deep and professional civil services needed to effectively [implement] these policies uniformly and nationwide.”  Whether adding new criteria or updating old ones, good-faith effort by well-intentioned governments should continue to get credit.

3.    Balance new eligibility rules with broader benefits. 

Finally, new looks at old eligibility rules should go together with new looks at old limits on benefits.  GSP rules set in the 1970s excludes some significant categories of goods (clothes, shoes, glassware, watches) and also, under an unusual feature known as “Competitive Need Limitations”, remove products from a country’s GSP portfolio when it becomes too good at making them.  The paper suggests reconsidering some of the product exclusions, for example that of shoes not made in the United States, and applauds the Murphy/Walorski proposal’s reforms to the ”Competitive Need Limitation” feature of GSP.

FURTHER READING

>> PPI’s Gresser on GSP Renewal – “Trade, the Poor, and America is Back” – Read the Report 

Background:

The U.S. Trade Representative’s GSP Guidebook explains GSP program goals, product coverage, eligibility rules, and country participation.

The Obama administration (2016) evaluates U.S. trade preference programs (including GSP and also the African Growth and Opportunity Act and the Caribbean Basin Economic Recovery Act) and their records on poverty alleviation.

Some beneficiaries:

The Embassy of Ukraine explains GSP benefits to potential U.S. customers.

The Fiji Sun reports on a U.S. official’s 2018 visit to a GSP-beneficiary ginger factory.

USTR presentation on benefits for Mongolia (tungsten concentrate, leather bags, pine nuts, traditional “ger” tents).

Ecuadoran Ambassador Ivonne Baki updates Quito press on GSP reauthorization.

… and a Delaware vendor of Mongolian “ger” (traditional tents).

Renewal proposals from:

Senate Finance Committee (included in larger bill and passed in 2021).

House Ways and Means Democrats.

Reps. Murphy & Walorski.

… and for comparison, the current GSP statute.

And some international comparisons: 

Japan’s Ministry of Foreign Affairs explains the Japanese GSP.

The European Union.

Australia.

China’s “least-developed country” tariff waiver.


ABOUT ED

Ed Gresser is Vice President and Director for Trade and Global Markets at PPI.

Ed returns to PPI after working for the think tank from 2001-2011. He most recently served as the Assistant U.S. Trade Representative for Trade Policy and Economics at the Office of the United States Trade Representative (USTR). In this position, he led USTR’s economic research unit from 2015-2021, and chaired the 21-agency Trade Policy Staff Committee.

Ed began his career on Capitol Hill before serving USTR as Policy Advisor to USTR Charlene Barshefsky from 1998 to 2001. He then led PPI’s Trade and Global Markets Project from 2001 to 2011. After PPI, he co-founded and directed the independent think tank ProgressiveEconomy until rejoining USTR in 2015. In 2013, the Washington International Trade Association presented him with its Lighthouse Award, awarded annually to an individual or group for significant contributions to trade policy.

Ed is the author of Freedom from Want: American Liberalism and the Global Economy (2007).  He has published in a variety of journals and newspapers, and his research has been cited by leading academics and international organizations including the WTO, World Bank, and International Monetary Fund. He is a graduate of Stanford University and holds a Master’s Degree in International Affairs from Columbia Universities and a certificate from the Averell Harriman Institute for Advanced Study of the Soviet Union.

Read the full email and sign up for the Trade Fact of the Week

Renew and Modernize the U.S.’ Trade and Development Program for Poor Countries, Argues PPI’s Ed Gresser

As Congress debates renewal of “GSP” – the Generalized System of Preferences, the U.S.’ largest trade and development program, which waives tariffs on 3500 products for 119 low- and middle-income countries, and requires periodic reauthorization – it is right to take a new look at an old program and update old eligibility rules; but it should also be careful to avoid adding too many new ones, and balance them with fresh looks at old product restrictions, explains a new paper from Progressive Policy Institute (PPI) Vice President of Trade and Global Markets Ed Gresser.

“It is fair to ask governments of countries whose businesses and workers receive duty-free benefits to meet basic requirements, and some of the proposed new criteria are good ideas,” writes Ed Gresser. “But overly long lists of new criteria are likely to create confusion as U.S. policy priorities clash, and could force wholesale expulsion of poorer countries whose capacity to implement policy is lower than that of middle-income countries. This latter risk is particularly troubling.”

Gresser argues that Congress should be commended for endeavoring to update GSP but adding many new eligibility rules without expanding product coverage (which neither of the two major reauthorization bills achieve) risks leaving the revised program less effective than the current version.
The paper makes the following recommendations, which allow for rebalancing the GSP system while eliminating U.S. policy conflict and the exclusion of poor countries with weak capacity:

  • Set a limited number of priorities, by adding several important new issues (for example, environmental policy) to the current list of 15 eligibility criteria, but restraining the number of new criteria.
  • Make these priorities achievable for countries with good will but limited means and capacity.
  • Simplify, by defining some proposed new criteria as “advisory” issues to consider, rather than requirements countries must meet, and clarify that to the extent possible, enforcement of criteria should not endanger the interests of the people the criteria aim to support.
  • Add balancing new benefits, for example a reform of CNL rules proposed by Representatives Stephanie Murphy (D-Fla.) and Jackie Walorski (R-Ind.), and inclusion of some products currently barred from GSP.


Read the paper and expanded policy recommendations here:

Ed Gresser is Vice President and Director for Trade and Global Markets at PPI. He most recently served as the Assistant U.S. Trade Representative for Trade Policy and Economics at the Office of the United States Trade Representative (USTR).

The Progressive Policy Institute (PPI) is a catalyst for policy innovation and political reform based in Washington, D.C. Its mission is to create radically pragmatic ideas for moving America beyond ideological and partisan deadlock. Learn more about PPI by visiting progressivepolicy.org.

###

Media Contact: Aaron White – awhite@ppionline.org

Trade, The Poor, and “America is Back”: A Friendly Critique of Congress’ GSP Renewal Bills, with Some Ideas on Improving Them

INTRODUCTION

Should the United States help the poor abroad?  If so, how much?  Should we ask something of their governments in exchange?  And what if we ask something the governments can’t fully do?  These are the core questions as Congress discusses renewal of the Generalized System of Preferences.

This system, known for short as “GSP,” is the U.S.’ largest trade and development program.  Dating to 1974, it waives tariffs on about 11% of imports from 119 low- and middle-income countries and territories, so as to encourage U.S. buyers to source some products from them rather than larger, wealthier economies.  Balancing these benefits, it imposes some eligibility rules, for example asking “beneficiary countries” to take steps toward enforcement of labor rights, intellectual property, and other matters.

GSP lapsed at the end of 2020, and thus has provided no benefits in over a year.  Both parties in Congress appear in principle to support its renewal.  The Senate has passed a bipartisan reauthorization bill (endorsed as well by House Republicans); and while the House is divided by party on several specific issues, actual opposition seems scarce.  Assuming one believes the U.S. should try to help the poor, this is good news — for countries enrolled in GSP, for the workers and businesses that draw the benefits, and also, in a small but tangible way, for the Biden administration’s effort to show that America “is back” and has not slumped into inward-looking passivity or resentment.

On the other hand, the renewal bills share a weakness: they try to make a small program do too much.  GSP is somewhat old and creaky.  Its product coverage is limited by product exclusions and “Competitive Need Limitation” (CNL) rules dating to the 1970s, and its eligibility criteria have remained unchanged since the late 1990s.  Both could be better.  But most of Congress’ work appears to have gone into adding new eligibility rules, and neither bill proposes adding anything to GSP’s relatively modest list of goods eligible for tariff waivers.  It is fair to ask governments of countries whose businesses and workers receive duty-free benefits to meet basic requirements, and some of the proposed new criteria are good ideas.  But overly long lists of new criteria are likely to create confusion as U.S. policy priorities clash, and could force wholesale expulsion of poorer countries whose capacity to implement policy is lower than that of middle-income countries.  This latter risk is particularly troubling, since some new proposals appear so strict that few if any low-income countries could meet them.

So while Congress deserves applause for an apparent intent to renew the program, and willingness to take a fresh look at old rules, there is reason for concern that the updated program may achieve less than the old.  Congress should therefore think about (a) how much it wants to add, and (b) a balance between new criteria and new export opportunities.  Some relatively simple revisions could help:


  1. Set a limited number of priorities, by restraining the number of new criteria in the system.
  2. Make these priorities achievable for countries with good will but limited means and capacity.
  3. Simplify, by defining some proposed new criteria as “advisory” issues to consider, rather than requirements countries must meet, and clarify that to the extent possible, enforcement of criteria should not endanger the interests of the people the criteria aim to support.
  4. Add balancing new benefits, for example through a reform of CNL rules proposed by Representatives Stephanie Murphy (D-Fla.) and Jackie Walorski (R-Ind.), and inclusion of some products currently barred from GSP.


READ THE FULL PAPER:


Trade Fact of the Week: World GDP will top $100 trillion for the first time in 2022

FACT:

World GDP will top $100 trillion for the first time in 2022.


THE NUMBERS: 

$102 trillion     World GDP (currency-basis), 2022
$480 trillion     World individually held wealth, 2022


WHAT THEY MEAN:

How much is “all the money in the world”?  And where is it?

Guessing at the economic outlook last October, the International Monetary Fund projected global growth of 4.9% for 2022. This would be a jump of about $8 trillion from 2021’s $94 trillion in total world GDP, for the first time bringing this total above $100 trillion.  Of this, $60 trillion reflects the output of “advanced economies” — meaning the U.S., Canada, U.K., EU, Norway, Iceland, Switzerland, Japan, Korea, Australia, New Zealand, Taiwan, Hong Kong, and Singapore — with the rest of the world combining for the other $42 trillion. By country, about two-thirds of this represents the output of 12 countries:

COUNTRY     WEALTH OUTPUT
U.S.                 $24.8 trillion
China               $18.5 trillion
Japan                 $5.4 trillion
Germany            $4.6 trillion
U.K.                    $3.4 trillion
India                   $3.3 trillion
France                $3.1 trillion
Canada               $2.2 trillion
Brazil                   $1.8 trillion
Russia                 $1.7 trillion
Australia              $1.7 trillion
Mexico                 $1.6 trillion
All other            $30.3 trillion

Regionally, the IMF projects Latin America’s “GDP” at $5 trillion, the Middle East’s $4 trillion, and sub-Saharan Africa’s $2 trillion; its guess for the fastest-growing areas are developing Asia at 5.8%, the Middle East at 4.1%, and Africa at 3.8%. Overall, the long-term trend has been for “developing” regions to catch up toward traditionally wealthy ones, though much of this reflects the growth of China specifically. This is even more true with the alternative “purchasing power parities” method of estimating GDP, which tries to standardize the value of locally purchased goods and services; it yields a world GDP at $153 trillion for 2022, with China the largest economy at $29 trillion.

Another approach, less complete but suggesting a somewhat different pattern, comes from Credit Suisse’s annual “Global Wealth Report.”  This tries to calculate the value of individually held assets — houses, bank accounts, cars, property, stock holdings, etc. — and sums them all up to $418 trillion worldwide as of the end of 2020.  This total is rising by about 6% or 7% per year, suggesting that in 2022 the “global wealth” of individuals might be $480 trillion. This report doesn’t include a lot of valuable things, though — say, government assets such as buildings, roads and bridges, and national parks, or corporate assets like the value of entertainment industry intellectual property or the commercial airplane fleet, vehicles — and also leaves out the assets of about 2 billion of the world’s poor.  Were such things included, this version of the “all the money in the world” figure might easily be close to $1 quadrillion.

By country and region, this wealth estimate tilts more toward “advanced economies” than the IMF’s GDP projections.  By Credit Suisse’s count, the largest ones (using their 2020 figures rather than trying to extrapolate the 2022 levels) are:

COUNTRY   WEALTH ESTIMATE
U.S.                 $126.3 trillion
China                 $74.9 trillion
Japan                 $26.9 trillion
Germany            $18.3 trillion
France                $15.0 trillion
U.K.                     $15.3 trillion
India                    $12.8 trillion
Canada                $9.9 trillion
Australia               $9.3 trillion
Korea                    $9.0 trillion

Where the IMF’s GDP projections find a narrowing gap between traditionally rich countries and the rest of the world, Credit Suisse’s wealth estimates suggest an at least temporarily widening one.  It notes a worldwide increase in wealth of about 6.0% in 2020.  What with rising home values and stock indexes, the jumps in North America and Europe were 9.1% and 9.8% specifically, meaning that these regions accounted for three-quarters of the world’s wealth growth that year.


FURTHER READING

The IMF’s World Economic Outlook database, released last October; the next update comes in April.

For a quick study on currency-basis vs. PPP-basis GDP, the IMF has an explanation here.

The Credit Suisse Global Wealth Report 2021 can be read here.

More on wealth “per capita”: By Credit Suisse’s measurement, the world’s richest people cluster conveniently around C.S.’ Zurich headquarters. Switzerland tops the world at $679,000 in wealth per person.  The United States ranks second at $505,000, followed by Hong Kong, Australia, and Denmark. (They toss out small tax havens such as Liechtenstein and Luxembourg, as too difficult to estimate.)  On the other hand, Credit Suisse’s figures find the U.S. total warped upward by a relatively few extremely wealthy people.  Using the wealth of the “median” adult rather than the “mean,” America places 23rd in the world with $79,000 per person, and Australia leads the world at $238,000 for the median.  Putting some names to this, a list maintained by Forbes Magazine of the world’s 100 wealthiest people reports that 9 of the top 10 are Americans, together holding $1.6 trillion.

Treasury Secretary Yellen (April 2021) on the Biden administration’s view of the global macroeconomic outlook and next policy steps.

A book recommendation: Diane Coyle’s “GDP: An Affection History” examines the history of the GDP concept, what it tells you, and some of the things it can’t help with.


ABOUT ED

Ed Gresser is Vice President and Director for Trade and Global Markets at PPI.

Ed returns to PPI after working for the think tank from 2001-2011. He most recently served as the Assistant U.S. Trade Representative for Trade Policy and Economics at the Office of the United States Trade Representative (USTR). In this position, he led USTR’s economic research unit from 2015-2021, and chaired the 21-agency Trade Policy Staff Committee.

Ed began his career on Capitol Hill before serving USTR as Policy Advisor to USTR Charlene Barshefsky from 1998 to 2001. He then led PPI’s Trade and Global Markets Project from 2001 to 2011. After PPI, he co-founded and directed the independent think tank ProgressiveEconomy until rejoining USTR in 2015. In 2013, the Washington International Trade Association presented him with its Lighthouse Award, awarded annually to an individual or group for significant contributions to trade policy.

Ed is the author of Freedom from Want: American Liberalism and the Global Economy (2007).  He has published in a variety of journals and newspapers, and his research has been cited by leading academics and international organizations including the WTO, World Bank, and International Monetary Fund. He is a graduate of Stanford University and holds a Master’s Degree in International Affairs from Columbia Universities and a certificate from the Averell Harriman Institute for Advanced Study of the Soviet Union.

Read the full email and sign up for the Trade Fact of the Week

 

Trade Fact of the Week: 49 of the world’s 100 tallest buildings have opened in the last 5 years

FACT:

49 of the world’s 100 tallest buildings have opened in the last five years. 


THE NUMBERS: 

World’s tallest buildings*, 2600 BCE to present

YEAR          BUILDING HEIGHT
2010           2,716 feet (Burj Khalifa, UAE)  
2004         
1,666 feet (Taipei 101, Taipei)
1998           1,482 feet (Petronas Towers, Kuala Lumpur)
1974           1,450 feet (Sears Tower, Chicago)
1972           1,368 feet (World Trade Center, New York)
1931            1,250 feet (Empire State Building, New York)
1930           1,046 feet (Chrysler Building, New York)
1913               792 feet (Woolworth Building, New York)
1908              612 feet (Singer Building, New York)
1901               548 feet (City Hall, Philadelphia)
1311                525 feet? (Lincoln Cathedral, UK)
~2550 BCE    481 feet (Great Pyramid, Egypt)


WHAT THEY MEAN:

Stone buildings can’t get much above 500 feet, since the weight of the upper tiers will crack and break the load-bearing pillars and walls beneath.  This is why the 481-foot Great Pyramid outside Cairo held the world’s-tallest-building title for 3,800 years, until topped by a few slightly higher Gothic cathedrals in the 13th century. The cathedrals in turn held their lead until the early 20th century — unless you count free-standing towers like the 555-foot Washington Monument (1884) or 986-foot Eiffel Tower (1889) — when Chicago engineers devised the steel-skeleton frame, using curtain walls held in place by steel girders to add another 750 feet of space, metal, and glass.

Computer-aided design and new alloys — for example, twisting facades to minimize wind torque, and lightweight cladding to resist heat — enabled another jump during the 1990s. The results accelerated in the last decade with a bloom, or rash, of ultra-high skyscrapers at 1500 feet and above, mostly in Asia and the Arabian Peninsula. As 2022 begins, 49 of the world’s 100 tallest buildings, and four of the top ten, have opened since 2017. Only 13 20th century buildings remain among the top 100, and only four opened before 1990.  Eleven-year-old Burj Khalifa in Dubai remains largest of all, more than a half-mile tall at 2,717 feet or 828 meters. By location, the top 100-list maintained by the New York-based Council on Tall Buildings and Urban Habitat breaks down as follows:

  • China: 45 of the top 100 and five of the top 10, including second-place Shanghai Tower (2015) at 2,073 feet and fourth-place Ping An Tower in Shenzhen (2017).  Hong Kong adds five more.
  • United Arab Emirates: 17, with Burj Khalifa’s 2,716 feet basically one old skyscraper’s height above the Shanghai Tower. Saudi Arabia’s competing “Kingdom Tower,” aiming for more than 1,000 meters (3,281 feet), stalled out at 1000 feet in 2018 after a contract dispute.
  • United States: 15, including 7 in New York — One World Trade Center, at 1,776 feet, is the world’s sixth-highest — along with 5 in Chicago, and one each in Philadelphia and Los Angeles.
  • The rest: 18, including five in Russia, four in Malaysia, four in Korea, two in Taiwan, and one each in Vietnam, Kuwait, and Saudi Arabia.

Once unrivalled in the count of very high buildings, the U.S. now ranks third. The American intellectual role in skyscraper design and construction, though, remains central.  Specialized U.S. architecture firms in Chicago, New York, New England, and California remain at the core of worldwide tall building design, having designed seven of the current top ten and 24 of the 49 most recent entries to the list.


Burj Khalifa in the UAE stands at 2,716 feet.


FURTHER READING


New York’s Council on Tall Building and Urban Habitat lists the world’s 100 tallest buildings.

Burj Khalifa features 160 floors, a spiral shape to minimize wind torque on the upper levels, specialized glass and heat-resistant glazed aluminum/stainless steel cladding on the outer walls.

San Francisco-based Gensler designed the 2,073-foot Shanghai Tower, with “sky gardens” on the 37th of its 127 floors. BEA unromantically considers this an export of “architectural services”; in this sense, U.S. exports average about $900 million per year, against $135 million in imports. Read more from Gensler on the Shanghai Tower.

One World Trade Center (2014), at 1,776 feet, ranks sixth worldwide (pictured below).


Is China slowing down? Central government puts a cap on ultra-tall, weird, or “xenocentric” buildings.

A brief survey of three earlier tall-building eras:

1. Pyramids & Ziggurats, Middle East, 2600 BCE to 2000 BCE:  Pyramid-building began with Djoser’s 203-foot Step Pyramid around 2650 BCE and peaked a century later with Khufu’s 481-foot Great Pyramid.  Just outside modern Cairo, this building held the world’s-tallest-building title for 3,800 years, even if nobody was around to measure and compare. Not just a lame pile of rocks, the G.P. is a “smart pyramid” with a complex interior design of chambers, tunnels, and ventilation shafts meant for practical, religious, and perhaps astronomical purposes, all pointing to sophisticated architectural drafting and engineering as well as lots of donkeys and human labor. The slightly younger ziggurats in neighboring Sumer and Akkad were made of brick. The squishier material means they couldn’t be as tall, and topped out at about 170 feet, with small temples on top.

Egypt’s Great Pyramid homepage can be found here.

The Ziggurat of Ur is solid brick all the way through, with a (long-vanished) moon goddess temple on top, built around 2100 BCE per order of Sumerian King Ur-Nammu.  Read more from Iraq Heritage.

Book recommendation: The Babylon ziggurat “Etemanki” supposedly had “hanging gardens”, like the Shanghai Tower but open-air. Herodotus describes the ziggurat — eight tiers also with a temple on top — but doesn’t mention any gardens.  British Assyriologist Stephanie Dalley investigates, and concludes that they probably existed but were somewhere else.

2. Gothic Cathedrals, Europe, 1200 to 1400: “It was as though the world had shaken herself and cast off her old age, and clothed herself everywhere in a white garment of churches…”  Large buildings with enormous glass windows, hundred-foot stone pillars, and flying buttresses to relieve stress on load-bearing walls.  Designed without printing presses, standardized weights and measures, or mathematics beyond flat-plane geometry, cathedrals overtook pyramids in the 14th century and with the exception of Philadelphia’s 548-foot City Hall (1901) remain the world’s tallest stone-on-stone buildings. Lincoln Cathedral, completed in 1311, is said to been the highest Gothic cathedral, with a central spire rising to 525 feet. But the spire fell down in 1549 so we can’t be sure. The largest one still standing is Germany’s 512-foot Ulm Cathedral.

Read about the Ulm Cathedral.

Read about Abbot Sugar and the 12th-century Gothic boom.

3. Skyscrapers, United States, 1908 to 1974: Steel-skeleton buildings surpassed cathedrals with the completion of the Singer Building (referring to the sewing machine company, not the arts) in New York City in 1908. The Otis hydraulic elevator system made sure people could get to the top floors, and architects devoted occasional floors to water tanks and pumps so penthouse suites and executive offices could get toilets that flush and faucets that spout water rather than sucking air. Woolworth quickly overtopped Singer, Chrysler hit 1,000 feet in 1930, then the Empire State Building in 1931.

Read more about the Empire State Building.

Chicago’s William LeBaron Jenney, a Union army engineering corps vet, and Paris-trained architect, designed the first girders-and-curtain wall “skyscraper” — the 180-foot Home Insurance Building on South LaSalle, demolished to make way for the Field Building in 1931.


ABOUT ED

Ed Gresser is Vice President and Director for Trade and Global Markets at PPI.

Ed returns to PPI after working for the think tank from 2001-2011. He most recently served as the Assistant U.S. Trade Representative for Trade Policy and Economics at the Office of the United States Trade Representative (USTR). In this position, he led USTR’s economic research unit from 2015-2021, and chaired the 21-agency Trade Policy Staff Committee.

Ed began his career on Capitol Hill before serving USTR as Policy Advisor to USTR Charlene Barshefsky from 1998 to 2001. He then led PPI’s Trade and Global Markets Project from 2001 to 2011. After PPI, he co-founded and directed the independent think tank ProgressiveEconomy until rejoining USTR in 2015. In 2013, the Washington International Trade Association presented him with its Lighthouse Award, awarded annually to an individual or group for significant contributions to trade policy.

Ed is the author of Freedom from Want: American Liberalism and the Global Economy (2007).  He has published in a variety of journals and newspapers, and his research has been cited by leading academics and international organizations including the WTO, World Bank, and International Monetary Fund. He is a graduate of Stanford University and holds a Master’s Degree in International Affairs from Columbia Universities and a certificate from the Averell Harriman Institute for Advanced Study of the Soviet Union.

Read the full email and sign up for the Trade Fact of the Week
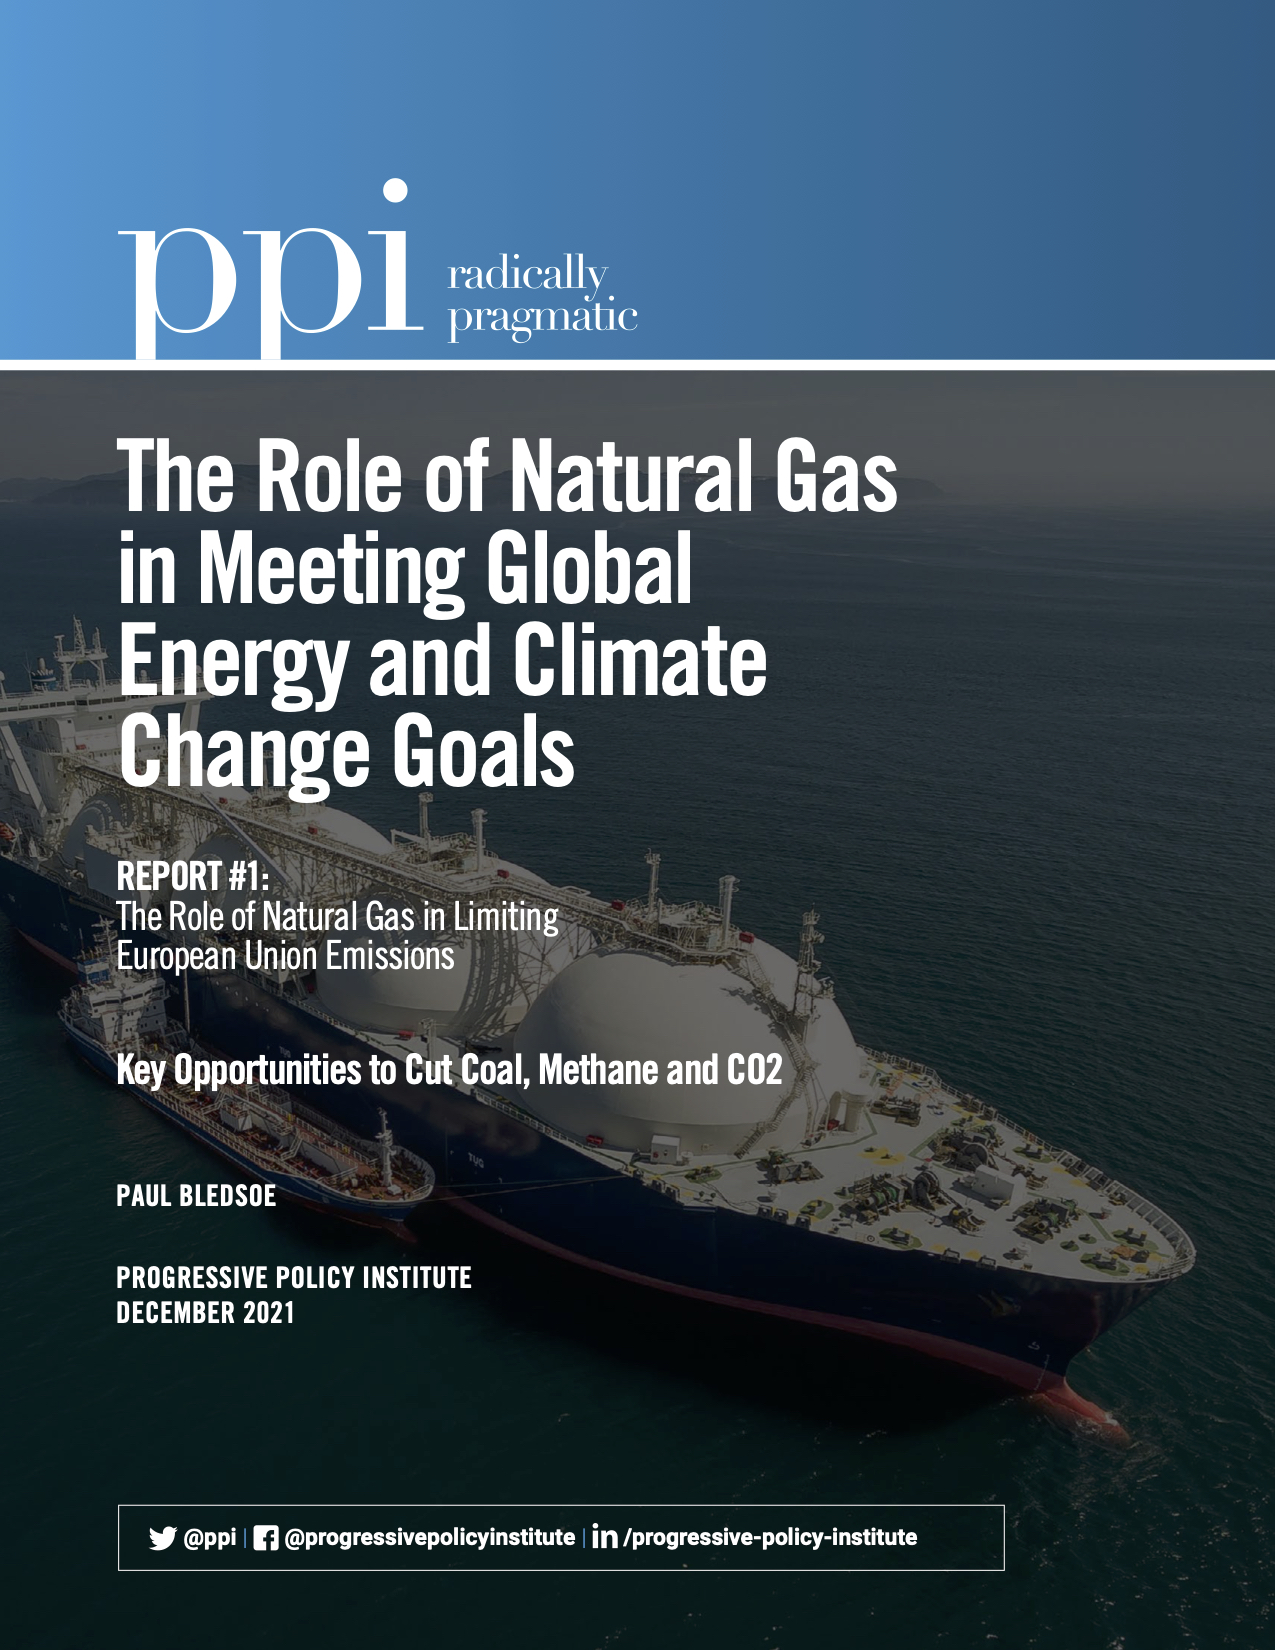
 

Trade Fact of the Week: Remittances from overseas workers to poor and middle-income countries are double the size of all foreign aid programs

FACT:

Remittances from overseas workers to poor and middle-income countries are double the size of all foreign aid programs.


THE NUMBERS: 

Central American GDP and international income, 2020

$200 billion       GDP
 $45.6 billion     Exports
 $25.3 billion*    Remittances from migrants
   $1.6 billion      Foreign aid
   $3.4 billion     Foreign Direct Investment

* Assuming about 95% of remittances to Central America came from the U.S. in 2020, as the World Bank has estimated for 2017 (most recent year available).


WHAT THEY MEAN:

Who changes the world? Governments, intellectuals, scientists, entrepreneurs, NGOs, and charities? Doubtless they do their part. But do not discount the power and generosity of humbler, less celebrated people. An example:

Small banks and wire services in Central American neighborhoods around the U.S. are busy this week, as Christmas money flows south from places like Maryland’s Wheaton or LA’s Pico Union to Chalatenango, Intipuca, and La Union. World Bank research suggests that these “remittance” flows to the five Central American republics totaled $25 billion in 2021, with about 95% of this total coming from the United States. About $55 million will likewise move from the homes of security guards and drivers in New Zealand to small Pacific island towns in Tonga and Samoa; $11.6 billion will arrive from the Gulf states to places like Medan and Dhaka, sent by Indonesian and Bangladeshi maids, clerks, nurses, and construction workers.

How significant is this? Three ways to answer the question:

(1)    In the economic lives of recipient countries, sometimes very large. Central America joins the Pacific Islands, Central Asia, and the Caribbean among the world’s most remittance-reliant regions, and so provides an illustrative (if somewhat extreme) example. The $25 billion in remittance flows at the north end of the wire make up about 12.5% of a $200 billion regional ‘GDP’ (combining Guatemala, El Salvador, Honduras, Nicaragua, and Costa Rica) with peaks of 24% of GDP for El Salvador and Honduras.  Meanwhile, in 2020 the five countries together (a) earned $45 billion from exports; (b) received about $1.6 billion in much-debated but relatively modest flows of foreign aid, and (c) received $3.4 billion in foreign direct investment from international businesses.  Thus at the macro end, remittances from migrant workers and their families rank below (but not far below) trade as a source of income, and are five times the combined value of aid and FDI.

Moving the lens back, the picture shifts but does not fundamentally change.  Twelve countries rely on remittances for more than 20% of GDP, with Tonga at 35% and then Somalia, Lebanon, South Sudan, Kyrgyzstan, Tajikistan, El Salvador, Honduras, Nepal, Haiti, Jamaica, and Lesotho.  If we combine all low- and middle-income countries (using the World Bank definition but excluding China, Russia, and EU members Bulgaria and Romania), trade is easily the largest earner, with remittances a fairly distant second and about equal to FDI and foreign aid combined:

$14,210 billion       GDP
$3,850 billion       Exports
$462 billion       Remittances
$267 billion       Foreign Direct Investment
$175-$250 billion*  Foreign Aid

* The aid total depends upon how one estimates Chinese aid programs.  The OECD reports $175 billion from OECD members, plus Saudi Arabia, the UAE, Taiwan, and several other non-OECD donors. The scale of Chinese aid programs is uncertain, but probably large, with private-sector estimates going up to a maximum of ~$80 billion depending on one’s definition of Belt and Road Initiative loans. 

(2)     From the donor perspective, quite a lot.  A Honduran-American population of about 1 million, for example, likely sent $5 billion in remittances this year.  The median income for adult workers, by a Pew Research estimate, is around $25,000, which suggests that workers spent as much as a fifth of their earnings on remittances.

(3)    From the recipient perspective, often of great value:  Remittances seem most valuable to the poor and lower-middle class.  Central America again provides some interesting examples.  About 20% of families in El Salvador families receive remittances.  A 2016 report for the Inter-American Development Bank reported that 70% of these recipients are women; that 47% live in rural provinces; that 70% have primary education or less, and that 79% are poor or “vulnerable”.

In this holiday season, one need not doubt the potential of thoughtful governments, energetic intellectuals and scientists, or entrepreneurs, NGOs and charities to change the world for the better.  But the populist force of quite humble communities of migrant workers — tens of millions of Salvadoran waitresses and construction workers, Filipina nurses, Indonesian maids, Haitian cooks and security guards, Nigerian taxi drivers and Jordanian accountants — looks to be at least their match.

Closing note:  PPI’s Trade Fact service will be closed next week and return in the New Year. We wish friends and readers a happy and peaceful holiday, grateful for our good fortune and mindful of those who have less.


FURTHER READING


Overview

The World Bank’s remittances page has figures by region and country for 2020; $701 billion in remittance flows, or about 1% of the world’s $75 trillion GDP.  Bank experts trace $471 billion back to the source, with $70 billion of this coming from the United States; by comparison, USAID reports $51 billion in official U.S. foreign aid.

The Inter-American Development Bank has a snapshot of Salvadoran remittance recipients (70% women, 47% rural, 70% with primary education or less, 79% poor or “vulnerable”).

The World Bank’s bilateral remittance tool, including figures for flows to and from all countries.

Pew Research has a statistical snapshot of Salvadoran-Americans and other Hispanic communities.


Countries & regions

The White House lays out its “root causes” program for Central American migration.

The Kingdom of Tonga (population 105,000, an hour’s flight southeast of Fiji when service is available) is the country most reliant on remittances, accounting for 48% of GDP, with money coming principally from New Zealand, the U.S., and Australia.

Miami-based Haitian Times on a COVID-era lifeline for Haiti.

$1 billion a year flows out of Hong Kong to recipients, many in the Philippines and Indonesia, read more about The Hong Kong Domestic Helpers Campaign.


For comparison: 

Exports: The WTO’s World Trade Statistical Review has export and import figures.

Aid: The OECD’s Development Assistance Council page details $175 billion from OECD members and other sources (though not China) in 2020 aid by recipient.

Aid: The U.S. Agency for International Development’s data dashboard has U.S. foreign assistance figures by country, project, and topic.

Investment: UNCTAD’s 2021 World Investment Report


ABOUT ED

Ed Gresser is Vice President and Director for Trade and Global Markets at PPI.

Ed returns to PPI after working for the think tank from 2001-2011. He most recently served as the Assistant U.S. Trade Representative for Trade Policy and Economics at the Office of the United States Trade Representative (USTR). In this position, he led USTR’s economic research unit from 2015-2021, and chaired the 21-agency Trade Policy Staff Committee.

Ed began his career on Capitol Hill before serving USTR as Policy Advisor to USTR Charlene Barshefsky from 1998 to 2001. He then led PPI’s Trade and Global Markets Project from 2001 to 2011. After PPI, he co-founded and directed the independent think tank ProgressiveEconomy until rejoining USTR in 2015. In 2013, the Washington International Trade Association presented him with its Lighthouse Award, awarded annually to an individual or group for significant contributions to trade policy.

Ed is the author of Freedom from Want: American Liberalism and the Global Economy (2007).  He has published in a variety of journals and newspapers, and his research has been cited by leading academics and international organizations including the WTO, World Bank, and International Monetary Fund. He is a graduate of Stanford University and holds a Master’s Degree in International Affairs from Columbia Universities and a certificate from the Averell Harriman Institute for Advanced Study of the Soviet Union.

Read the full email and sign up for the Trade Fact of the Week