Trade Fact of the Week: 1,400 satellites will go into orbit this year

FACT:

1,400 satellites will go into orbit this year.


THE NUMBERS: 

Satellites launched into orbit per year

1,400   2021

    115    2000-2010 average


WHAT THEY MEAN:

This month’s glamor rocket, rising next Wednesday from the Arianespace launch site in French Guiana, is an “Ariane 5”: a 170-foot tower weighing 780 tons and carrying 180 tons of liquid hydrogen/liquid oxygen fuel. Operated by the European Space Agency, its task is to lift the 44-foot, 7-ton, $9.7 billion James Webb Space Telescope off the Earth (pictured below), and direct it to “Lagrange 2,” a stable orbital a million miles from the Earth and well beyond the Moon. Successor to the Hubble, the Webb carries a 360-kilo, 21-foot-in-diameter mirror faced with ultra-polished beryllium, along with a set of four detection instruments designed at NASA’s Goddard Space Center in Maryland. For the next decade, these will analyze infrared radiation in hopes of understanding exoplanet atmospheres, observing star and galaxy formation, investigating “dark matter,” and examine the very early universe.

The Webb is very much in the Gemini, Apollo, Skylab, Voyager, and Mars Rover tradition: a government-led, big-science. international (NASA: the Webb is an “international collaboration among NASA, the European Space Agency (ESA), and the Canadian Space Agency (CSA) abstract-knowledge-and-benefit-of-humanity project. Around this newest example of a familiar tradition, however, are hundreds of illustrations of a quite different and much newer space concept — about 1,400 more satellite launches, the large majority by private-sector rocket companies carrying small satellites meant for very prosaic commercial use rather than scientific exploration or public policy. Examples from this month’s launch schedule include:

> RocketLab Electron, from Mahia in New Zealand, carrying two communications satellites for BlackSky’s earth observation satellite network. This provides imaging services via a network of two dozen small satellites — about 135 pounds, smaller than the 184-pound Sputnik satellite of 1957 — orbiting about 270 miles above the Earth.

> Virgin LauncherOne, launched not from a pad on the ground but from a converted Boeing 747 flown from California, carrying two “nano-satellites” weighing about 5 pounds for Polish firm SatRevolution (along with eight for the U.S military). SatRevolution eventually hopes for a network of 1,024 low-orbit nanosats providing imaging to agricultural, business, and government clients.

> Space Falcon 9 from Cape Canaveral, with 51 small satellites for SpaceX’s “Starlink” system, meant as part of a future network of 42,000 small satellites at 350 miles providing “video calls, online gaming, streaming, and other high data rate activities” to areas the global fiber-optic cable system that carries most Internet traffic does not reach, at a projected cost of $10 billion or so — that is, about the same as the Webb.

Wednesday’s launch, then, underlines the continuing strength and romantic appeal of the 65-year-old tradition of government-led, science-first space exploration. This year’s parallel launches of its hundreds of small private-sector cousins suggest that, for the first time, civilian commercial space industry now operates on the same scale.

* Official counts of satellites are surprisingly inconsistent. The UN’s count reports 8,089 man-made objects in orbit at the moment; the Union of Concerned Scientists says “more than 4,550.” Either way, adding 1,400 more in a single year is a lot.


FURTHER READING


NASA’s guide to the James Webb Space Telescope.

The EU’s Arianespace reports on progress toward launch.

The Canadian Space Agency’s guidance system and spectrographic instrument.


Private enterprise and civilian industry 


Calendar and count

Online journal Spaceflight Now tracks launches and payloads.

A United Nations index of 8,089 objects launched into space since 1957.


And last … 

As the Webb heads for its million-mile orbit and commercial satellite networks multiply, a burning question: Which generation-old sci-fi show saw the future best?  Two nominees:
  • “Boldly go”:  Deep space exploration, international cooperation, frontiers of knowledge, and the common good
  • “20 Minutes into the Future”:  Ubiquitous disposable low-orbit satellites, ruthless media competition, vast streams of addictive low-quality information, and social fracture


ABOUT ED

Ed Gresser is Vice President and Director for Trade and Global Markets at PPI.

Ed returns to PPI after working for the think tank from 2001-2011. He most recently served as the Assistant U.S. Trade Representative for Trade Policy and Economics at the Office of the United States Trade Representative (USTR). In this position, he led USTR’s economic research unit from 2015-2021, and chaired the 21-agency Trade Policy Staff Committee.

Ed began his career on Capitol Hill before serving USTR as Policy Advisor to USTR Charlene Barshefsky from 1998 to 2001. He then led PPI’s Trade and Global Markets Project from 2001 to 2011. After PPI, he co-founded and directed the independent think tank ProgressiveEconomy until rejoining USTR in 2015. In 2013, the Washington International Trade Association presented him with its Lighthouse Award, awarded annually to an individual or group for significant contributions to trade policy.

Ed is the author of Freedom from Want: American Liberalism and the Global Economy (2007).  He has published in a variety of journals and newspapers, and his research has been cited by leading academics and international organizations including the WTO, World Bank, and International Monetary Fund. He is a graduate of Stanford University and holds a Master’s Degree in International Affairs from Columbia Universities and a certificate from the Averell Harriman Institute for Advanced Study of the Soviet Union.

Read the full email and sign up for the Trade Fact of the Week


Johnson for The Hill: To tame inflation, Biden should cut tariffs

By Jeremiah Johnson

Despite a strong economy with unemployment falling and GDP rapidly growing, and despite steady progress on his ambitious agenda, President Biden’s popularity has fallen. Inflation is at a multi-decade high, and worries about the cost of food, gas and overall inflation are likely at the center of that dissatisfaction. Americans are concerned about the rising prices of the everyday things they need.

Biden is in a tough spot with regards to inflation. It’s not a realistic option to simply ignore it or tell voters not to worry about it. Blaming it on corporate greed, as Sen. Elizabeth Warren (D-Mass.) does, is self-evidently ridiculous (Did corporate greed disappear during all the years that inflation was low?) and doesn’t do anything to address the issue.

And while there are policies that can fight inflation, those often come with serious drawbacks. Fiscal and monetary policy responses are something Biden can’t do alone — those powers lie with Congress and with an independent Federal Reserve. And even if Biden could successfully pressure Congress and the Fed into anti-inflation policy, those policies often come with the side effect of slowing economic growth, something that no president wants to do. Luckily, there is a policy change that can be made without Congress and without harming growth — reducing tariffs.

Read the full piece in The Hill.

PPI’s Trade Fact of the Week: Women head 25 trade and commerce ministries.

FACT:

Women head 25 trade and commerce ministries.


THE NUMBERS: 

Women serving as Trade or Commerce Minister:

196   Countries and territories in CIA World Leaders Directory

25     Countries with Women as Trade/Commerce Ministers, December 2021

25     Countries with Women as Trade/Commerce Ministers, March 2010


WHAT THEY MEAN:

At some future date — perhaps next spring — the World Trade Organization’s 12th Ministerial Conference will convene after two COVID-forced postponements. Known for short as “MC-12,” the event will join the Trade Ministers of the 164 WTO members (in principle; in practice some don’t show, and some members don’t have trade or commerce ministries) in hopes to agree on fishery subsidy reform, trade and health, and institutional reform. Whenever it meets, and whatever the outcomes, two things are for certain:

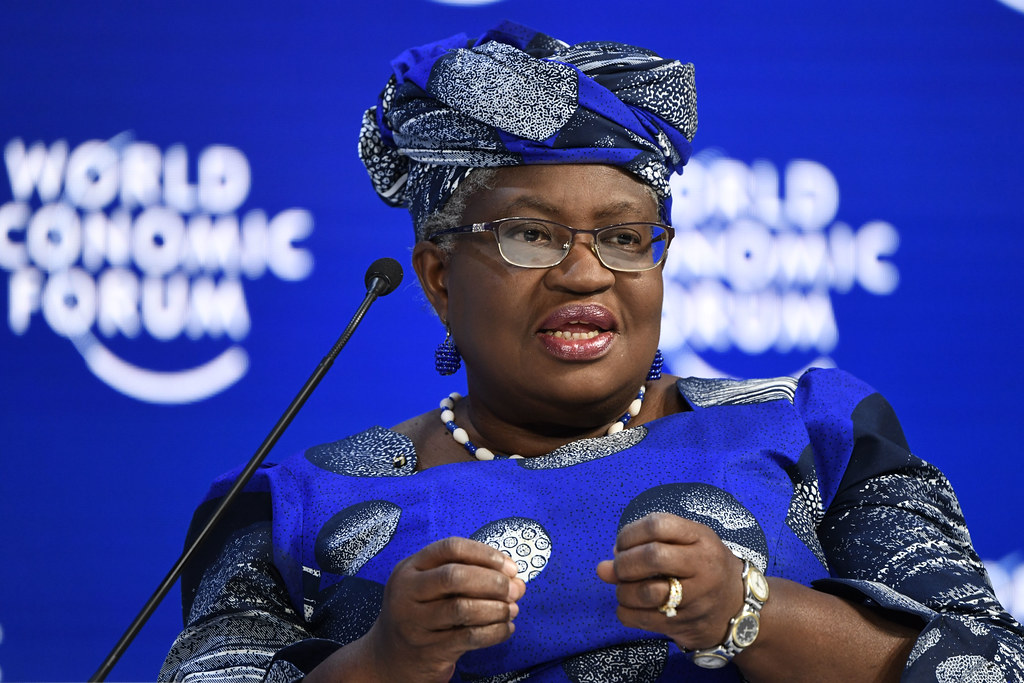
(1)    Dr. Ngozi Okonjo-Iweala (pictured below), appointed Director-General this past January, will be the first woman to convene a WTO Ministerial Conference. A former Nigerian Finance Minister, academic, and World Bank official, she is the first female Director-General among the 10 “DG’s” in the 73-year history of the WTO and its predecessor, the GATT (General Agreement on Tariffs and Trade).

(2)    Dr. Okonjo-Iweala won’t have a ton of female company among the assembled Ministers.  Using the CIA’s online “Directory of World Leaders” (a useful but somewhat shaky source; see below), PPI Trade & Global Markets staff count 19 women serving as Trade Minister around the world this month, plus at least six more with broader jobs — Ministers of Economy, Foreign Affairs, etc. — which also cover trade.  The 25-Minister total, representing about 12% of the world’s Cabinet-level trade positions, is identical to the count in a Trade Fact dating to 2010.

Why do so few women get these jobs? Posing the question this way is probably an error: Trade ministries are not an odd exception, but pretty typical. The CIA’s Directory finds women holding about 11% of the world’s defense ministries, 6% of finance ministries, 12% of health ministries, 15% of education ministries, and so on. Looking back, the last decade looks like one of stasis or even regression — women’s share of economic and law positions seems roughly stable; the share in health, culture, and education jobs fell from about 25% to 15%; and appointments in defense, police, and finance appointments remain particularly rare.

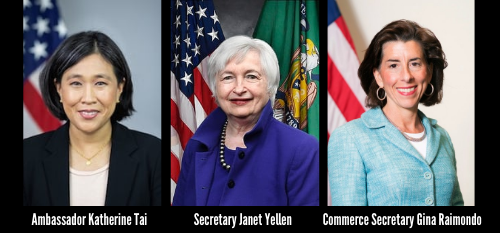
Overall, a pretty static and glum environment — but three bright spots. At the very top, publics appear at least a bit more open to choosing women as national leaders, with 25 serving as heads of government.  At home, the United States looks unusually good in economic diplomacy just now, with U.S. Trade Representative Katharine Tai representing the U.S. whenever MC-12 does convene; the Treasury Department run by Janet Yellen (also a former Federal Reserve chief and lead White House economist); and the Commerce Department by Gina Raimondo. And top-tier international organizations also show progress, if from a truly dismal base. As of 2010, no female had ever appeared among the lists of UN Secretaries-General, International Monetary Fund Managing Directors, World Bank Presidents, WTO and GATT Directors-General, or International Labor Organization Directors-General. The past decade has brought three such appointments (among eight total): those of Christine Lagarde in 2011 and Kristalina Georgieva in 2019 at the IMF, and most recently that of Dr. Okonjo-Iweala at the WTO.  She gets the last word: “Gender equality is a fundamental human rights issue and also an economic empowerment issue. We should all work harder.”


FURTHER READING


Dr. Ngozi Okonjo-Iweala in remarks for International Women’s Day (March 21), on the WTO, trade in the COVID-19 pandemic, the positive role trade integration appears to have on women workers, and pandemic lessons on women as national leaders.

Read about the UN on women’s leadership and political participation.


Three working women
 
U.S. Trade Representative Katharine Tai outlines the Biden Administration’s gender equity policy and trade contributions, and reflects on early life lessons, at the Summit of Democracies this morning.

Treasury Secretary Janet Yellen discusses opportunities and challenges for women in the economics profession with IMF Managing Director Georgieva (“many obstacles,” and “a cultural problem in the profession”).

And remarks from Commerce Secretary Gina Raimondo on competitiveness, workforce development, innovation, and equity.


From PPI, the Mosaic Economic Project

Mosaic provides training in media and publishing, network-building, and other services for two classes of 8-12 women in economics each year. Program Director Jasmine Stoughton explains on the Neoliberal Project podcast.

… Applications open for the February 2022 Mosaic cohort can be found here.… and 2021 Mosaic cohort member Aditi Mohapatra, Managing Director of Business for Social Responsibility, on next-decade agenda for private-sector hiring equity.


Around the world 

The inaugural “USMCA” Ministerial meeting joins Amb. Tai with Canadian Trade Minister Mary Ng and Mexican Economy Minister Tatiana Clouthier.

Khadija bint M’barek Fall on her work as Mauritania’s Commerce Minister.

Lithuania’s Ausrine Armonaite encourages girls to choose science careers.

Read about Colombia’s Maria Ximena Lombana Villalba.

Taiwan’s Economics Minister Wang Mei-hua pitches a bilateral trade agreement with the U.S. as potential solution to semiconductor shortages.

Kenya’s Cabinet Secretary for Commerce Betty Maina on Kenyan industry’s response to COVID.


A source note

The CIA’s online Directory of the world’s presidents, Cabinet ministers, Central Bank chiefs, and other great and wise is a valuable and possibly unique on-line public resource.  The Agency’s claim that it is “updated weekly”, however, is a bold overstatement.  As of today (Dec. 8) it still cites Benjamin Netanyahu as Israeli Prime Minister, though Naftali Bennett has had the job for 25 weeks.  The Directory likewise notes the dissolution of the Malaysian government in March 2021 but lists no Ministers at all.  It also skips some Ministers, such as Canadian Trade Minister Mary Ng and Mexican Economy Secretary Tania Clouthier.  Hopefully the IC knows the identity of Israel’s PM, is aware that Malaysia has a government, is familiar with the top trade negotiators for Mexico and Canada, and has just been busy with other important matters.  The percentages above rest on this Directory, though we’ve rechecked in general and updated our count of 25 Trade Ministers by examining national websites.  Nonetheless, apologies if we missed anyone. The CIA’s Directory of World Leaders and Cabinet Officers can be found here.


And last, returning to Geneva and the WTO for some (very) long-term perspective 

In 1558, two miles south down Quai Wilson and over the Rhone from Dr. Okonjo-Iweala’s office, Presbyterian Church father John Knox used a temporary Geneva base to write up his First Blast of the Trumpet Against the Monstrous Regiment of Women.  Mr. Knox’s 22,000-word bid for “worst book anywhere, ever” makes three arguments against government appointments, and especially against national leadership roles, for women:

   Selective Citation of Authority: The Bible does not place women in authority-roles; ergo, modern society also shouldn’t.  Except, Knox admits, for prophetess Deborah, queens Athaliah and Jezebel, and lots of others. He argues that, for various hand-waving reasons, they shouldn’t really count.
   Analogy:  Men are like the “head” of a family, and a country is like a family. If women are in charge, a country is metaphorically walking on its hands, with its “head” down and its “feet” on top.
   Verbal Abuse: A country ruled by women is “monstriferous,” and “contumely to God.”
   Knox’s rant can be read here.
   …and back in the 21st century, Dr. Okonjo-Iweala and former Australian PM Julia Gillard, joint authors of a February book on women in national leadership, discuss the topic at Brookings.
Special note: Research and drafting for this Fact by Lisa Ly, Social Policy Intern for the Progressive Policy Institute. Lisa is currently a Master of Public Policy candidate at The George Washington University.


ICYMI:
Clogged ports, empty truck cabs:
Good problems to have

by Ed Gresser, PPI Vice President
and Director for Trade and Global Markets
for New York Daily News

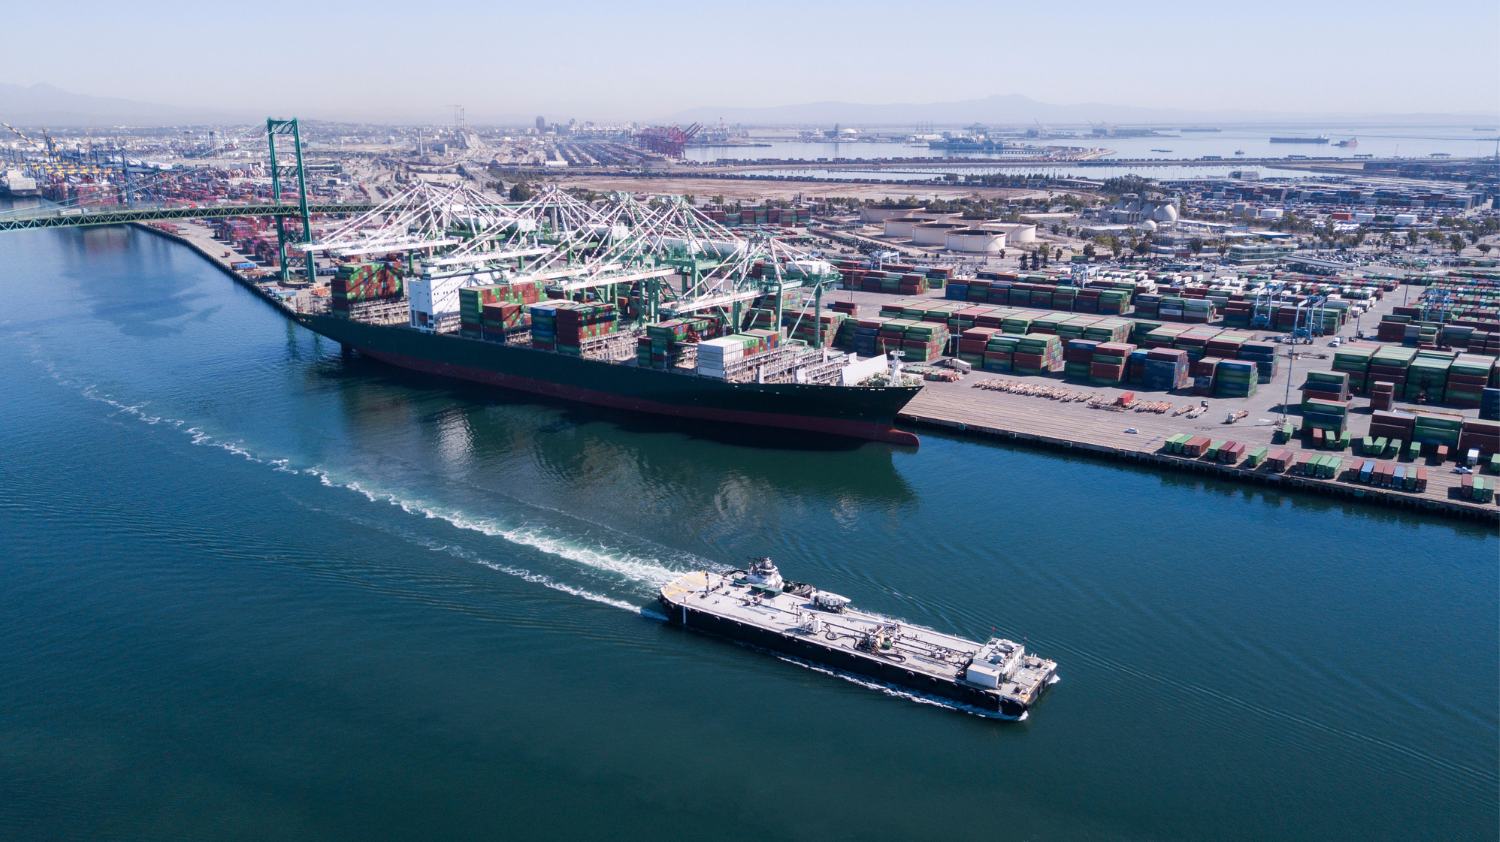
Looking out at the Pacific this year, worried farmers see giant cargo ships turning around empty, leaving their wine, butter and almond cargoes on the docks and at least $1.5 billion in exports lost. Meanwhile, 80-ship pileups off the coast of Southern California mean weeks or even months of delays unloading industrial inputs and consumer goods; and with truckers and warehouse workers quitting their jobs at record rates, full containers are piling up in fields and parking lots.

The port problems are complicated and serious enough to worry even President Biden, who has given speeches and put out policies to head off complaints about everything from empty shelves during Christmas shopping weeks to lost farm exports and inflationary bottlenecks.

READ MORE


TOP TRADE RETWEET:


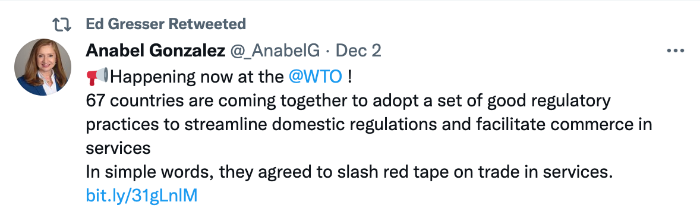
Follow the World Trade Organization


ABOUT ED

Ed Gresser is Vice President and Director for Trade and Global Markets at PPI.

Ed returns to PPI after working for the think tank from 2001-2011. He most recently served as the Assistant U.S. Trade Representative for Trade Policy and Economics at the Office of the United States Trade Representative (USTR). In this position, he led USTR’s economic research unit from 2015-2021, and chaired the 21-agency Trade Policy Staff Committee.

Ed began his career on Capitol Hill before serving USTR as Policy Advisor to USTR Charlene Barshefsky from 1998 to 2001. He then led PPI’s Trade and Global Markets Project from 2001 to 2011. After PPI, he co-founded and directed the independent think tank ProgressiveEconomy until rejoining USTR in 2015. In 2013, the Washington International Trade Association presented him with its Lighthouse Award, awarded annually to an individual or group for significant contributions to trade policy.

Ed is the author of Freedom from Want: American Liberalism and the Global Economy (2007).  He has published in a variety of journals and newspapers, and his research has been cited by leading academics and international organizations including the WTO, World Bank, and International Monetary Fund. He is a graduate of Stanford University and holds a Master’s Degree in International Affairs from Columbia Universities and a certificate from the Averell Harriman Institute for Advanced Study of the Soviet Union.

Read the full email and sign up for the Trade Fact of the Week


Gresser for NYDN: Clogged ports, empty truck cabs: Good problems to have

By Ed Gresser


Looking out at the Pacific this year, worried farmers see giant cargo ships turning around empty, leaving their wine, butter and almond cargoes on the docks and at least $1.5 billion in exports lost. Meanwhile, 80-ship pileups off the coast of Southern California mean weeks or even months of delays unloading industrial inputs and consumer goods; and with truckers and warehouse workers quitting their jobs at record rates, full containers are piling up in fields and parking lots.

The port problems are complicated and serious enough to worry even President Biden, who has given speeches and put out policies to head off complaints about everything from empty shelves during Christmas shopping weeks to lost farm exports and inflationary bottlenecks.

But they’re also the sort of problems administrations are happy to have. This is because they’re evidence of confident consumers, workers finding new opportunities, and a successful effort, at least so far, by the Biden administration’s work to create a strong economy that grows from the middle out.


Read the full piece in New York Daily News.

PPI’s Trade Fact of the Week: Trump tariff increases contribution to inflation: ~0.5%?

FACT:

Trump tariff increases contribution to inflation: ~0.5%?

THE NUMBERS: 

U.S. tariff collection

2021:        $85.5 billion?*
2016:        $32.2 billion

* Estimated, based on available tariff data for January-September 2021

WHAT THEY MEAN:

The Bureau of Labor Statistics’ startling October 2021 Consumer Price Index report found “the largest 12-month increase [in consumer prices] since the period ending November 1990” — specifically, price inflation of 6.2% from October 2020 through October 2021. The report’s finer detail shows inflation at different rates in different parts of the economy: 30% for energy, 3.2% for services, 5.3% for food, 8.4% for goods excluding food and energy, 9.2% for automobiles, and so on. What sort of role (if any) did tariffs play in this?

Some data first: In 2016, the U.S. “trade-weighted average” tariff was 1.4%. (Taking that year’s $32 billion in tariff revenue, and dividing it by the U.S.’ $2.21 trillion in goods imports.)  In January 2017, the Congressional Budget Office projected that at the same rates, tariff revenue in 2021 would be $42 billion, with income rising slowly along with economic growth. Then, from late 2018 through mid-2020, the Trump administration imposed a series of tariffs: “Section 301” tariffs from 7.5% to 25% on about $350 billion in Chinese imports and “Section 232” tariffs of 25% on steel and 10% on aluminum, along with unusual “safeguard” and “countervailing duty” tariffs on washing machines, solar panels, and Canadian lumber, which are more typical trade policy steps. By 2019, the U.S.’ average tariff had doubled to 2.8%, bringing in a likely $86 billion on about $2.9 trillion in goods imports this year.  Of the extra $54 billion, $46 billion comes from tariffs on Chinese goods, and $1.9 billion from tariffs on steel and aluminum (excluding Chinese-produced metals.)

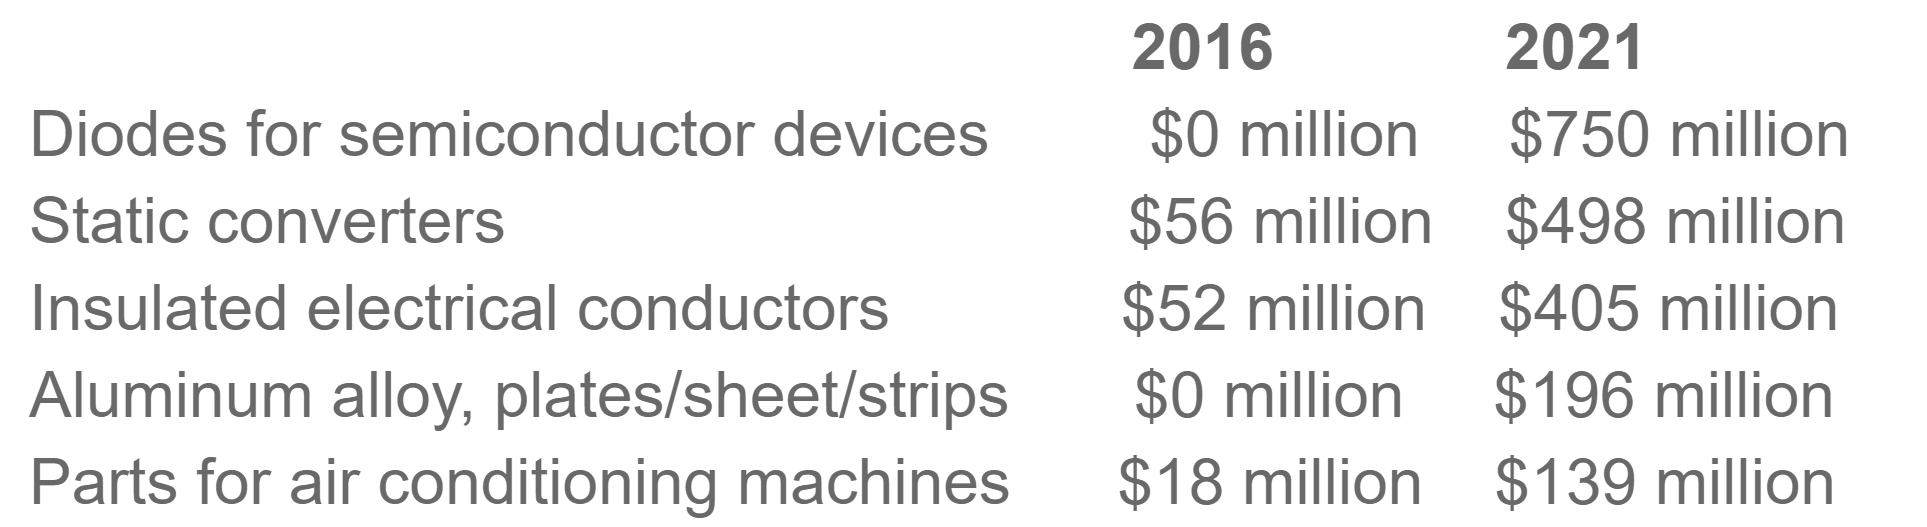
The “232” and “301” tariffs (so-called for the sections of U.S. trade law used to impose them) differ from the U.S.’ permanent “MFN” tariff system in an important way. The permanent U.S. tariff system mainly taxes retailers and shoppers, since its high tariffs are dominated by clothes, shoes, and a few other home goods.  On the other hand, it imposes relatively few taxes on industrial inputs and raw materials, and almost none of those it does charge are very high. The Trump tariffs, while they also cover many consumer products, hit many more industrial inputs and capital goods.  A few examples, again annualizing 2021 revenue figures from the available 9 months of data, illustrate the sources of the extra $54 billion in some detail:

These sorts of things, obviously, are bought more by industrial customers making various other products — machinery manufacturers, automakers, construction firms, air conditioner factories (and repair shops) — than by families.  Economists typically find that import prices of products subject to tariffs did not fall, so the buyers absorbed pretty much the full cost of the tariffs, meaning in turn that they will eventually raise prices of the things they make. A study of the tariff increases on Chinese goods in by San Francisco Federal Reserve staff economists in March 2019 – about halfway through the cycle of tariffs and retaliations — predicted as much, finding a likely consumer price increase of 0.1% economy-wide, and a business investment goods price increase of 0.4%. It also noted that more tariffs would mean more inflation, up to 0.4% in consumer prices and 1.4% in business investment goods were the administration to impose an across-the-board tariff of 25% on all Chinese goods.

More China tariffs did follow over the course of 2019, but not to that hypothetical level; on the other hand, the S.F. Fed study didn’t cover the metals tariffs. Taking this as a guide, the actual tariff contribution to inflation would be likely lie somewhere between the study’s initial 0.1% economy-wide estimate and its hypothetical 0.4%. Adding in the metals might reasonably bring it to 0.5%. Essentially, a secondary but noticeable contribution, presumably with a somewhat higher contribution to the BLS’ actual 8.4% inflation in goods-excluding energy and food.


FURTHER READING

  • The Bureau of Labor Statistics on the Consumer Price Index for October 2020 to October 2021 can be read here.
  • San Francisco Federal Reserve staff study potential inflationary impacts of tariffs, March 2019. Read more here.
  • The Congressional Budget Office looks at broader economic impacts, August 2019. (Conclusion: “On balance, in CBO’s projections, the trade barriers imposed since January 2018 reduce both real output and real household income. By 2020, they reduce the level of real U.S. GDP by roughly 0.3 percent and reduce average real household income by $580 (in 2019 dollars. Beyond 2020, CBO expects those effects to wane as businesses adjust their supply chains.  By 2029, in CBO’s projections, the tariffs lower the level of real U.S. GDP by 0.1 percent and the level of real household income by 0.2 percent.”) Read the CBO’s take.
  • Academics Pablo Fajgenbaum, Pinelopi Goldberg, Patrick Kennedy, and Amit Khandelwal examine the tariffs and their impact, finding (among much else) that U.S. buyers pay it all.
  • Peterson Institute’s Chad Bown in depth on the China tariffs can be read here.


ABOUT ED

Ed Gresser is Vice President and Director for Trade and Global Markets at PPI.

Ed returns to PPI after working for the think tank from 2001-2011. He most recently served as the Assistant U.S. Trade Representative for Trade Policy and Economics at the Office of the United States Trade Representative (USTR). In this position, he led USTR’s economic research unit from 2015-2021, and chaired the 21-agency Trade Policy Staff Committee.

Ed began his career on Capitol Hill before serving USTR as Policy Advisor to USTR Charlene Barshefsky from 1998 to 2001. He then led PPI’s Trade and Global Markets Project from 2001 to 2011. After PPI, he co-founded and directed the independent think tank ProgressiveEconomy until rejoining USTR in 2015. In 2013, the Washington International Trade Association presented him with its Lighthouse Award, awarded annually to an individual or group for significant contributions to trade policy.

Ed is the author of Freedom from Want: American Liberalism and the Global Economy (2007).  He has published in a variety of journals and newspapers, and his research has been cited by leading academics and international organizations including the WTO, World Bank, and International Monetary Fund. He is a graduate of Stanford University and holds a Master’s Degree in International Affairs from Columbia Universities and a certificate from the Averell Harriman Institute for Advanced Study of the Soviet Union.

Read the full email and sign up for the Trade Fact of the Week

PPI’s Trade Fact of the Week: U.S. farm export losses as shipping companies decline cargoes, as of mid-year 2021: $1.5 billion?

FACT:

U.S. farm export losses as shipping companies decline cargoes, as of mid-year 2021: $1.5 billion?

THE NUMBERS: 

Containers* arriving at Port of Los Angeles:

4.72 million:      January-October 2021
3.48 million:      January-October 2020
3.97 million:      January-October 2019

* Counted in TEUs (“twenty-foot equivalent units”, for the standard 20’ x 8’ x 8.5’ shipping container)

WHAT THEY MEAN:

D.C.’s taxi cabs and their dispatchers obey a public-interest rule:  If you wish to serve the lucrative routes — say, Dulles-to-Mayflower Hotel and back — you must also agree to pick up fares from the neighborhoods. Representatives John Garamendi (D-Calif.) and Dusty Johnson (R-S.D.), in their proposed Ocean Shipping Reform Act, pose a question: Shouldn’t the world’s container ships live by a similar rule, requiring them to carry American export cargoes as well as inbound containers?

Statistics put out monthly by American container ports suggest why they ask this question.  From January through October, the Port of Los Angeles — the busiest U.S. container port — took in 4.72 million containers (again in TEUs). This is a bigger total than all but one of LA’s full-year incoming container counts, and based on a daily average of about 15,500 arriving containers, the 4.87 million-TEU record set in 2018 probably fell two weeks ago.  Statistics are much the same at the second-busiest port — Long Beach, ten minutes’ drive east on the Seaside Freeway — which likely broke its own annual record last weekend.  Meanwhile, truckers and warehouse workers have been leaving their jobs all year for better options: 1.4 million workers in the Bureau of Labor Statistics’ transport/warehousing/utility sector have quit through September, easily breaking the 1.1 million full-year record set in 2002.  So with record arrivals on one hand and bottlenecks on the other, the ports have clogged up. The resulting worries about Christmas inventories and intra-U.S. supply bottlenecks are intense enough to worry even the President of the United States.

A less publicized consequence of the incoming-container surge is a perverse incentive for shipping companies:  they’re tempted to ignore U.S. exporters. Fees to ferry a container from Asia to the West Coast, normally between $2,000 and $3,000, have run at $15,000 for much of this year and at times hit $20,000.  With import income so high, a ship can often earn more money by turning around empty to refill in Asia than by loading a waiting U.S. export cargo for $3,000 or so.  September’s Port of Los Angeles container report provides a vivid illustration: it counted 434,294 outbound containers, of which 358,351 traveled empty, and only 75,713 carrying U.S. cargo — the Port’s lowest count of full export containers since the autumn of 2002.

This hits farm exporters who use containers especially hard, as producers of meats, dairy, wines, tree nuts, and specialty crops often require quick pickup of perishable goods.  As of mid-year they reported losing $1.5 billion in exports. To put this in perspective, calculations by the Department of Agriculture’s Economic Research Service done for 2019 suggest that each $1.5 billion in agricultural exports meant about $1.7 billion in economic activity for the U.S., including about 12,000 jobs and $500 million in farm income.

Hence, the bill Reps. Garamendi and Johnson propose.  Returning to the taxicab analogy, a D.C. taxi company fielding a request for dispatch must accept the fare (unless the customer is belligerent, intoxicated, etc.) or face a $250 civil penalty.  Maritime shipping operates on an obviously different scale — a single medium-sized container ship could carry all 7,151 D.C. cabs if it wanted to**, and there are 6,293 such ships on the water — but also has some similarities.  Like taxicabs, the mighty vessels run by Maersk, Evergreen, COSCO, MSC et al. are “common carriers” given a right to serve U.S. ports. Under the bill, this right would come with a complementary responsibility to serve American exporters and could not “unreasonably decline export cargo bookings if such cargo can be loaded safety and timely and carried on a vessel scheduled for such cargo’s immediate destination” without becoming liable to penalties by the Federal Maritime Commission.

** Yes, we know, not a likely real-world scenario.  Cars aren’t easy to squish into containers (though it can be done if necessary), and usually travel on roll-on/roll-off ships. Just meant as a visual.


FURTHER READING

Legislation

From Reps. Garamendi and Johnson, read the Ocean Shipping Reform Act.

A supportive White House post can be read here.

The Federal Maritime Commission, tasked with regulating ocean carriers and (should the Garamendi/Johnson bill pass) enforcing new rules.

Agriculture and the export economy

Farm Bureau economist Daniel Munch on the West Coast port challenges and their impact on American agriculture, read the piece here.

The New York Times’ Ana Swanson (subs. req.) has the view from the California dairy farm, read the piece here.

And the USDA’s most recent investigation of ag exports and their economic impact at home can be read here.

Ports and ships

Container statistics from the Port of Los Angeles can be found here.

UNCTAD’s 2021 Review of Maritime Transport, with examinations of the impact of COVID-19 on 2020 shipping and cargo, the 2021 rebound, and some glum detail on U.S. ports.  The three busiest U.S. container ports – Los Angeles, Long Beach, and New York – handle 25 million containers per year, about as many as China’s 4th-busiest port (Shenzhen) does all by itself.  The world’s top two — Shanghai and Singapore — manage 44 million TEU and 37 million TEU, respectively.

Help on the way — The White House summarizes the maritime investment sections of the bipartisan Infrastructure Investment & Jobs Act.

And last …

What are container ships really like?  Horatio Clare’s Down to the Sea in Ships (2015) recounts a trip on the Gerd Maersk, a 6,600-TEU ship built in 2006, on a UK-through-Suez-to-Malaysia-Vietnam-China-to-Los Angeles rout. Detail on crew life (Filipino ratings, European and Indian officers; no alcohol at any time), cargo loading, rules for avoiding piracy, the approach to the Port of L.A., etc. The average (mean) capacity of a container ship this year is about 4,000 TEU, placing Gerd Maersk in the larger-than-average class able in theory to carry *nearly* all of D.C.’s taxicabs. The biggest current ships are the three Japanese-built 23,992-TEU Ace series delivered to Taiwan’s Evergreen line this year; 1,312 feet long, 212 feet wide, and 108 feet deep, they could carry the whole D.C. cab fleet and still be two-thirds empty.

ABOUT ED

Ed Gresser is Vice President and Director for Trade and Global Markets at PPI.

Ed returns to PPI after working for the think tank from 2001-2011. He most recently served as the Assistant U.S. Trade Representative for Trade Policy and Economics at the Office of the United States Trade Representative (USTR). In this position, he led USTR’s economic research unit from 2015-2021, and chaired the 21-agency Trade Policy Staff Committee.

Ed began his career on Capitol Hill before serving USTR as Policy Advisor to USTR Charlene Barshefsky from 1998 to 2001. He then led PPI’s Trade and Global Markets Project from 2001 to 2011. After PPI, he co-founded and directed the independent think tank ProgressiveEconomy until rejoining USTR in 2015. In 2013, the Washington International Trade Association presented him with its Lighthouse Award, awarded annually to an individual or group for significant contributions to trade policy.

Ed is the author of Freedom from Want: American Liberalism and the Global Economy (2007).  He has published in a variety of journals and newspapers, and his research has been cited by leading academics and international organizations including the WTO, World Bank, and International Monetary Fund. He is a graduate of Stanford University and holds a Master’s Degree in International Affairs from Columbia Universities and a certificate from the Averell Harriman Institute for Advanced Study of the Soviet Union.

Read the full email and sign up for the Trade Fact of the Week


PPI’s Trade Fact of the Week: ‘Squid Game’ outdrew the World Series this year – Nov. 17, 2021

FACT:

“Squid Game” outdrew the World Series this year.

THE NUMBERS: 

111 million:  Squid Game viewers, September/October 2021
70 million:    World Series viewers, October/November 2021

WHAT THEY MEAN:

Korea-made drama Squid Game, which premiered Sept. 17 on Netflix, centers on a contest in which 456 impoverished and debt-ridden players compete for a ₩45.6 billion prize (~$38 million) in a series of children’s games. The losing players are ruthlessly executed. (Shot, stabbed, thrown off a bridge, etc.; more variety presumably in Season 2.) The show’s 9-episode Season 1 run logged over 111 million views, a count not only well above Netflix’s earlier 82-million-viewer record (the 2020 scheming-18th century-Brit-aristocrat series Bridgerton), but outpacing the Atlanta-v.-Houston World Series.  Americans weren’t alone in their enthusiasm: Squid Game was also Netflix’s top show in Denmark, Bolivia, Kuwait and Bahrain, India, Bulgaria, and 44 other countries.

Not a unique triumph for Korean arts, Squid Game is an especially visible example of the much larger “Hallyu Wave” phenomenon. Hallyu, translated as “Korean Wave,” is shorthand for the international appeal of South Korean pop culture, first in Japan, China, Taiwan, and Southeast Asia and more recently in the U.S., Europe, Latin America, and the Middle East.  At the cultural high end, last year’s Parasite — a satire on class disparity and wealth inequality, pitting scheming low-income moochers against a greedy and clueless rich family — was the first Asian and first non-English-language film to win a Best Picture Oscar.  At the somewhat less-high end, five of Billboard’s 10 non-English No. 1 albums since 1958 have come since 2018 from K-Pop boy-band groups BTS and SuperM. In between are clothing styles, video games, cosmetics, band and artist merchandise, and other cultural and lifestyle products.

Korean government economists calculate the value of Hallyu exports at $12 billion in 2020.  This would still be well below the $36 billion in exports from Korea’s mighty auto factories, but within sight and growing by 22 percent per year. More is presumably ahead; as one 2021 indicator, Netflix invested nearly $500 million in the Korean entertainment industry and opened two studio facilities in South Korea.

What explains Hallyu’s success?  Some analysis credits Korean government support and organization.  The Korea Herald, reporting on the creation of a “Hallyu Department” in the Ministry of Culture, Sports, and Tourism last year scoffs at this idea: “it is not the first time that the government is attempting to play a role in the promotion of the Korean wave, each time against resistance from the industry who feared government meddling in what is essentially a private sector initiative may have the opposite effect”.  Rather, the success of Korean culture looks organic, matching (a) appealing plotting, cliffhanger endings, and striking visuals with (b) new forms of access as widespread Internet use, secure financial services, and open data flow enable online streaming services such as Netflix and Hulu to compete to offer their subscribers an array of films, music, and TV, and (c) devoted and highly organized international fan bases using social media to evangelize and market to one another.


FURTHER READING


Read Squid Game ratings and rankings by country from Netflix, here.Read more background about Hallyu Wave, here.

Policy or not?

The Carnegie Endowment looks at Korean government support for cultural industry and Hallyu as soft-power policy, read more here.

The Korea Herald is skeptical, read more here.

The Korea Economic Institute sides with the Herald, viewing government promotion Hallyu as largely “mistargeted,” “ineffectual,” and annoying to fans, read more here.

Fans and artists

Time on U.S. K-pop fans as a 2020 political force, read here.

Navigating through K-pop fandom with fan clubs and fan cafes, read here.

For insight on Korean filmmaking and its international appeal, read here.

And for the Korean Cultural Center/DC’s October Hallyu & K-Pop demo, click here.


Special note: Research and drafting for this Trade Fact by Lisa Ly, Social Policy Intern for the Progressive Policy Institute. Lisa is currently a Master of Public Policy candidate at The George Washington University. 


ABOUT ED

Ed Gresser is Vice President and Director for Trade and Global Markets at PPI.

Ed returns to PPI after working for the think tank from 2001-2011. He most recently served as the Assistant U.S. Trade Representative for Trade Policy and Economics at the Office of the United States Trade Representative (USTR). In this position, he led USTR’s economic research unit from 2015-2021, and chaired the 21-agency Trade Policy Staff Committee.

Ed began his career on Capitol Hill before serving USTR as Policy Advisor to USTR Charlene Barshefsky from 1998 to 2001. He then led PPI’s Trade and Global Markets Project from 2001 to 2011. After PPI, he co-founded and directed the independent think tank ProgressiveEconomy until rejoining USTR in 2015. In 2013, the Washington International Trade Association presented him with its Lighthouse Award, awarded annually to an individual or group for significant contributions to trade policy.

Ed is the author of Freedom from Want: American Liberalism and the Global Economy (2007).  He has published in a variety of journals and newspapers, and his research has been cited by leading academics and international organizations including the WTO, World Bank, and International Monetary Fund. He is a graduate of Stanford University and holds a Master’s Degree in International Affairs from Columbia Universities and a certificate from the Averell Harriman Institute for Advanced Study of the Soviet Union.

Read the full email and sign up for the Trade Fact of the Week

PPI’s Trade Fact of the Week: Pirate attacks are at their lowest rate in 30 years – Nov. 10, 2021

FACT:

Pirate attacks are at their lowest rate in 30 years.

THE NUMBERS: 

Pirate attacks worldwide

2021: 125?
2020: 195
2019: 162
2012: 297
2010: 445

WHAT THEY MEAN:

A terse description of a high-seas pirate attack off Nigeria three weeks ago, from the International Maritime Bureau’s Piracy Reporting Centre:

Oct. 25, 2021: While underway, a container ship was boarded by an unknown number of pirate and the crew retreated into the citadel.  On being notified of the incident, the IMB Piracy Reporting Centre immediately alerted and liaised with the Regional Authorities and international warships to request for assistance.  A Russian Navy warship and its helicopter responded and proceeded to render assistance resulting in the crew and ship being safe.  The pirates escaped with stolen ship’s properties.  

Background: A decade of naval cooperation, even among distrustful big powers, appears to have made high-seas pirate work more difficult and less rewarding.

In 2010, international waters off Somalia — the Red Sea, the Gulf of Aden, and the ‘Bab-el-Mandeb’ strait, the principal commercial and energy link between Asia and Europe, with 50 ship transits and 3.4 million barrels of oil moving daily — were the center of the pirate industry.  The collapse of Somalia’s central state in 1991 left country prey to sequential waves of violent clan-based militias, radical fundamentalists and crime gangs.  One product of this was a notorious high-seas pirate industry; at its peak from 2005 to 2010, gangs using small speedboats and automatic weapons were attacking three or more ships a week on the high seas — in total, 181 attacks in 2009 — and in 2010 they were holding 30 vessels and 600 sailors for ransoms ranging up to $95 million.

Since then, the 29-country naval patrol known as CTF-151 (“Combined Task Force 151”) with rotating commands led this year by Pakistan and now Brazil, appears to have essentially eliminated the Somali pirate industry.  The last two successful attacks on high-seas vessels in this region were in 2017, and the most recent failed attempt was in 2019; none at all are reported for 2020 and 2021.

On a worldwide scale, pirate attacks have fallen by over half in the past decade, from 445 known attacks in 2010 to 195 in 2020.  The running tally kept by the International Maritime Bureau in Kuala Lumpur suggests that this year’s count may fall below 150, which would be the fewest attacks since 1994.  Piracy is now most frequent in Indonesia and in the Singapore Strait, the sites of 47 of last year’s 161 attacks and 25 of the 97 attacks reported through September 2021.  Only two of these, though, were actual attacks on high-seas shipping; the others were attempted robberies of ships in port or at anchor. Attacks off West Africa are somewhat less frequent — 24 in 2020, or two each month — but appear to feature especially well-armed and violent pirates, responsible for all three 2020 high-seas hijackings of ships, along with 128 of the 135 crew kidnappings, and nine of the 11 incidents of firing on shipping.  In West Africa too though, frequency and severity have diminished this year, with the open-water event off Brass last month the only high-seas attack recorded so far.  Its quick interruption by a Russian naval patrol, even though the pirates got away with some stolen equipment, suggests some success for international naval cooperation here as well.

FURTHER READING

Facts and data

The International Maritime Bureau’s piracy reports for 2020 find:

Totals: 195 pirate attacks of all kinds worldwide, down from a peak of 445 attacks in 2010, and down again by 30% (from 132 to 97) through the first nine months of 2021.

Hijackings: 11 hijackings of high-seas shipping, down from 53 in 2010; only two so far in 2021.

The International Maritime Bureau on recent pirate attacks, with the full-year 2020 and partial-year 2021 reports available at no cost via e-mail:

Navy perspectives 

Command Task Force 151, led last year by Pakistan and this year by Brazil, patrols Somali waters.

The Marinha do Brasil takes over CTF-151.

And the U.S. Navy reports on joint anti-piracy training with the Ghanaian navy this spring, and Ghanaian-American sailors Samuel Ellis and Prince Boateng visiting home.

The Singapore-based Information Sharing Center for the Regional Cooperation Agreement on Combating Piracy (RECAAP) oversees anti-piracy operations in maritime Southeast Asia.

Two views on Somali piracy

Brookings Institution scholars speculate on a link between illegal/unreported/unregulated fisheries and piracy rates, can be read here.

And a personal account from journalist Michael Scott Moore in The Guardian, on his 977 days as a pirate kidnap victim can be read here.

ABOUT ED

Ed Gresser is Vice President and Director for Trade and Global Markets at PPI.

Ed returns to PPI after working for the think tank from 2001-2011. He most recently served as the Assistant U.S. Trade Representative for Trade Policy and Economics at the Office of the United States Trade Representative (USTR). In this position, he led USTR’s economic research unit from 2015-2021, and chaired the 21-agency Trade Policy Staff Committee.

Ed began his career on Capitol Hill before serving USTR as Policy Advisor to USTR Charlene Barshefsky from 1998 to 2001. He then led PPI’s Trade and Global Markets Project from 2001 to 2011. After PPI, he co-founded and directed the independent think tank ProgressiveEconomy until rejoining USTR in 2015. In 2013, the Washington International Trade Association presented him with its Lighthouse Award, awarded annually to an individual or group for significant contributions to trade policy.

Ed is the author of Freedom from Want: American Liberalism and the Global Economy (2007).  He has published in a variety of journals and newspapers, and his research has been cited by leading academics and international organizations including the WTO, World Bank, and International Monetary Fund. He is a graduate of Stanford University and holds a Master’s Degree in International Affairs from Columbia Universities and a certificate from the Averell Harriman Institute for Advanced Study of the Soviet Union.

Read the full email and sign up for the Trade Fact of the Week

PPI’S TRADE FACT OF THE WEEK: U.S. trade deficit up ~60% since 2016 – OCT. 27, 2021

FACT:

The U.S. trade deficit is up ~60% since 2016.

THE NUMBERS: 

$1.05 trillion*: U.S. manufacturing trade deficit, 2021
$0.90 trillion: U.S. manufacturing trade deficit, 2020
$0.65 billion: U.S. manufacturing trade deficit, 2016

* Educated guesswork for a volatile post-COVID closure period, based on 8 months of available data for 2021

WHAT THEY MEAN:

Each February, the Office of the U.S. Trade Representative puts out a report entitled “The President’s Trade Agenda,” meant to set out administration goals for the coming year.  The 2017 edition, the first of the Trump administration, cited U.S. trade balance statistics as proof that early administrations got things wrong: “In 2000, the U.S. trade deficit in manufactured goods was $317 billion.  Last year it was $648 billion — an increase of 100%.”  The next one, in 2018, used “bilateral” trade balance to (a) claim failure for the North American Free Trade Agreement (“our goods trade balance with Mexico, until 1994 characterized by reciprocal trade flows, almost immediately soured after NAFTA implementation, with a deficit of over $15 billion in 1995, and over $71 billion by 2017”) and (b) define a goal for a renegotiated “USMCA”: “USTR has set as its primary objective for these renegotiations to improve the U.S. trade balance and reduce the trade deficit with the NAFTA countries.”

Few economists see trade balance as a useful way to judge trade policy, whether in terms of the content of agreements, or the nature of permanent systems like tariff schedules and antidumping laws.  In the standard Econ 101 equations, a country’s trade balance will always match the difference between its savings and its investment; since the mid-1970s, Americans have been investing more than we save; ergo, deficits result. In this view, very high deficits can cause alarm as indicators of unsustainable booms and potential financial shocks, but the appropriate response is long-term measures to raise savings rates.  Trade policy, meanwhile, should be judged against hopes for growth, job quality, control of inflation, raising living standards for low-income families, business competitiveness and innovation, and so on.

But shoving such high-minded quibbling aside, how do the Trump legacy policies — tariffs on metals and Chinese goods, withdrawal from the World Trade Organization’s Dispute Settlement Body, the new USMCA, etc. — look when judged by the standards the 2017 and 2018 reports set?

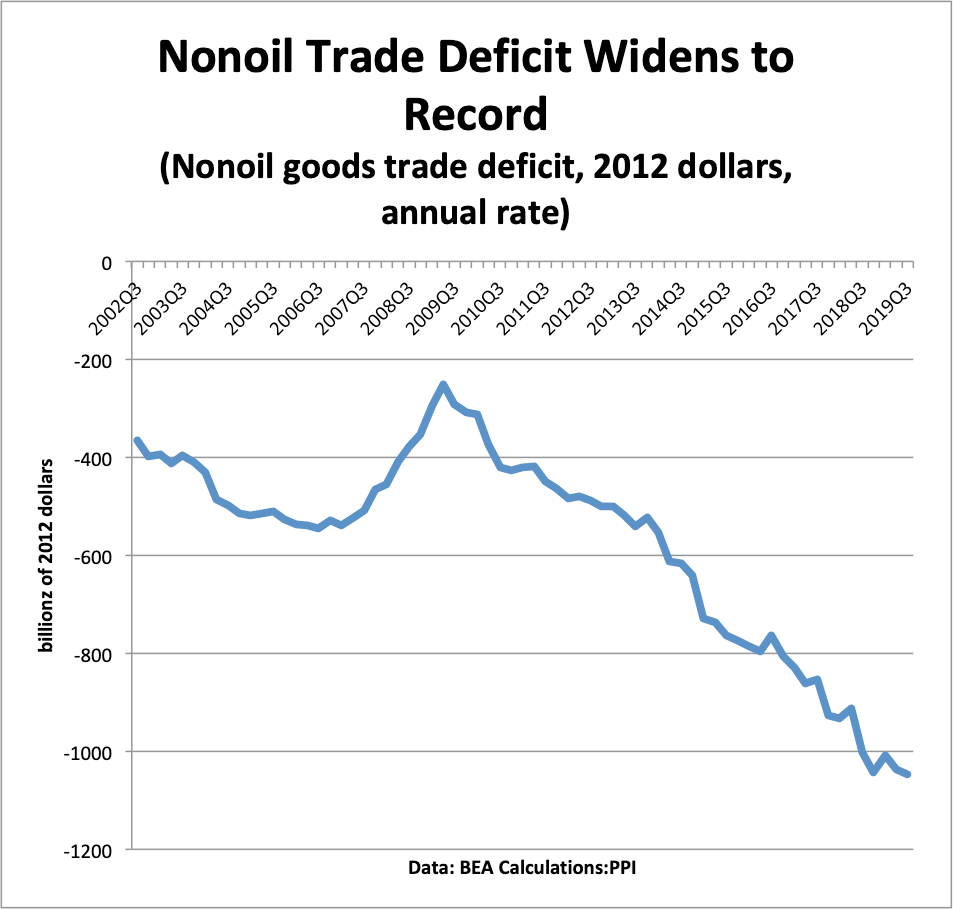
1. By 2020, the U.S. deficit in manufactured goods had hit $900 billion.  This is a four-year jump of $252 billion, not much below the $331 billion 16-year increase cited in the 2017 report.  Barring some unexpected economic shock this November, the 2021 figure will easily top $1 trillion.

  1. With respect to Mexico specifically, the bilateral goods deficit in 2020 was $114 billion. The 2021 figure looks about the same.  Adding Canada gets a total north of $150 billion.So by these standards, not too good.  Not what the policies’ authors predicted. And some grounds for high-minded quibblers to smirk.


FURTHER READING

Data:

Compare this data against the Census Bureau’s U.S. monthly trade data, through August 2021.
… and for the U.S. with Canada and Mexico, specifically.

… and for the big picture, U.S. exports, imports, and balances from 1960-2020 on one convenient page.

What happened?  

Trumpism leaves a larger deficit overall, and more concentrated in manufacturing than the 2016 figures.  The basic figures are, pulling the lens steadily back:

(a) The U.S. “goods” deficit — exports of manufacturing, energy, agriculture, scrap and waste and uncategorized small-scale shipments minus the equivalent imports — was $749 billion in 2016 and $922 billion in 2020.  The manufacturing deficit was equivalent to 86% of the 2016 total, and by 2020 had risen to 98% of the total.  A 2021 annualization suggests a total goods deficit around $1.05 trillion in 2021, with manufacturing more than 100% of the total and other goods in small net surplus.

(b) A broader measure, counting services trade (generally in surplus for the United States) as well as goods, finds a goods/services trade deficit up from $481 billion in 2016 to $677 billion in 2020.  The 2021 figure is likely to be around $900 billion.

(c) Relative to GDP (more meaningful), a deficit of 2.7% of GDP in 2016 rose to 3.1% in 2020, and a likely 4% in 2021.  This would be the highest since the modern-era peaks of 5.7% in 2005 and 2006.

Why the jump?  Tax policy is the obvious suspect.  Three of the four upward ratchets in U.S. trade deficits since the 1970s followed tax-cut bills — one in the first Reagan term, another in the second Bush administration, and the third in 2017.  Bills of this sort bring higher government deficits.  Unless a rise in family or business savings offsets this public dis-savings, overall U.S. savings will fall, and all else equal, by virtue of the “savings – investment = trade balance” identity, trade deficits rise.  So the higher 2020 and 2021 deficits likely emerge from the 2017 tax bill.

The Trump-era tariffs likely had relatively little trade-balance impact, but do seem to have had two outcomes.  One is a shift in import patterns: imports from China, though slightly above 2016 levels in dollar terms, have dropped from 21.6% of goods imports to 18.1% in 2020 and 2021, as clothes, consumer electronics, etc. from Vietnam, India, Taiwan, and so forth replace some Chinese-origin goods.  Second, some shift in composition, with relatively more manufacturing deficits and relatively less energy.  Where the permanent U.S. tariff system is mostly a way to tax clothing and shoes and so falls mainly on retailers and families, Trump-era tariffs on steel, aluminum, and Chinese goods were more concentrated in industrial inputs such as metals, auto parts, electrical converters, etc. As an example, tariff revenue on insulated electric conductors rose from $56 million in 2017 to $322 million in 2020.  As U.S. manufacturers absorb these costs, the likely result is marginal loss of competitiveness both for exporters trying to sell to foreign buyers and for firms competing against imports at home (and of course exporters facing retaliation by foreign countries responding to tariffs), pushing more of the U.S deficit into manufacturing.

The two reports:

Read the 2017 “President’s Trade Agenda” report.

… and also read the 2018 follow-up (with a wildly wrong claim that the 2017 tax bill “has the potential to reduce the U.S. trade deficit by reducing artificial profit shifting”).

And so … “House on fire! Bring more kerosene!” In the Economist last month, Trump-era lead trade negotiator Robert Lighthizer again laments high trade deficit, skates around the 2017-2021 rise, and suggests more of the 2018-2020 approach will bring it down this time. Read the Economist piece here.

Read the full email and sign up for the Trade Fact of the Week

PPI’s Trade Fact of the Week: Liberalism is worth defending – Oct. 20, 2021

FACT:

Liberalism is Worth Defending

THE NUMBERS: 

COVID vaccinations per week, worldwide: 150 million
Workers escaping deep poverty, 2000-2019: 440 million
International students in the U.S., 2020: 1.07 million

WHAT THEY MEAN:

PPI re-launches this Trade Fact series under the political equivalent of storm warnings and lowering clouds, in the U.S and worldwide.  Looking abroad, publics abroad appear more tempted than at any time in decades to believe that their country’s gain must entail another’s loss.  Looking inward, they seem increasingly at risk from authoritarian populists and illiberal political parties.  And on a different level of analysis, trust among big-power governments has eroded; and the institutions and agreements built up since the Second World War to safeguard security and promote shared growth – whether NATO, the World Trade Organization, the European Union – accordingly seem ever more fragile.

Against this ominous backdrop, in concert with like-minded policymakers and intellectuals in the U.S. and elsewhere, PPI aspires to help – by (a) offering new ideas and projects for a liberalism besieged and in need of revitalization; (b) rebutting unfounded cynicism and pessimism, which often are more the cause than the reflection of deteriorating ideals and institutions; and (c) highlighting the successes of active government joined with open exchange of goods, services, and ideas.  In this spirit, the first in this new Trade Fact series notes three successes of liberalism-writ-large:

Half the World’s People Have Received COVID-19 Vaccinations This Year:  22 months after the discovery of a previously unknown coronavirus in Wuhan, government, non-profit, and private-sector investment in medicine development, production technologies, and distribution has provided vaccination shots to 47.8% of the world’s public – that is, 3.7 billion people – with 150 million more shots going into arms each week.

Low-Income Work Has Contracted by Two Thirds Since 2000:  The International Labor Organization finds that in 2020, about 8% of the world’s 3.5 billion workers earned ‘extreme poverty’ wages.  That is, for 280 million workers, a day’s labor brought $1.90 or less in constant 2011 dollars.  In 2000, the ILO’s figure was 26% of 2.76 billion workers, or 720 million.  The difference – 440 million people – implies that, on average, every day since the turn of the millennium, 68,000 workers (and along with them, tens of thousands of their children and relatives), have escaped deep poverty.

1.07 Million International Students Are Enrolled in American Universities: Despite Trump-era efforts to close borders, America remains the world’s top choice for study abroad, home to 1.07 million of the world’s 5.8 million international students.  Their tuition and expenses count as an “export of services” in trade accounts; in 2020, this came to $39 billion.  (For context, this is 2% of the $2.13 trillion in total U.S. exports; alternatively, by comparison, U.S. farm exports totaled $150 billion in 2020 and auto exports $59 billion.)  Over the long term, the effects are likely larger.  Surveys from the mid-2010s suggest that about half of foreign grad students take U.S. jobs after their degree, contributing to consumer demand, business creation, and perhaps especially – given that half of them are in engineering, math, and science – to American science and technology.   Despite neo-Maoism and U.S.-China tension, 372,000 Chinese students make up the largest single cohort of the 1.07 million.  After classes and commencements, some will stay on to work, while others return to join China’s next-generation elites in business, civil service, arts and media, and so to help shape these institutions’ role in Chinese domestic policy, daily life, and international affairs.

To ignore storm warnings and lowering clouds is reckless.  The proper response to them is to identify those parts of a roof or a wall that may leak or give way in heavy weather, shore up their weaknesses or replace them with something better.  It is equally important, however, to identify areas of strength, build upon them, and draw on the lessons they offer.  Metaphorical examples appear, in the response of government, non-profit, and private-sector science to a unique medical emergency; in the road out of poverty a still largely open global economy offers the world’s poor; and in the short- and long-term good that can come from education and exchange of ideas.  In such things one can see breaks in the clouds, patches of sunlight ahead, and foundation for PPI’s belief that the liberal project remains vital, successful, and worth defending.


FURTHER READING

COVID resources –

Oxford University’s “Our World in Data” project summarizes the state of COVID vaccination, worldwide and by country.  Top performers are Portugal, with 86% of the public fully vaccinated, the United Arab Emirates at 84%, Iceland at 81%, and Spain at 79%.  The U.S. is at 56%, tied with Ecuador and just ahead of El Salvador’s 55%.  The chief challenge in the United States is the galling one of foolish ‘vaccine hesitancy’ and perverse policymaking (e.g. attempts by some state governments to stigmatize or even ban ‘vaccine mandates’, including those of private businesses). The chief challenge worldwide, by contrast, remains lack of access:  in very poor countries, on average, only 2.8% of people are vaccinated.  Our World in Data on COVID-19 vaccinations by country: https://ourworldindata.org/covid-vaccinations

The State Department outlines U.S. donations of vaccines to developing countries:  https://www.state.gov/covid-19-recovery/vaccine-deliveries/

Peterson Institute scholar Chad Bown and CFR analyst Thomas Bollyky examine the multinational supply chains – U.S., France, Switzerland, U.K., Spain, India, South Africa, Korea, etc. – that created the vaccines, production centers, and delivery systems:  https://www.piie.com/publications/working-papers/how-covid-19-vaccine-supply-chains-emerged-midst-pandemic

The working poor –

The International Labour Organization’s Employment and Social Outlook 2021 examines the world labor market and the impact of Covid, with working-poor figures through 2020.  From 2019 to 2020, the estimate of men and women in extreme low-income work rose from 6.6% to 7.8% of all workers, implying that the Covid pandemic pushed about 35 million workers back into deep poverty last year:  https://www.ilo.org/global/research/global-reports/weso/trends2021/WCMS_795453/lang–en/index.htm

Also from the ILO, a closer look from 2019 at the state of extreme-low-income work, comparing slightly dated with figures up to 2000-2018: https://ilo.org/wcmsp5/groups/public/—dgreports/—stat/documents/publication/wcms_696387.pdf

 Students –

For international students, education is a long-term investment; in trade statistics, it is a form of “exports of services” and a source of revenue.  The annual “Open Doors” statistical review looks at international students in the U.S. (and American students abroad) by state and university of study, country of origin, and more: https://opendoorsdata.org/annual-release/

 Principles –

PPI’s Trade and Global Markets Project supports American leadership to build a fairer, more stable, more prosperous world economy.  To this end, through publications, events, and commentary, and in concert with likeminded intellectuals and policymakers at home and worldwide, we will advocate open markets, support for scientific and technological innovation, and individual choice; environmental sustainability; and special concern for the poor at home and abroad.  Complementing this future agenda, we will oppose and critique isolationist populism and nativism; call for reform of regressive, antiquated, and ill-conceived elements of the U.S. trade regime; and offer positive approaches to the social stresses of globalization.


ABOUT ED

Ed Gresser is Vice President and Director for Trade and Global Markets at PPI.

Ed returns to PPI after working for the think tank from 2001-2011. He most recently served as the Assistant U.S. Trade Representative for Trade Policy and Economics at the Office of the United States Trade Representative (USTR). In this position, he led USTR’s economic research unit from 2015-2021, and chaired the 21-agency Trade Policy Staff Committee.

Ed began his career on Capitol Hill before serving USTR as Policy Advisor to USTR Charlene Barshefsky from 1998 to 2001. He then led PPI’s Trade and Global Markets Project from 2001 to 2011. After PPI, he co-founded and directed the independent think tank ProgressiveEconomy until rejoining USTR in 2015. In 2013, the Washington International Trade Association presented him with its Lighthouse Award, awarded annually to an individual or group for significant contributions to trade policy.

Ed is the author of Freedom from Want: American Liberalism and the Global Economy (2007).  He has published in a variety of journals and newspapers, and his research has been cited by leading academics and international organizations including the WTO, World Bank, and International Monetary Fund. He is a graduate of Stanford University and holds a Master’s Degree in International Affairs from Columbia Universities and a certificate from the Averell Harriman Institute for Advanced Study of the Soviet Union.

Read the full email and sign up for the Trade Fact of the Week

PPI Announces Hire of Edward Gresser to Lead PPI’s Trade and Global Markets Policy

Today, the Progressive Policy Institute (PPI) announced that Edward “Ed” Gresser will join PPI as the Vice President of Trade and Global Markets policy. Ed returns to PPI after working for the think tank from 2001-2011. He most recently served as the Assistant U.S. Trade Representative for Trade Policy and Economics at the Office of the United States Trade Representative (USTR). In this position, he led USTR’s economic research unit from 2015-2021, and chaired the 21-agency Trade Policy Staff Committee.

“PPI is thrilled to welcome our erstwhile colleague Ed Gresser back after his years of distinguished service with the United States Trade Representative,” said Will Marshall, President of PPI. “Ed is one of America’s most trenchant analysts and writers on trade and global markets. Ed’s expertise and understanding of the vital role trade plays in ensuring a dynamic and competitive U.S. economy can help President Biden and pragmatic progressives in the administration undo the damage done by his predecessor’s detour into protectionism.”

Ed began his career on Capitol Hill before serving USTR as Policy Advisor to USTR Charlene Barshefsky from 1998 to 2001. He then led PPI’s Trade and Global Markets Project from 2001 to 2011. After PPI, he co-founded and directed the independent think tank ProgressiveEconomy until rejoining USTR in 2015. In 2013, the Washington International Trade Association presented him with its Lighthouse Award, awarded annually to an individual or group for significant contributions to trade policy.

Ed is the author of Freedom from Want: The Global Economy and American Liberalism (2007), and has been published in a variety of publications including the Wall Street Journal, Foreign Affairs, and U.S. News and World Report. He is a graduate of Stanford University and holds a Master’s Degree in International Affairs from Columbia Universities and a certificate from the Averell Harriman Institute for Advanced Study of the Soviet Union.

The Progressive Policy Institute (PPI) is a catalyst for policy innovation and political reform based in Washington, D.C. Its mission is to create radically pragmatic ideas for moving America beyond ideological and partisan deadlock. Learn more about PPI by visiting progressivepolicy.org.

Follow the Progressive Policy Institute.

###

Media Contact: Aaron White – awhite@ppionline.org

Biotech Innovation: Two Important Questions

INTRODUCTION

It’s rare when a single acquisition can offer insight into two different important questions in innovation. But the proposed purchase of cancer-diagnostic developer Grail — a startup with tremendous potential — by gene-sequencing leader Illumina is just that pivotal. First, is it pro-innovation for European antitrust regulators to have the power to block a deal involving two American biotech companies that do no substantial business in Europe? We argue that such “regulatory imperialism” by the EU has the potential to slow down biotech innovation, especially given the region’s generally lagging performance in biotech (BioNTech notwithstanding).

Second, under what conditions is vertical integration a socially beneficial strategy for accelerating innovation? Successful innovation in the biosciences often combines risk-taking by small companies with the development and regulatory resources of larger companies. We conclude that excessive antitrust focus on blocking vertical integration in the biosciences could impede the development of important new products and treatments.

These issues go far beyond Illumina and Grail. But it’s helpful to have the facts about this particular case. Grail has spent the past five years developing a diagnostic capable of screening for 50 different cancers at once — a test set to launch this year — while Illumina makes the hardware that performs those tests.  Illumina offered to buy Grail, with the idea of integrating Grail’s technology with its own, to simplify the process of using gene sequencing for clinical diagnostics on a massive scale. If successful, this would dramatically reduce the cost of performing cancer screenings.

The Federal Trade Commission (FTC) intervened to block the acquisition, worried that Illumina would block potential competitors of Grail from using its gene sequencers. Illumina promised to supply these competitors with gene sequencing equipment and supplies without price increases.  The FTC, through a complicated series of maneuvers that are not relevant to this paper, temporarily pulled back from its intervention to allow the European Commission to take the first swing at blocking the acquisition. The EU antitrust regulators are planning to rule by July 27 on whether to clear the merger.

And here’s where we come to the first issue: Should the EU antitrust regulators be considering a biotech deal that by the ordinary rules would not come under their jurisdiction? As the Wall Street Journal notes, “Since the merger doesn’t qualify for antitrust review under the bylaws of the European Union or any member states, the Commission asked countries to invoke Article 22 of the EU’s Merger Regulations. This rarely used provision allows countries to refer transactions to the Commission when their governments lack jurisdiction.”

This fits the general EU strategy of “regulatory imperialism.” Rather than focusing on innovation, the EU has tried to position itself as the global leader in regulation in a variety of areas, from artificial intelligence to chemicals to GMOs to data privacy.  The European approach to regulation has been framed by the precautionary principle, which puts less weight on the benefits of innovation and more on the potential harms.

That risk-avoiding approach is one important reason why Europe has consistently lagged in biotech. European biotech is not nonexistent — after all, Pfizer partnered with a German biotech firm, BioNTech, to develop a very successful COVID-19 vaccine. Nevertheless, data from the Organisation for Economic Co-operation and Development shows that business spending on biotech research and development (R&D) in the EU comes to roughly one-third that of the U.S.

Tacitly accepting European jurisdiction over American biotech deals has the potential to slow down commercialization of important technologies. According to the New York Times, Europe has been “a world leader in technology regulation, including privacy and antitrust.” In a recent speech, Emmanuel Macron said that during its turn at the helm of the EU presidency, France would “try to deliver a maximum of regulation and progress.” When the EU sets the global standard on regulation and companies choose to comply with it everywhere (even where standards are lower), that’s known as the “Brussels effect.”

First, on privacy, the General Data Protection Regulation (GDPR) has become a de facto floor on policy for many large multinational companies. The problem for companies — especially in biotech and software — is that there are very high fixed costs to product development (and low marginal costs for distribution), and reworking a product for a different regulatory environment is often more trouble than it’s worth. That leads to a race to the top (or bottom, depending on your perspective) in terms of regulation.

In its first few years in effect, GDPR’s flaws have become manifest and EU policymakers are starting to consider reforms to the law. According to a recent joint report from three academy networks, “GDPR rules have stalled or derailed at least 40 cancer studies funded by the US National Institutes of Health (NIH).” The authors go on to note that “5,000 international health projects were affected by GDPR requirements in 2019 alone.” This flawed model for privacy regulation has unfortunately been exported around the globe.

Second, mergers between globally competitive firms with a presence in multiple jurisdictions have to get clearance from multiple antitrust enforcement agencies. If a single agency in a large market objects to the merger, the deal might fall apart completely. For example, a merger between U.S.-based Honeywell and U.S.-based General Electric collapsed after the EU competition enforcement agency decided to block the deal out of concern it would create a monopoly in jet engines. Of course, the EU’s investigation of the Illumina-Grail merger takes that one step further, given the fact that Grail doesn’t conduct any business in the EU, and Illumina’s business there isn’t substantial, with revenues below the usual threshold for antitrust scrutiny for both the European Commission and individual countries.

The next important question raised by the Illumina-Grail purchase is the role of vertical integration.  We start with the simple observation that innovating in complex systems is both risky and expensive. That’s true in frontier industries such as electric vehicles and e-commerce, and it’s especially true in the biosciences, with the high hurdle set by the need for safety and efficacy.

The cost to bring a drug to market is a huge barrier for startups to remain independent. A 2020 paper in JAMA examining 63 of the 355 new therapeutic drugs and biologic agents approved by the U.S. Food and Drug Administration between 2009 and 2018 found that the median capitalized research and development cost per medicine was $985 million. Other studies using private data have found even higher figures. A 2019 study published in the Journal of Health Economics estimated the average cost to reach approval at $2.6 billion (post-approval R&D costs nudge the total up to $2.9 billion).

Should these complex systems be built by one company, which is better able to integrate all the pieces of the puzzle? (Tesla comes to mind when we are discussing electric vehicles). Or is it better to distribute the risk over multiple companies? The biotech industry has mostly followed this second strategy. Risky R&D is done by small firms with financing by high-risk capital such as venture firms. Then the resulting product, if successfully passing clinical trials, is acquired by a larger firm for commercialization.

In some cases, both strategies are important. The initial stages of research and development of a new idea are farmed out to a smaller company and financed by risk capital. And then when it comes time to build the idea into a complex system, the actual integration is done by a larger company, which has an established distribution network and marketing resources for reaching patients in a targeted fashion. This can greatly accelerate the development process.

The question, then, is whether this integration would be easier within one company or at arms-length. Illumina has made an offer to buy Grail, which was originally spun off from Illumina in order to get funding from risk capital. The goal, obviously, is to accelerate the development of this game changing integration.

The FTC has objected to the acquisition, because the agency worries about Illumina prioritizing its internal customer over other potential cancer diagnostics systems. Certainly, it’s true that some vertical mergers are anti-competitive. “Killer acquisitions” are one type of merger in biotech that is anti-competitive in nature. A recent paper from Ederer, Cunningham and Ma found that between 5% and 7% of acquisitions in the pharmaceutical industry are killer acquisitions, meaning the incumbent firm purchased the startup with the intention of shutting down one or more of its products, because the legacy company offers a competing product that is more profitable.

There is increasing agreement among regulators on both sides of the Atlantic that acquisitions — especially in the pharmaceutical sector — need to be scrutinized more closely if products have the potential to be killed off post-acquisition. One heuristic a regulator might use is to look at how much overlap there is between the acquired product and the incumbent, especially in terms of benefits and use cases. If the incumbent’s product is still on patent, then there is a significant incentive to acquire a competitive product that might be disruptive to an acquirer’s portfolio and shut down the new product.

But there’s little evidence that most vertical acquisitions are anti-competitive. Vertical mergers — or the combination of two companies at different layers of the supply chain — are less likely than horizontal mergers — acquisition of a direct competitor — to be anticompetitive as both economic theory and empirical evidence show. Regarding the theory, firms are engaged in “make or buy” decisions all the time. If they choose to produce an input in-house instead of buying it from the market, then they have vertically integrated (either by developing the capacity on their own or by acquiring another firm with that capacity). Prohibiting firms from vertically integrating via acquisition would forgo some of the benefits of economies of scope and economies of scale. A literature review by Lafontaine and Slade showed that vertical mergers were procompetitive on average.

One of the most common reasons vertical mergers are less suspect than horizontal mergers has to do with “double marginalization.” If you assume two products are monopolies in their respective markets, then the producers of those products will each charge the monopoly price, which is higher than socially optimal. If the two products are complementary, then the companies can merge and create a positive sum scenario by lowering prices. Lower prices reduce deadweight loss, which is good for consumers, and lead to higher profits for the combined firm.

We note that if the FTC ruling stands, it will mean that developers of complex integrated systems will choose to keep their technologies in house rather than spinning them out and run the risk of having an acquisition blocked. And innovative development will be slowed rather than accelerated.


PPI Statement on Senate Confirmation of Katherine Tai as USTR

Today, Will Marshall, President of the Progressive Policy Institute (PPI) released the following statement on the unanimous bipartisan Senate confirmation of Katherine Tai to be the Biden Administration’s United States Trade Representative:

“Without doubt, Katherine Tai will capably represent America on the world stage, and help us regain our footing with our international trading partners after the previous administration’s ill-conceived detour into blunderbuss tariffs, protectionism and gratuitous ally-bashing.

“Our new Administration faces unprecedented challenges in trade – caused not only by COVID-19, but also by China’s routine flouting of global trade rules. We also have rare and exciting opportunities for growth and innovation in digital trade policy, which – if addressed robustly – will benefit American businesses, workers, and producers for generations to come.

“The Progressive Policy Institute congratulates USTR Tai on her historic confirmation, and commends the Biden Administration for this excellent choice in leadership.”

The Progressive Policy Institute (PPI) is a catalyst for policy innovation and political reform based in Washington, D.C. Its mission is to create radically pragmatic ideas for moving America beyond ideological and partisan deadlock. Learn more about PPI by visiting progressivepolicy.org.

Media Contact: Aaron White – awhite@ppionline.org

###

A Transatlantic Digital Trade Agenda for the Next Administration

CAN A NEW DEMOCRATIC ADMINISTRATION RECONSTRUCT DIGITAL TRADE POLICY WITH EUROPE FROM THE ASHES OF TTIP?

As the global leader in digital trade, the United States has a big stake in ensuring that international rules facilitating its continued expansion are put in place.

The Obama Administration’s bold agenda to establish these rules across Europe and the Asia-Pacific did not yield lasting success, with the failure of the Transatlantic Trade and Investment Partnership (TTIP) negotiations and the Trump Administration’s withdrawal from the Trans-Pacific Partnership (TPP). Nonetheless, the key elements of US digital trade policy enjoy bipartisan policy support, providing a promising basis for the next Democratic administration to re-engage with Europe, our biggest digital trading partner.

Part 1 of this issue brief explains why international rules are needed to protect and facilitate digital trade. Part 2 describes the turbulent past decade in transatlantic trade relations and the growing importance of US digital trade with Europe. Part 3 explains why the US government and the European Union (EU), during TTIP negotiations, were unable to agree on a digital trade chapter, including a key provision guaranteeing the free flow of data. Finally, Part 4 suggests how two parallel sets of trade negotiations beginning early this year — between the EU and the United Kingdom (UK) and between the United States and the UK — may help a future US Administration end the transatlantic stand-off over digital trade.

1. THE CASE FOR DIGITAL TRADE AGREEMENTS

The United States leads the world in the fast-growing digital economy.1 Digital services include not just information and communications technology (ICT) but also other services which can be delivered remotely over ICT networks (e.g. engineering, software, design and finance).2 Although trade in digital services is hard to measure precisely, there is no mistaking that it has become one of the fastest-growing areas for the United States internationally. In 2017, all types of digital services made up 55% of all U.S. services exports, and yielded 68% of the U.S. global surplus in services trade.3 The beneficiaries of this burgeoning area of trade are not just the U.S. technology giants, but also many smaller and medium-sized companies that develop and sell digital services or use ICT networks for marketing products to consumers.

More than a decade ago, the Office of the US Trade Representative (USTR) recognized the US comparative advantage in digital services trade and began to pursue binding rules with a number of foreign governments. TPP negotiations were the first major step in this direction. The TPP agreement signed by the Obama Administration included provisions designed to protect against practices harmful to digital trade. It prohibited:

  • Customs duties and other discriminatory measures on digital products like e-books, movies, software and games;
  • Requirements that data or computing facilities be localized in the foreign jurisdiction;
  • Discriminatory treatment of crossborder data flows;
  • Obligations to use local technology, content, or suppliers;
  • Discriminatory foreign standards or burdensome testing requirements; and
  • Requirements for disclosing source code and algorithms.

TPP also included facilitative measures:

  • Requiring governments to adopt measures to protect against on-line fraud and guard consumers’ personal information;
  • Promoting cooperative approaches to cybersecurity; and
  • Facilitating the use of electronic authorizations and signatures for e-commerce, electronic payments, and other on-line applications

President Trump’s decision to withdraw the United States from TPP left US digital services companies exposed to these harmful practices in the Asia-Pacific region. From the perspective of liberalizing and expanding US digital trade, it was a spectacular own goal.4 However, USTR quickly set out to partially mitigate its effect by seeking bilateral trade accords with some TPP signatories. Digital chapters in the updated Korea-US Free Trade Agreement (KORUS), the new US-Mexico-Canada Free Trade Agreement (USMCA), and, most recently, the Japan-US Digital Trade Agreement largely duplicate the TPP’s digital trade provisions.

2. THE TRANSATLANTIC TERRIBLE TEENS

Transatlantic trade politics also has seen its share of drama over the past decade. The comprehensive TTIP negotiations begun in 2013 badly backfired. Popular fears of US corporate domination flared across Europe, the EU’s member states failed to back the project enthusiastically, and progress between US and European Commission negotiators on the many subject-matter chapters proved glacial. As the Obama Administration came to an end, TTIP talks were quietly shelved.

The Trump Administration’s trade agenda for Europe has been strikingly different. It has concentrated on rectifying the sizeable US deficit in merchandise trade with the EU, which reached an estimated record high of $168 billion in 2018.5 The President demanded that the EU, which is solely responsible for the bloc’s international trade relations, address the imbalance in such areas as steel, aluminum and automobile trade. (He also somewhat mystified Germany by insisting that it negotiate directly with the United States to reduce the U.S. goods trade deficit.) The US Government determined that a number of jurisdictions including the EU had engaged in trade practices unfair to US steel and aluminum, and imposed higher tariffs on these imported products as a consequence; higher tariffs on European autos so far remain a threat.

In the summer of 2018, European Commission (then-)President Jean-Claude Juncker managed partly to defuse transatlantic tensions by agreeing to negotiate with the United States on increasing EU purchases of US-made industrial goods and on related regulatory standard.

Juncker also committed to greater European purchases of US natural gas and soybeans. Trump in return agreed not to proceed with unilateral tariff increases for the time being. Since the advent of new EU leadership late last year, USTR Robert Lighthizer and his Commission counterpart Philip Hogan have stepped up efforts toward reaching, before the 2020 US presidential election, a limited accord in the areas identified by Trump and Juncker.

Throughout the decade, the volume of goods and services trade across the Atlantic has continued to grow steadily. The United States and the European Union are still each other’s largest trading partners. US goods exports to the EU grew to $293 billion in the first eleven months of 2018, a 13% increase over the previous year.6 US exports of all types of services to the EU reached a record $298 billion in 2017, resulting in a $66 billion surplus in 2017.7 European countries comprise four of the top ten export markets for US services, and in 2017 the Union as a whole absorbed 37% of US services exports.8

Despite the continuing growth in trade, the next Democratic administration will inherit a transatlantic trade policy environment characterized by an unusually high level of tension and distrust. TTIP’s failure appears to have stifled any impulses in Washington and Brussels simply to resume the slog towards a comprehensive trade agreement. Still, there are good reasons for Democrats to not abandon the work begun on digital trade during the TTIP negotiations.

3. THE US DIGITAL TRADE IMPASSE WITH EUROPE

Since Trump’s trade ambitions with the EU remain firmly focused on the goods deficit, the question of whether the United States should resume direct digital services trade negotiating efforts with Europe seems likely to be deferred till the next administration. From an economic perspective, the case for US re-engagement is compelling. In 2017, the United States exported $204.2 billion in digital services to Europe, generating a surplus in this area of more than $80 billion.9 International data flows, measured in terms of capacity for data bandwidth, also are heavily skewed in a transatlantic direction. Cross-border data transfers between the United States and Europe, by this measure, are 50% higher than those between the United States and Asia.10 In sum, the transatlantic area is the world’s largest for digital trade.

During TTIP negotiations, the United States proposed language close to TPP digital trade provisions, but the EU objected to a number of them. One of the most important was a US proposal to guarantee cross-border ‘free flow’ of electronic information for business purposes, and to put bounds on the extent to which European public policy measures relating to personal privacy could serve as an exception to unrestricted data flows.

The United States proposed that public policy exceptions be allowed, but that they be subjected to long-established World Trade Organization (WTO) disciplines. These WTO rules allow for exceptions for legitimate public policy objectives, so long as they do not constitute arbitrary or unjustifiable discrimination or disguised restrictions on trade, and they are narrowly tailored to achieve a public policy objective.11 Alleged breaches could ultimately be addressed through a formal dispute settlement system, if necessary.

The EU regarded the US proposal as an attack upon its unfettered discretion to apply its privacy laws to data moving across the Atlantic, and it rejected the possibility of any discipline based upon WTO rules. The EU’s rejection of objective limits on its potential public policy measures leaves it free to invoke privacy rules as a basis to discriminate against US digital service providers or to protect local competitors. The issue remained firmly deadlocked when TTIP negotiations were set aside.12 Since then, the United States and the EU have not re-engaged bilaterally on digital trade rules.

Both governments are among the eighty countries participating in a low-profile multilateral negotiation on electronic commerce (e-commerce) launched a year ago under WTO auspices, however.13 In Geneva, the United States has tabled a similar proposal to its TTIP and TPP language; the EU so far has not managed to offer a counter-proposal. For the time being, it seems unlikely that the WTO negotiations will yield quick success in settling the disagreement between the EU and the United States and other like-minded countries on regulatory limits to the free flow of data.14

A new Democratic Administration should engage bilaterally with the EU to see if there might be scope for a targeted digital trade agreement, but without softening its insistence on a rigorous free flow of data obligation. Agreeing with the EU on the proper scope for public policy exceptions should not be an impossible task, as WTO rules provide a useful framework. Moreover, it is conceivable that the new leadership of the European Commission at some point will consider jettisoning its insistence on a selfjudging privacy exception, in favor of language more consistent with international trade law.

4. BREXIT AND DIGITAL TRADE

Following Britain’s January 31 departure from the European Union, it now has embarked on the urgent task of negotiating its future economic relationship with the EU. Brexit notwithstanding, the EU will remain the UK’s principal trading partner; 45% of overall UK exports in 2018 were destined for the Continent.15 At the end of 2020, however, if no accord is reached, EU tariffs and quotas on UK exports would revert to much higher WTO tariff levels, which would have a damaging effect on UK-EU trade.

In addition to fixing tariff levels, Britain and the UK also must agree on the extent to which the UK will continue to adhere to EU regulations in a host of areas – for example, workers’ and consumers’ right, the environment, and antitrust. Many observers expect the UK-EU talks on these non-tariff barriers to be difficult and drawn out, likely stretching beyond the 2020 deadline. Despite continuing tough UK rhetoric, the parties may well settle for a ‘phase one’ agreement on goods tariffs, and grant themselves an extension into 2021 or beyond to complete the rest of a comprehensive agreement.

Setting the terms for digital trade with the EU will be particularly important for Britain. UK services exports to the EU yielded a £77 billion surplus in 2018, more than offsetting a deficit in goods trade.16 Approximately three-quarters of Britain’s data flows are with EU countries17, making harmonization with the Continent on privacy regulation crucial for its thriving data-dependent businesses, such as financial services.

In its negotiating mandate for the future economic partnership agreement with the UK, the EU specifically calls for provisions facilitating digital trade, but also indicates an intention to “address data flows subject to exceptions for legitimate public policy objectives, while not affecting the Union’s personal data protection rules.”18 The UK’s counterpart negotiating mandate similarly calls for measures to facilitate the flow of data to and from the EU, and expresses an ambition to go beyond the digital trade provisions in the EU’s trade agreements with other countries.19

The Union previously had pledged to decide before the end of 2020 whether the UK’s postBrexit privacy protections are ‘adequate’ in relation to those on the continent; an adequacy determination would be by far the most favorable and efficient legal basis for data flows across the Channel.20 The EU should have leverage in this separate negotiation, and as a result the UK’s future data protection regime should remain generally close to the EU’s General Data Protection Regulation (GDPR). An adequacy finding is not a foregone conclusion, however, as Britain may be reluctant to alter its wide-ranging surveillance laws.21

The United States is also a very important trading partner for the United Kingdom, accounting for 15% of Britain’s total trade.22 Nearly a fifth of Britain’s exports head across the Atlantic, more than double the share it sends to Germany, its next-biggest trading partner.23 US services trade with the United Kingdom exceeds goods trade, and is growing; US services exports measured $74.1 billion in 2018, generating a surplus of $13.3 billion that year with Britain.24 There are more transatlantic undersea cable connections transmitting data directly between the United States and the United Kingdom than with the rest of Europe combined.25 Foreign affiliates of U.S. multinationals supply more information services in the United Kingdom than in any other European country.26

The Office of the US Trade Representative and the UK Department for International Trade started negotiations on a bilateral trade agreement in May. The United States seeks a comprehensive agreement with the British, including a chapter on digital trade in goods and services and cross-border data flows modeled on the most recent U.S. bilateral successes with other countries.27 The United Kingdom’s negotiating objectives with the United States are broadly consistent with the United States perspective on digital trade.28 They specifically mention the importance of preserving UK data protection rules in an agreement with the United States.29 The United States officially attaches the highest priority to these negotiations and aims to complete them in 2020.30 Privately, US officials acknowledge that the United Kingdom will have to give greater priority this year to redefining its all-important trading relationship with the EU, before US-UK talks can advance definitively.

The most that US and UK trade negotiators may be able to deliver this year is a partial agreement setting tariffs and quotas for goods. A new Democratic administration would be well-advised to build upon whatever progress is achieved with the UK this year, and to give particular priority in the future to agreement on digital trade. The latter could even take the form of a stand-alone agreement on digital trade, as was done in the Japan – United States Digital Trade Agreement, if a comprehensive US-UK trade agreement proves a longer-term prospect.

The United States and the United Kingdom should be able to make rapid progress on many aspects of a digital trade agreement. Historically, both governments have shared a philosophical commitment to open international trading regimes. Both have highly developed digital economies and leading-edge digital services companies. Each favor free data flows and opposes data localization measures. Intangible factors including similar legal traditions also could speed talks.

The long arm of the European Union will constrain the United Kingdom’s negotiating room on digital trade with the United States, however. The EU may insist that, as part of the price for adequacy, the UK agree not to undermine the Union’s position on data flows in any of the UK’s future trade agreements with third countries. The United States, for its part, presumably would take the same position on this issue as it took in TTIP – that legitimate privacy measures are those permitted under WTO principles rather than by EU fiat.

Still, in the short term, the United States may be better off tackling this tough issue with the United Kingdom than seeking to resolve it bilaterally with the EU. The British are in a tough negotiating position: they must find a way forward on data flows with both the EU and a range of important third country trading partners. UK negotiators will need all their creative legal talents to find a way through this intersection of digital trade and privacy law. If they succeed, the payoff in a settled legal landscape for digital trade across both the Channel and the Atlantic eventually could be substantial. Brexit has generated considerable trade uncertainty, but it also ultimately could yield dividends for digital trade.

The US medical equipment and supply industry: What happened?

America now depends on overseas suppliers for more than half of its medical equipment and supplies, up sharply from a few years ago. That’s based on a PPI analysis of government trade and industry data, What happened?

As we go through this terrible pandemic, U.S. healthcare providers are suffering from a surprising shortage of medical equipment and supplies.  Even after President Trump invoked the Defense Production Act on Wednesday, there doesn’t seem to be an easy spigot of domestic factory production to turn on, and overseas factories are serving their own hardhit populations.

Part of the problem is that the U.S. has become increasing dependent on overseas sources for its medical equipment and supplies.  Until 2016, the U.S. economy consistently maintained a trade surplus in medical equipment and supplies. But things changed in the past few years (chart).  Demand rose and domestic production expanded, hiring 18,000 new workers since 2015.

But here’s the rub: Domestic production of medical equipment and supplies did not expand enough to meet demand. As a result, the long-time trade surplus in medical equipment and supplies turned into a rapidly widening trade deficit, hitting $7 billion in 2019.

As a result, an estimated 52% of medical equipment and supplies now come from outside the United States.


Where is the new surge of imports coming from? It’s not just China. In fact, imports of medical equipment and supplies from Europe have soared by $4.3 billion since 2015, or 33 percent. Imports from Asia (excepting China) are up $2.7 billion, or 43 percent. And of course, with these regions facing their own crisis, the flow of goods has slowed down.

This was not a case of hollowed-out manufacturing–employment in the U.S. medical equipment and supplies manufacturing industry is at an all time high. Nevertheless we didn’t expand fast enough.

In pandemics, like wars, it’s better to have your own factories.


Note: For trade purposes, we track NAICS 3391. For domestic sales and employment, we track the combination of NAICS 339112 and 339113.

Trump Trade Deficit Widens to New Record

Despite all his bluster, the “Trump Trade Deficit” widened to a new record in the third quarter of 2019.  The non-oil merchandise trade deficit hit $1.047 trillion in the third quarter of 2019, in 2012 dollars (annual rate). That’s according to PPI calculations based on new data released by the Bureau of Economic Analysis on November 27. The latest trade deficit beat the previous record set in the fourth quarter of 2018, also under Trump.

These widening trade deficits claw right at the heart of the middle of the country, where farmers and factory workers are suffering under Trump’s misguided policies.  Factory closings just keep coming: Sparta, Wisconsin; Atlanta, Ga; West Plains, Missouri. 

Trump’s trade failures give progressive presidential candidates an opportunity to run a pro-manufacturing,  pro-growth campaign.  They should be advocating policies that jumpstart a new generation of manufacturing entrepreneurs across the country. They should support local distributed manufacturing, which both creates jobs and helps the environment.  Most of all, progressives should come out squarely in favor of a Production Economy that supports America’s core values as a producer rather than a consumer.