FACT: Japanese firms are the top international investors in the United States.
THE NUMBERS: Japanese population –
| Children and teenagers (0-19 years): | 19.5 million |
| 70 years and older: | 21.2 million |
WHAT THEY MEAN:
Speaking to Congress in Joint Session last April, Prime Minister Kishida radiates confidence in the U.S.-Japan alliance and takes some pride in the Japanese place in American economic life:
“We are on deck, we are on task. And we are ready to do what is necessary. The democratic nations of the world must have all hands on deck. I am here to say that Japan is already standing shoulder to shoulder with the United States. You are not alone. We are with you.” … “Japanese companies have invested around 800 billion dollars, creating almost one million American jobs. These are good jobs with half a million jobs in the manufacturing sector alone.”
Newly-minted PPI Senior Fellow and veteran economic journalist Yuka Hayashi picks up on his themes — alliance, partnership, Japanese industry’s American commitments — in PPI’s newest global-economy research paper “Behind Japan’s U.S. Steel Bid: An Aging, Shrinking Home Market,” through the lens of Nippon Steel’s proposed purchase of venerable Pittsburgh-based U.S. Steel.
To start there: Nippon Steel, the world’s fourth-largest steel producer at 43.7 million tons last year, has been a U.S. metal producer since 1984 and is currently the 50% operator of Alabama’s 5-million-ton capacity Calvert steel mill. Its 2023 bid for U.S. Steel, though approved by U.S. Steel’s Board and shareholders, has sparked some U.S. controversy and “economic nationalist” rhetoric. PPI’s Ed Gresser and Diana Moss have examined this through the lens of U.S. foreign direct investment policy and anti-trust law; Hayashi picks up the Japanese side of the story, with a picture of Japanese industrial and manufacturing excellence set against an aging population and in some ways shrinking domestic economy, and a consequent search by leading Japanese firms for options beyond the home islands.
Examined from the U.S. angle, science and industrial data add exclamation points to the PM’s point about the large role of Japanese industry in the U.S. economy. The U.S. Patent and Trademark Office, for example, granted 48,051 U.S. patents to residents of Japan in 2022 (the last year available), which was an eighth of all the 385,433 U.S. patents awarded in total and far beyond PTO’s grants to residents of any country apart from the United States itself. Japan-based businesses, meanwhile, have a “foreign direct investment” stock of $775 billion in the U.S. – a seventh of the $5.25 trillion world total, and more than any other country in the world. (Canada is second at $684 billion and the UK third at $661 billion.) The Japanese firms employ 1.04 million American workers, paying $107.6 billion in wages and salaries — about $103,000 a year on average — and put $13 billion into U.S. research and development. And Kishida’s half a million U.S. manufacturing jobs slightly lowballs the precise figure: the Commerce Department reports 544,000 of the U.S.’ 13 million manufacturing workers at work for Japan-based firms.
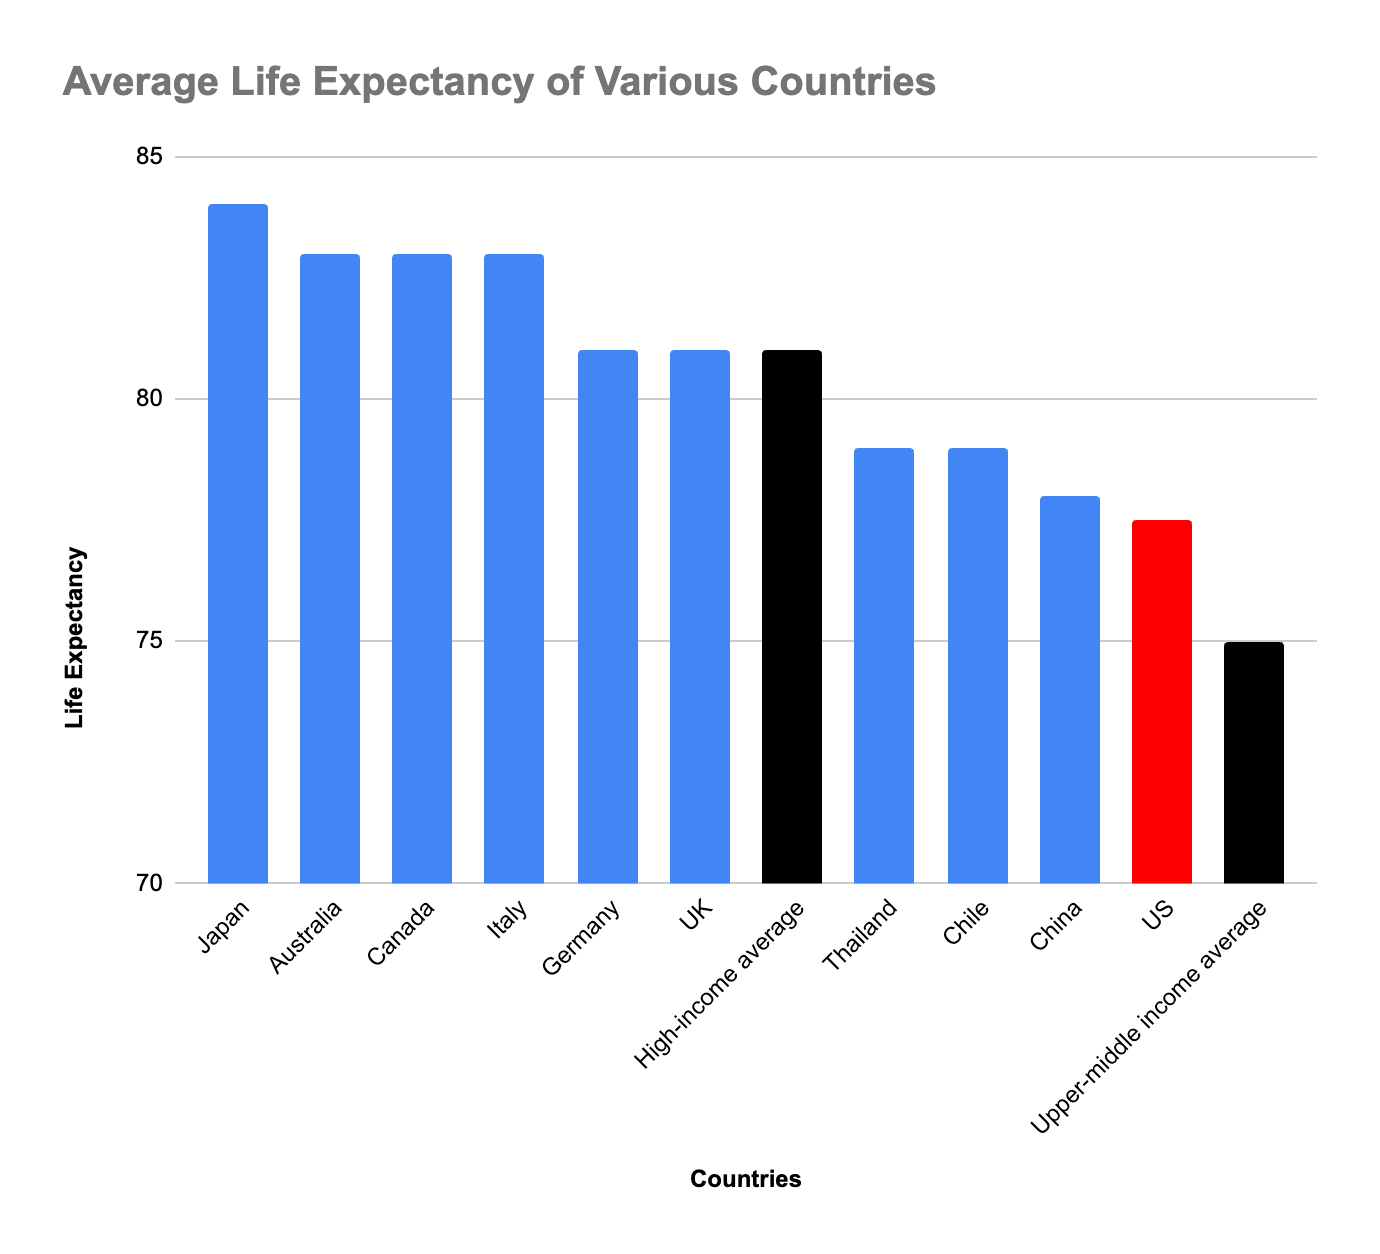
Hayashi’s paper, meanwhile, illuminates the Japanese side of the story: some of the impressive investment figures reflect Japanese businesses’ response to profound demographic and economic challenges at home. Japan’s population has fallen from a 2007 peak of 127.7 million people to 124.1 million and is dropping by over 600,000 per year. The country’s 21.2 million 70-and-olders now outnumber the 19.5 million Japanese children and teenagers. This means fewer workers each year, a smaller consumer base, and lower future growth prospects. The result, she explains, is that with Japan’s home economy slowly contracting, Japanese industry seeks growth by producing and selling abroad:
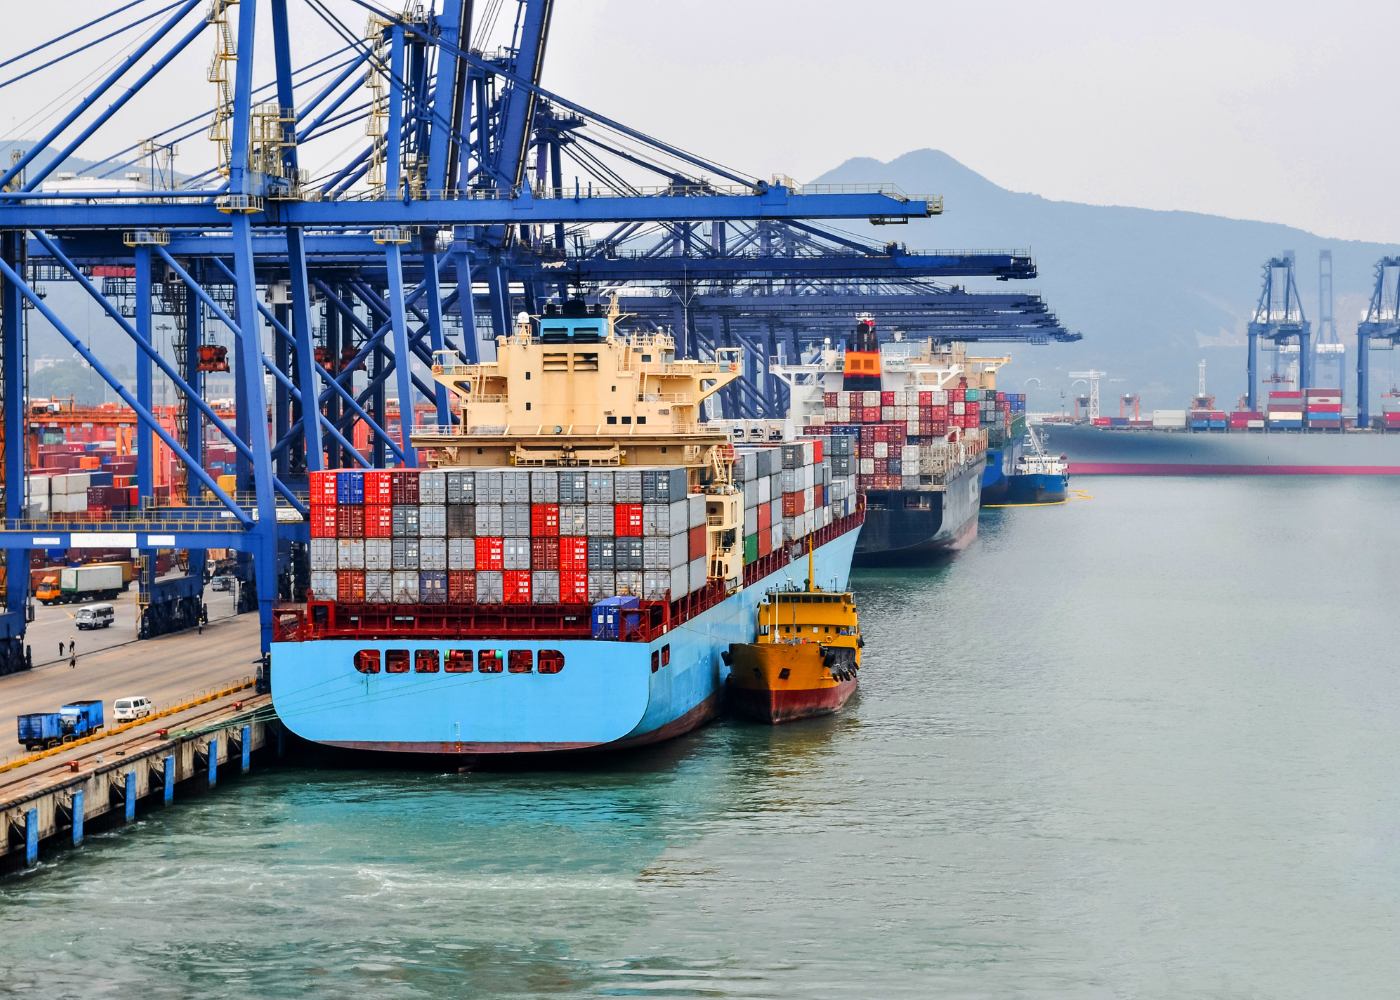
“Combined with sluggish wage growth in recent decades, demand for everything from housing, cars to snack food has been shrinking in Japan. The downturn is likely to intensify. That has pushed Japanese companies, big and small, to expand abroad if they can compete. Overall, Japanese manufacturers are projected to earn 39% of their revenues outside of Japan during fiscal 2023, up from 29% two decades ago, according to a survey of 534 companies by Japan Bank for International Cooperation, a government lender. The companies planned to manufacture 36% of their products outside of Japan, compared with 26% in fiscal 2003.”
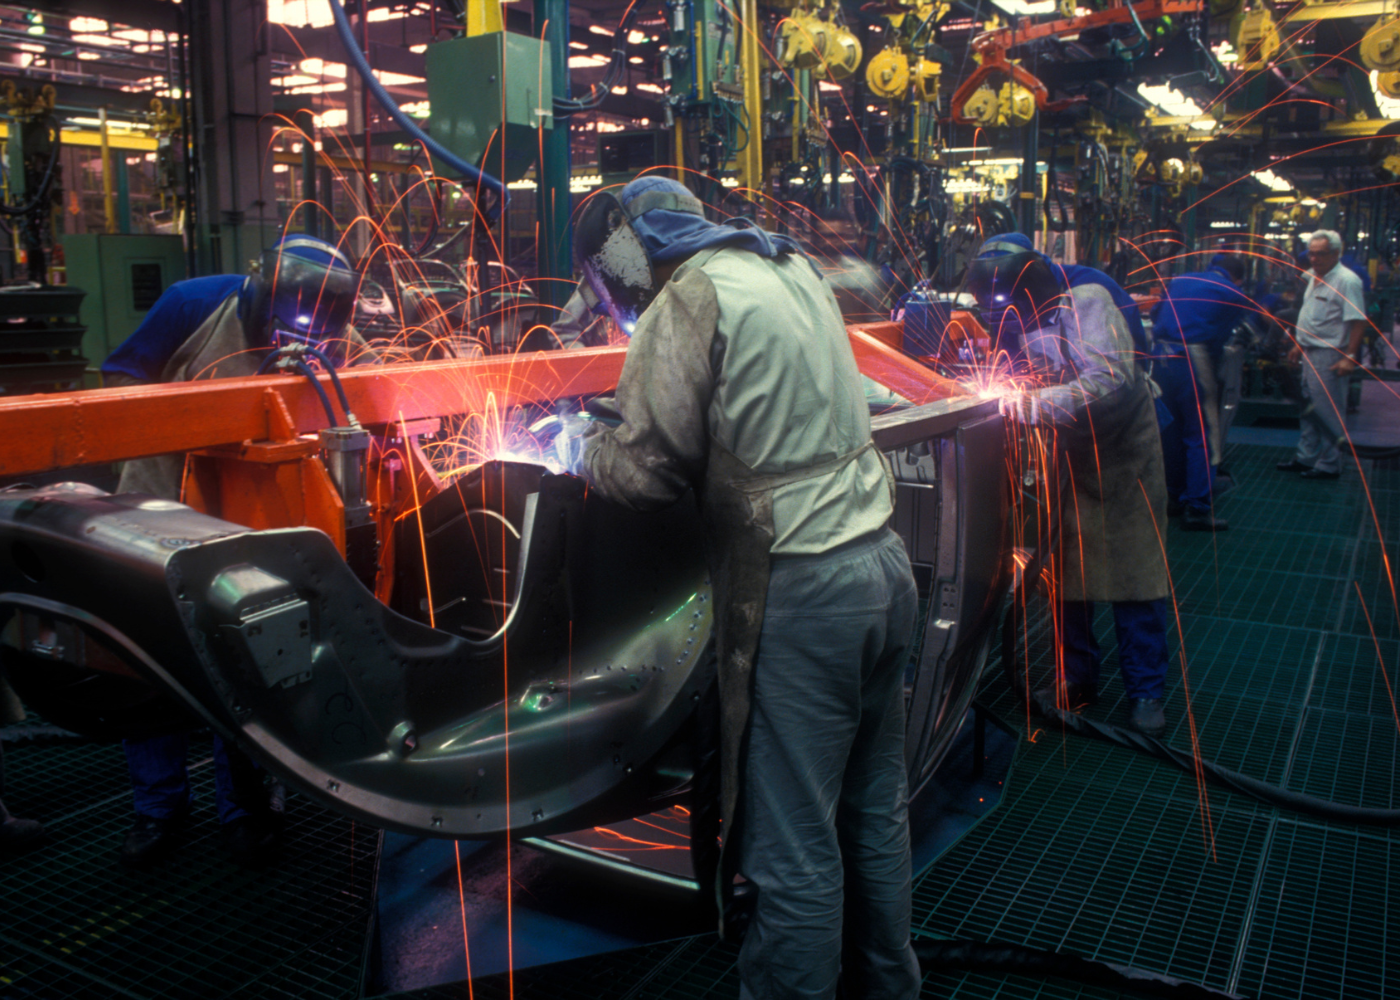
Auto star Toyota, for example, sells 1.7 million of its cars at home and 8.6 million elsewhere; therefore, it now makes only 3 million of its 10 million vehicles in Japan itself, while producing another 3 million in China, the United States, and Thailand, and three million more in factories spread across Europe, Southeast Asia, and Latin America. Nippon Steel is making similar choices. With Japan’s own steel use down from a 99 million-ton peak in 1990 to 58 million tons in 2023, Nippon Steel is closing five furnaces in Japan; meanwhile, since 2019 it has launched a massive joint venture with Euro-Indian firm ArcelorMittal in India, and bought facilities in Sweden, Thailand, and Brazil. Hence its high interest in an American partner. Hayashi concludes that the idea makes sense for both countries:
“Nippon’s emergence as a bidder for a prominent American manufacturer is an inevitable outcome of a changing economic landscape. In the past, Japanese companies came to the U.S. to build factories to escape the impact of trade friction and currency appreciation. Now they are doubling down because there is no longer enough demand at home to support their growth. The U.S. is where they see opportunities. All of this will yield significant benefits for the American economy and workers should the U.S. welcome foreign investment by friendly nations like Japan.
…
“The beneficiaries, in particular, will be American workers without college degrees, who tend to reap greater rewards from good manufacturing jobs. Increased FDI will also mean more of the funding and innovative know-how the U.S. will need to improve productivity, reduce reliance on imports and withstand competition from China. That’s particularly true for the steel industry where companies have struggled with Chinese overcapacity even as they face enormous pressures and funding requirements to shift to greener technologies. The Biden administration’s own “friend-shoring” strategy calls for closer ties and cooperation with allies and like-minded countries. The goal is to strengthen supply chains for critical products in order to strengthen national security and respond to future emergencies. It is difficult to see the wisdom of any response to Nippon Steel’s bid short of embracing the vote of confidence in our marketplace that the Japanese company’s proposed transaction represents.”
FURTHER READING
Yuka Hayashi’s “Behind Japan’s U.S. Steel Bid: An Aging, Shrinking Home Market” looks at Japanese industry, demographic contraction at home, expansion abroad, and American policy choices.
PM Kishida in April on the U.S.-Japan alliance, economic ties, and more.
And U.S. Embassy/Tokyo promotes American exports and pitches U.S. investment.
Japan:
The U.S. Patent and Trademark Office’s most recent patent data.
The Bureau of Economic Analysis’ annual look at international business investment in the U.S. has figures by country and industry, and topics from employment and wages to exports, imports, and R&D. A quick table of current FDI stock value (2022, the most recent year available) for the world, top five, and all others combined:
| World: | $5.255 trillion |
| Japan: | $775 billion |
| Canada: | $684 billion |
| United Kingdom: | $661 billion |
| Germany: | $619 billion |
| France: | $360 billion |
| All other countries: | $2.156 trillion |
And the full release from BEA.
The Japan Statistical Bureau summarizes Japanese demographics, with provisional estimates of population by age through May 2024.
More on Nippon Steel/U.S. Steel:
From the Alabama Department of Commerce, an update on the ArcelorMittal/NS mill at Calvert.
PPI’s Ed Gresser and Diana Moss examine the U.S. controversy from the FDI policy and antitrust points of view.
ABOUT ED
Ed Gresser is Vice President and Director for Trade and Global Markets at PPI.
Ed returns to PPI after working for the think tank from 2001-2011. He most recently served as the Assistant U.S. Trade Representative for Trade Policy and Economics at the Office of the United States Trade Representative (USTR). In this position, he led USTR’s economic research unit from 2015-2021, and chaired the 21-agency Trade Policy Staff Committee.
Ed began his career on Capitol Hill before serving USTR as Policy Advisor to USTR Charlene Barshefsky from 1998 to 2001. He then led PPI’s Trade and Global Markets Project from 2001 to 2011. After PPI, he co-founded and directed the independent think tank ProgressiveEconomy until rejoining USTR in 2015. In 2013, the Washington International Trade Association presented him with its Lighthouse Award, awarded annually to an individual or group for significant contributions to trade policy.
Ed is the author of Freedom from Want: American Liberalism and the Global Economy (2007). He has published in a variety of journals and newspapers, and his research has been cited by leading academics and international organizations including the WTO, World Bank, and International Monetary Fund. He is a graduate of Stanford University and holds a Master’s Degree in International Affairs from Columbia Universities and a certificate from the Averell Harriman Institute for Advanced Study of the Soviet Union.