Renew and Modernize the U.S.’ Trade and Development Program for Poor Countries, Argues PPI’s Ed Gresser

As Congress debates renewal of “GSP” – the Generalized System of Preferences, the U.S.’ largest trade and development program, which waives tariffs on 3500 products for 119 low- and middle-income countries, and requires periodic reauthorization – it is right to take a new look at an old program and update old eligibility rules; but it should also be careful to avoid adding too many new ones, and balance them with fresh looks at old product restrictions, explains a new paper from Progressive Policy Institute (PPI) Vice President of Trade and Global Markets Ed Gresser.

“It is fair to ask governments of countries whose businesses and workers receive duty-free benefits to meet basic requirements, and some of the proposed new criteria are good ideas,” writes Ed Gresser. “But overly long lists of new criteria are likely to create confusion as U.S. policy priorities clash, and could force wholesale expulsion of poorer countries whose capacity to implement policy is lower than that of middle-income countries. This latter risk is particularly troubling.”

Gresser argues that Congress should be commended for endeavoring to update GSP but adding many new eligibility rules without expanding product coverage (which neither of the two major reauthorization bills achieve) risks leaving the revised program less effective than the current version.
The paper makes the following recommendations, which allow for rebalancing the GSP system while eliminating U.S. policy conflict and the exclusion of poor countries with weak capacity:

  • Set a limited number of priorities, by adding several important new issues (for example, environmental policy) to the current list of 15 eligibility criteria, but restraining the number of new criteria.
  • Make these priorities achievable for countries with good will but limited means and capacity.
  • Simplify, by defining some proposed new criteria as “advisory” issues to consider, rather than requirements countries must meet, and clarify that to the extent possible, enforcement of criteria should not endanger the interests of the people the criteria aim to support.
  • Add balancing new benefits, for example a reform of CNL rules proposed by Representatives Stephanie Murphy (D-Fla.) and Jackie Walorski (R-Ind.), and inclusion of some products currently barred from GSP.


Read the paper and expanded policy recommendations here:

Ed Gresser is Vice President and Director for Trade and Global Markets at PPI. He most recently served as the Assistant U.S. Trade Representative for Trade Policy and Economics at the Office of the United States Trade Representative (USTR).

The Progressive Policy Institute (PPI) is a catalyst for policy innovation and political reform based in Washington, D.C. Its mission is to create radically pragmatic ideas for moving America beyond ideological and partisan deadlock. Learn more about PPI by visiting progressivepolicy.org.

###

Media Contact: Aaron White – awhite@ppionline.org

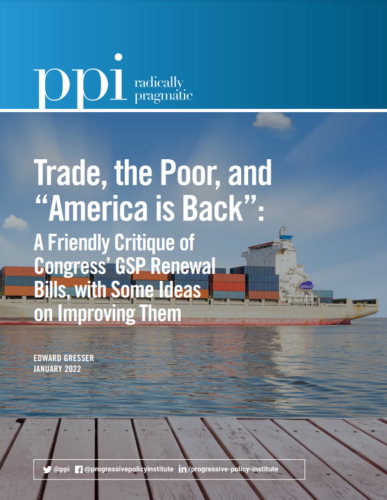
Trade, The Poor, and “America is Back”: A Friendly Critique of Congress’ GSP Renewal Bills, with Some Ideas on Improving Them

INTRODUCTION

Should the United States help the poor abroad?  If so, how much?  Should we ask something of their governments in exchange?  And what if we ask something the governments can’t fully do?  These are the core questions as Congress discusses renewal of the Generalized System of Preferences.

This system, known for short as “GSP,” is the U.S.’ largest trade and development program.  Dating to 1974, it waives tariffs on about 11% of imports from 119 low- and middle-income countries and territories, so as to encourage U.S. buyers to source some products from them rather than larger, wealthier economies.  Balancing these benefits, it imposes some eligibility rules, for example asking “beneficiary countries” to take steps toward enforcement of labor rights, intellectual property, and other matters.

GSP lapsed at the end of 2020, and thus has provided no benefits in over a year.  Both parties in Congress appear in principle to support its renewal.  The Senate has passed a bipartisan reauthorization bill (endorsed as well by House Republicans); and while the House is divided by party on several specific issues, actual opposition seems scarce.  Assuming one believes the U.S. should try to help the poor, this is good news — for countries enrolled in GSP, for the workers and businesses that draw the benefits, and also, in a small but tangible way, for the Biden administration’s effort to show that America “is back” and has not slumped into inward-looking passivity or resentment.

On the other hand, the renewal bills share a weakness: they try to make a small program do too much.  GSP is somewhat old and creaky.  Its product coverage is limited by product exclusions and “Competitive Need Limitation” (CNL) rules dating to the 1970s, and its eligibility criteria have remained unchanged since the late 1990s.  Both could be better.  But most of Congress’ work appears to have gone into adding new eligibility rules, and neither bill proposes adding anything to GSP’s relatively modest list of goods eligible for tariff waivers.  It is fair to ask governments of countries whose businesses and workers receive duty-free benefits to meet basic requirements, and some of the proposed new criteria are good ideas.  But overly long lists of new criteria are likely to create confusion as U.S. policy priorities clash, and could force wholesale expulsion of poorer countries whose capacity to implement policy is lower than that of middle-income countries.  This latter risk is particularly troubling, since some new proposals appear so strict that few if any low-income countries could meet them.

So while Congress deserves applause for an apparent intent to renew the program, and willingness to take a fresh look at old rules, there is reason for concern that the updated program may achieve less than the old.  Congress should therefore think about (a) how much it wants to add, and (b) a balance between new criteria and new export opportunities.  Some relatively simple revisions could help:


  1. Set a limited number of priorities, by restraining the number of new criteria in the system.
  2. Make these priorities achievable for countries with good will but limited means and capacity.
  3. Simplify, by defining some proposed new criteria as “advisory” issues to consider, rather than requirements countries must meet, and clarify that to the extent possible, enforcement of criteria should not endanger the interests of the people the criteria aim to support.
  4. Add balancing new benefits, for example through a reform of CNL rules proposed by Representatives Stephanie Murphy (D-Fla.) and Jackie Walorski (R-Ind.), and inclusion of some products currently barred from GSP.


READ THE FULL PAPER:


New Research from PPI Shows Harmful Impact of the Klobuchar-Grassley Antitrust Bill to American Consumers and Competition

Today, the Progressive Policy Institute (PPI) released a new research deck on how Senators Amy Klobuchar and Chuck Grassley’s anti-tech antitrust bill, the American Innovation and Choice Online Act, could do irreparable harm to the services and products millions of Americans rely on every day.

“The bill is notable for combining very broad language, very heavy penalties, and very narrow grounds for affirmative defense,” said Dr. Michael Mandel, Vice President and Chief Economist for the Progressive Policy Institute. “The problem is that this three-way combination goes far beyond imposing normal compliance costs and regulatory burdens, creating huge financial and business risks for even ordinary business decisions.”

Well-liked services such as Google Search, Fulfillment by Amazon, and the Apple App Store, could have to be substantially reconfigured and/or limited, according to the deck’s authors, Mandel, John Scalf of NERA Economic Consulting and D. Daniel Sokol of University of Southern California Gould School of Law. Popular smartphone features and user reviews on online marketplaces could be affected as well. These proposed standards would not only undermine the tech companies that would be subjected to the legislation, but inevitably harm its users.

Consumers could also suffer from reduced innovation, as the targeted companies would have to obtain regulatory pre-approval with every new product or meet the unspecified criteria in the bill.

A mark-up of the bill is scheduled for Thursday of this week in the Judiciary Committee. Read PPI’s statement on the markup and the bill here.

View the full deck here:

This deck was authored by Michael Mandel of the Progressive Policy Institute, John Scalf of NERA Economic Consulting, and D. Daniel Sokol of the University of Southern California Gould School of Law. 

The Progressive Policy Institute (PPI) is a catalyst for policy innovation and political reform based in Washington, D.C. Its mission is to create radically pragmatic ideas for moving America beyond ideological and partisan deadlock. Learn more about PPI by visiting progressivepolicy.org.

###

What Does the American Innovation and Choice Online Act Mean for Consumers and Competition?

The American Innovation and Choice Online Act Would Likely Harm Consumers


SUMMARY:

Recently, Senator Klobuchar introduced the American Innovation and Choice Online Act (“AICOA”) proposing sweeping regulations for a handful of tech companies that operate digital services used by both businesses and consumers.

While the Bill is ostensibly intended to prevent self-promotion and discriminating against competitors, it would end up sweeping up a broad range of ordinary business operations that provide huge benefits to consumers.

The Bill is notable for its combination of very broad and vague language for defining illegal activity; very heavy penalties for companies and corporate officers; and very narrow language for affirmative defense.

Moreover, the Bill makes no mention of consumer benefits as an affirmative defense and hence advances the interests of certain businesses over the interests of consumers and small businesses that use such services.

The problem is that this three-way combination goes far beyond imposing normal compliance costs or regulatory burdens, by creating huge financial and business risks for even ordinary business decisions.

In response, well-liked services such as Google Search, Fulfillment by Amazon, and the Apple App Store, will have to be substantially reconfigured and/or limited. These proposed standards would not only undermine the tech companies that would be subjected to the legislation, but inevitably harm its users as well.

In fact, because the Bill fails to distinguish between markets that are competitive and markets that suffer from market power, it would inevitably harm competition in digital markets as well. The Bill would essentially make it less likely that either firms subjected to the regulations or ones arbitrarily protected from them would invest in new, innovative consumer products.

Consumers could lose out on a range of products and services offered by the targeted companies that would be swept up by the Bill. Just a few of the products and services that could hampered by the Bill include:

  • Search engines that concentrate on delivering the most relevant results to consumers from Google
  • Online shopping with massive product catalogs and two-day shipping from Amazon
  • Smartphones and a vast library of third-party apps that have revolutionized everyday life from Apple


Consumers would also suffer from reduced innovation, as the targeted companies would have to obtain regulatory pre-approval with every new product to meet the unspecified criteria in §2(a) and (b) of the Bill.

Far beyond its stated goals, the Bill could end up harming consumers by breaking the products and services that they have come to greatly value and depend on.

View the full research deck by Dr. Michael Mandel of the Progressive Policy Institute, Dr. John Scalf of NERA Economic Consulting, and Professor D. Daniel Sokol of the University of Southern California Gould School of Law.

READ THE RESEARCH:


The Truth About Digital Inflation and the American Consumer

In a statement released after the latest consumer price report, President Biden remarked on the “meaningful reduction in headline inflation” but indicated that there was still “more work to do, with price increases still too high and squeezing family budgets.”

In particular, the Biden Administration wants to protect consumers by identifying markets where sellers are taking advantage of the pandemic and supply chain snarls to raise prices. That’s a great plan.

At the same time, it’s also important to recognize and acknowledge those industries where price increases have been moderate and restrained.

In that spirit, we examine the inflation performance of the digital sector of the economy, encompassing tech, ecommerce, broadband, and related industries. These companies have come under fire for a variety of different reasons, some deserved, some not.

In this blog item we will show, based mainly on government data, that digital companies are helping hold down inflation at a time when prices are soaring in many other parts of the economy.  For the Democrats and the Biden Administration, this is a success story they can build on.

The Historical Perspective

We’re used to computers getting cheaper over time, as they become more powerful and versatile. The Internet opened up entirely new dimensions of free websites, with everything from recipes to news to maps and directions. Long distance phone calls have effectively become free. Broadband networks, both wired and wireless,  have become faster, connecting almost every part of the country. Content has become more varied and cheaper, at the same time.

There is no doubt that technology has been a profoundly disinflationary force historically. But what about today? The GDP inflation rate was 4.6% in the year ending with the third quarter of 2021. That’s a big jump from the 1.7% GDP inflation rate in the third quarter of 2019, before the inflation. How much of that acceleration is coming from the tech sector?

The answer is, precisely none.  As part of its calculation of GDP, the Bureau of Economic Analysis (BEA) calculates price changes by industry. It turns out that inflation rates in four key digital industries are not only negative but falling (Table 1).  For example, the inflation rate in the “data processing, internet publishing, and other information services” industry fell from +0.5% in 2019 to -1.1% today.

The same is true for the other three key digital industries. Digital is still following the historical trends of being disinflationary.

Table 1. Digital is Still Disinflationary

(change in value-added prices)

year ending
2019Q3 2021Q3
Computer and electronic product manufacturing -0.1% -1.8%
Broadcasting and telecommunications -0.9% -2.6%
Data processing, internet publishing, and other information services 0.5% -1.1%
Computer systems design and related services -0.2% -2.8%
Gross domestic product 1.7% 4.6%
Data: BEA, based on Table TVA104-Q


Ecommerce and inflation

Let’s now consider ecommerce prices in particular.  As of the third quarter of 2021, ecommerce accounted for 13% of retail sales according to the Census Bureau. That’s back on the long-term trend line after a temporary pandemic-induced jump.

But still, there’s an important question: Why isn’t ecommerce a bigger share of retail sales, given how much we are all shopping online? One reason might be that online prices tend to rise at a slower rate than brick-and-mortar prices, according to the available evidence. Indeed, government data shows that the long-term trend of ecommerce has been and continues to be disinflationary.

Consider this: The BLS measures changes in gross margins in all major retail industries, where the margin is defined as the selling price of a good minus the acquisition price for the retailer.  Margins include all costs, such as labor, capital, and energy, plus profits, taking into account gains in productivity. A slower rise in margins translates directly into less inflation for consumers, all other things being equal.

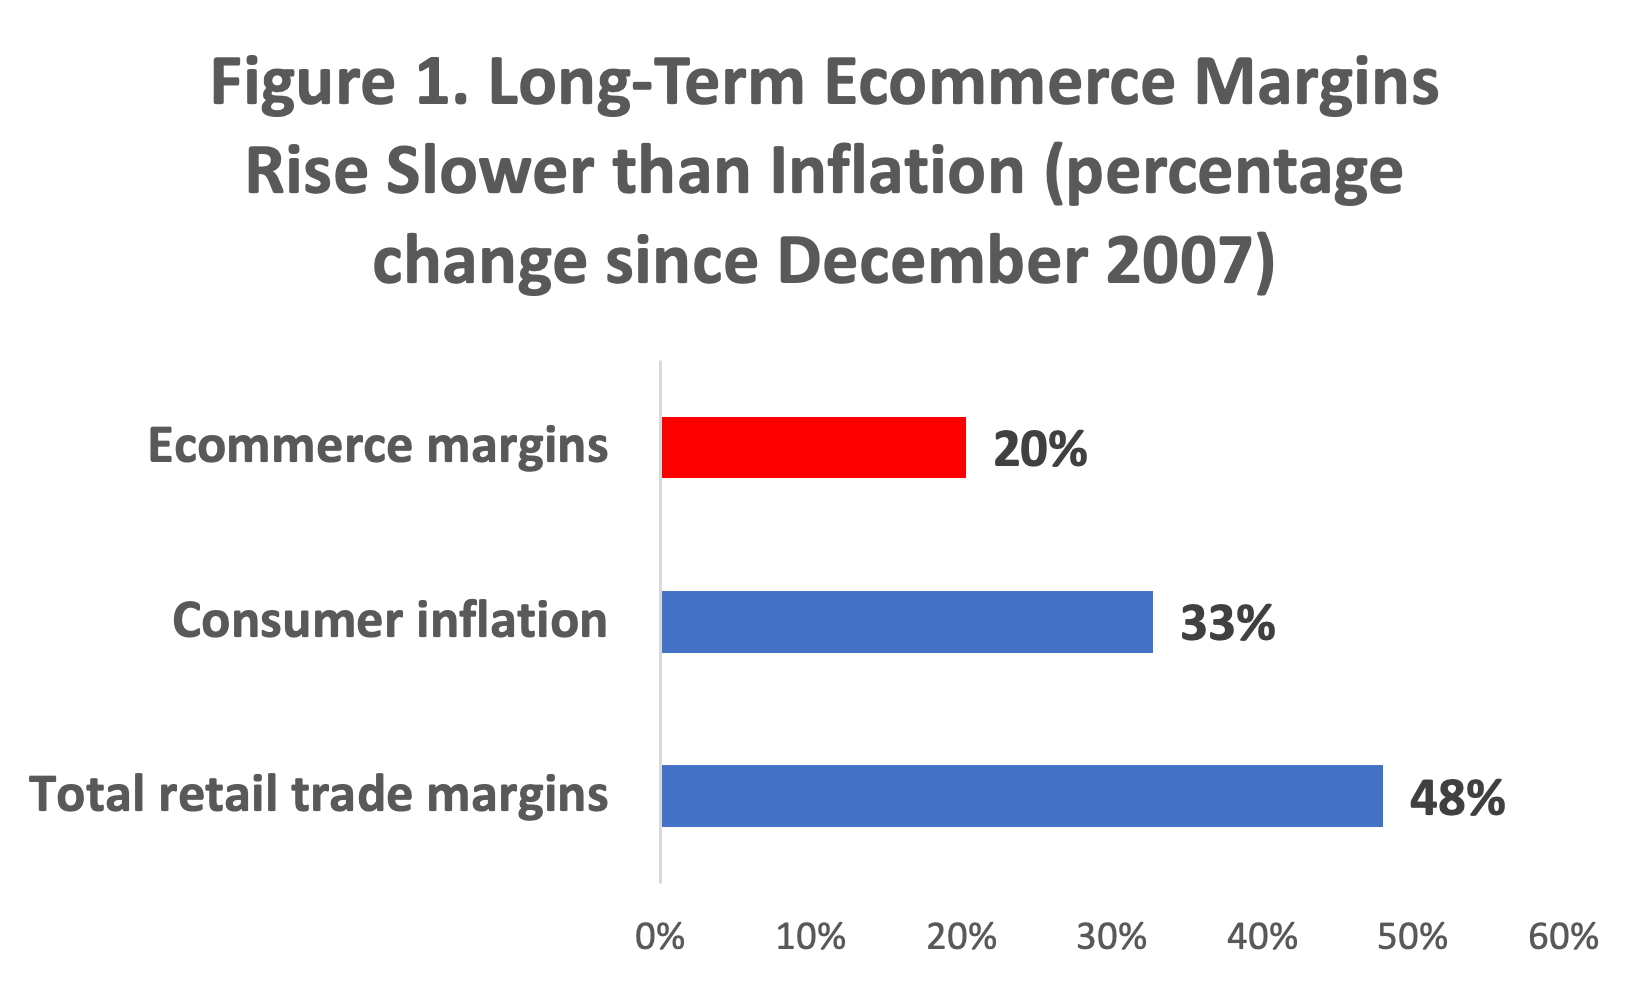
Between December 2007 and December 2021—a 14-year stretch that included the financial crisis, the long boom, and the pandemic—margins in the electronic shopping industry rose by 20%, according to BLS data (Figure 1). Over the same stretch, consumer prices rose by 33%. The implication: Ecommerce companies were accepting thinner margins in real terms, and passing those benefits onto consumers.

By comparison, the data for the overall retail industry has shown a much worse inflation performance, measured by margins. Margins for the total retail industry rose by 48% since December 2007, much faster than consumer inflation. As a result, real margins for the retail industry as a whole have risen, putting upward pressure on consumer prices.

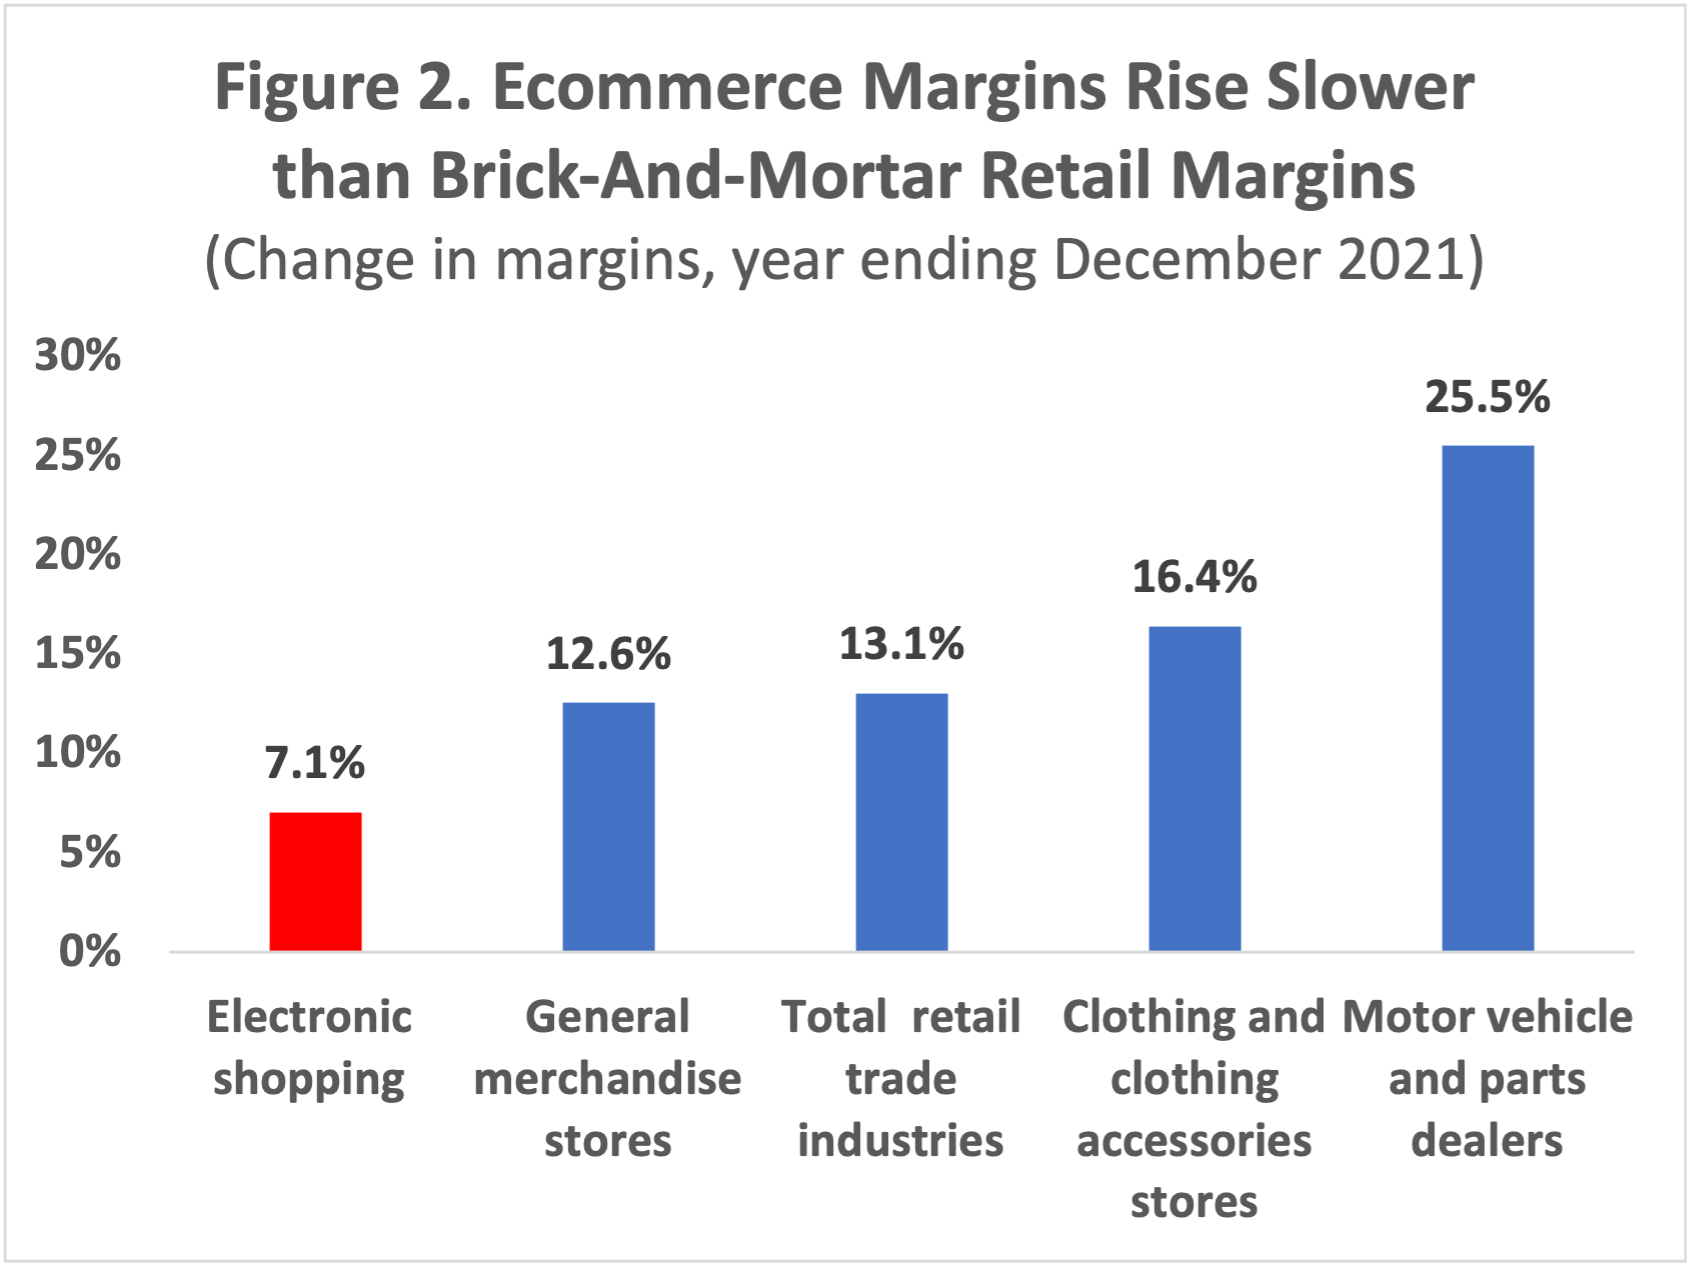
Now let’s look at the current situation. Even in today’s inflationary burst, ecommerce stands out as a force holding down margin increases compared to the rest of retail. In the year ending December 2021, overall retail margins rose by 13.1%. Meanwhile margins at general merchandise stores like warehouse outlets rose by 12.6%. Margins at auto dealers and other auto-related retailers rose by a stunning 26%, far outpacing inflation

By comparison, over the past year, ecommerce margins only rose by 7.1%, about the rate of inflation (Figure 2). These results are completely consistent with the economic literature, which mostly concludes that prices for online goods rise slower than the prices for comparable goods sold offline.  A 2018 paper co-authored by Austan Goolsbee (CEA head under President Obama) found that online inflation was more than a full percentage point lower than the corresponding official consumer price index. Sometimes the difference can be much greater. The latest “Digital Price Index” report issued by Adobe shows that the price of furniture and bedding sold online rose by 3% in the year ending November 2021. Meanwhile the official CPI for furniture and bedding, including all brick-and-mortar stores, rose by 12%,


Moreover, the slow growth of ecommerce margins came at the same time that ecommerce fulfillment centers were dramatically boosting employment and pay. Over the last year, the average hourly earnings for production and nonsupervisory workers in the warehousing industry rose by 19.4%. That covers the great majority of ecommerce fulfillment centers.

The ability to simultaneously hold down prices for consumers, reduce shopping time for households, and boost pay for workers, represents a rare win-win proposition. What could be better?


Smartphones, Telecom, and the Digital Economy

During the pandemic, the daily life of Americans has been supported by wired broadband and wireless networks, by content delivered to the home and to wireless devices such as smartphones. This Digital Economy has been essential for work, school, and social contacts in the midst of these bizarre years.

But equally important, the Digital Economy is also a low-inflation economy. While the price of old economy products like cars, clothing, and gasoline has been soaring, the inflation rate of digital goods and services like smartphones, video and audio services, wireless, and internet access has remained low.

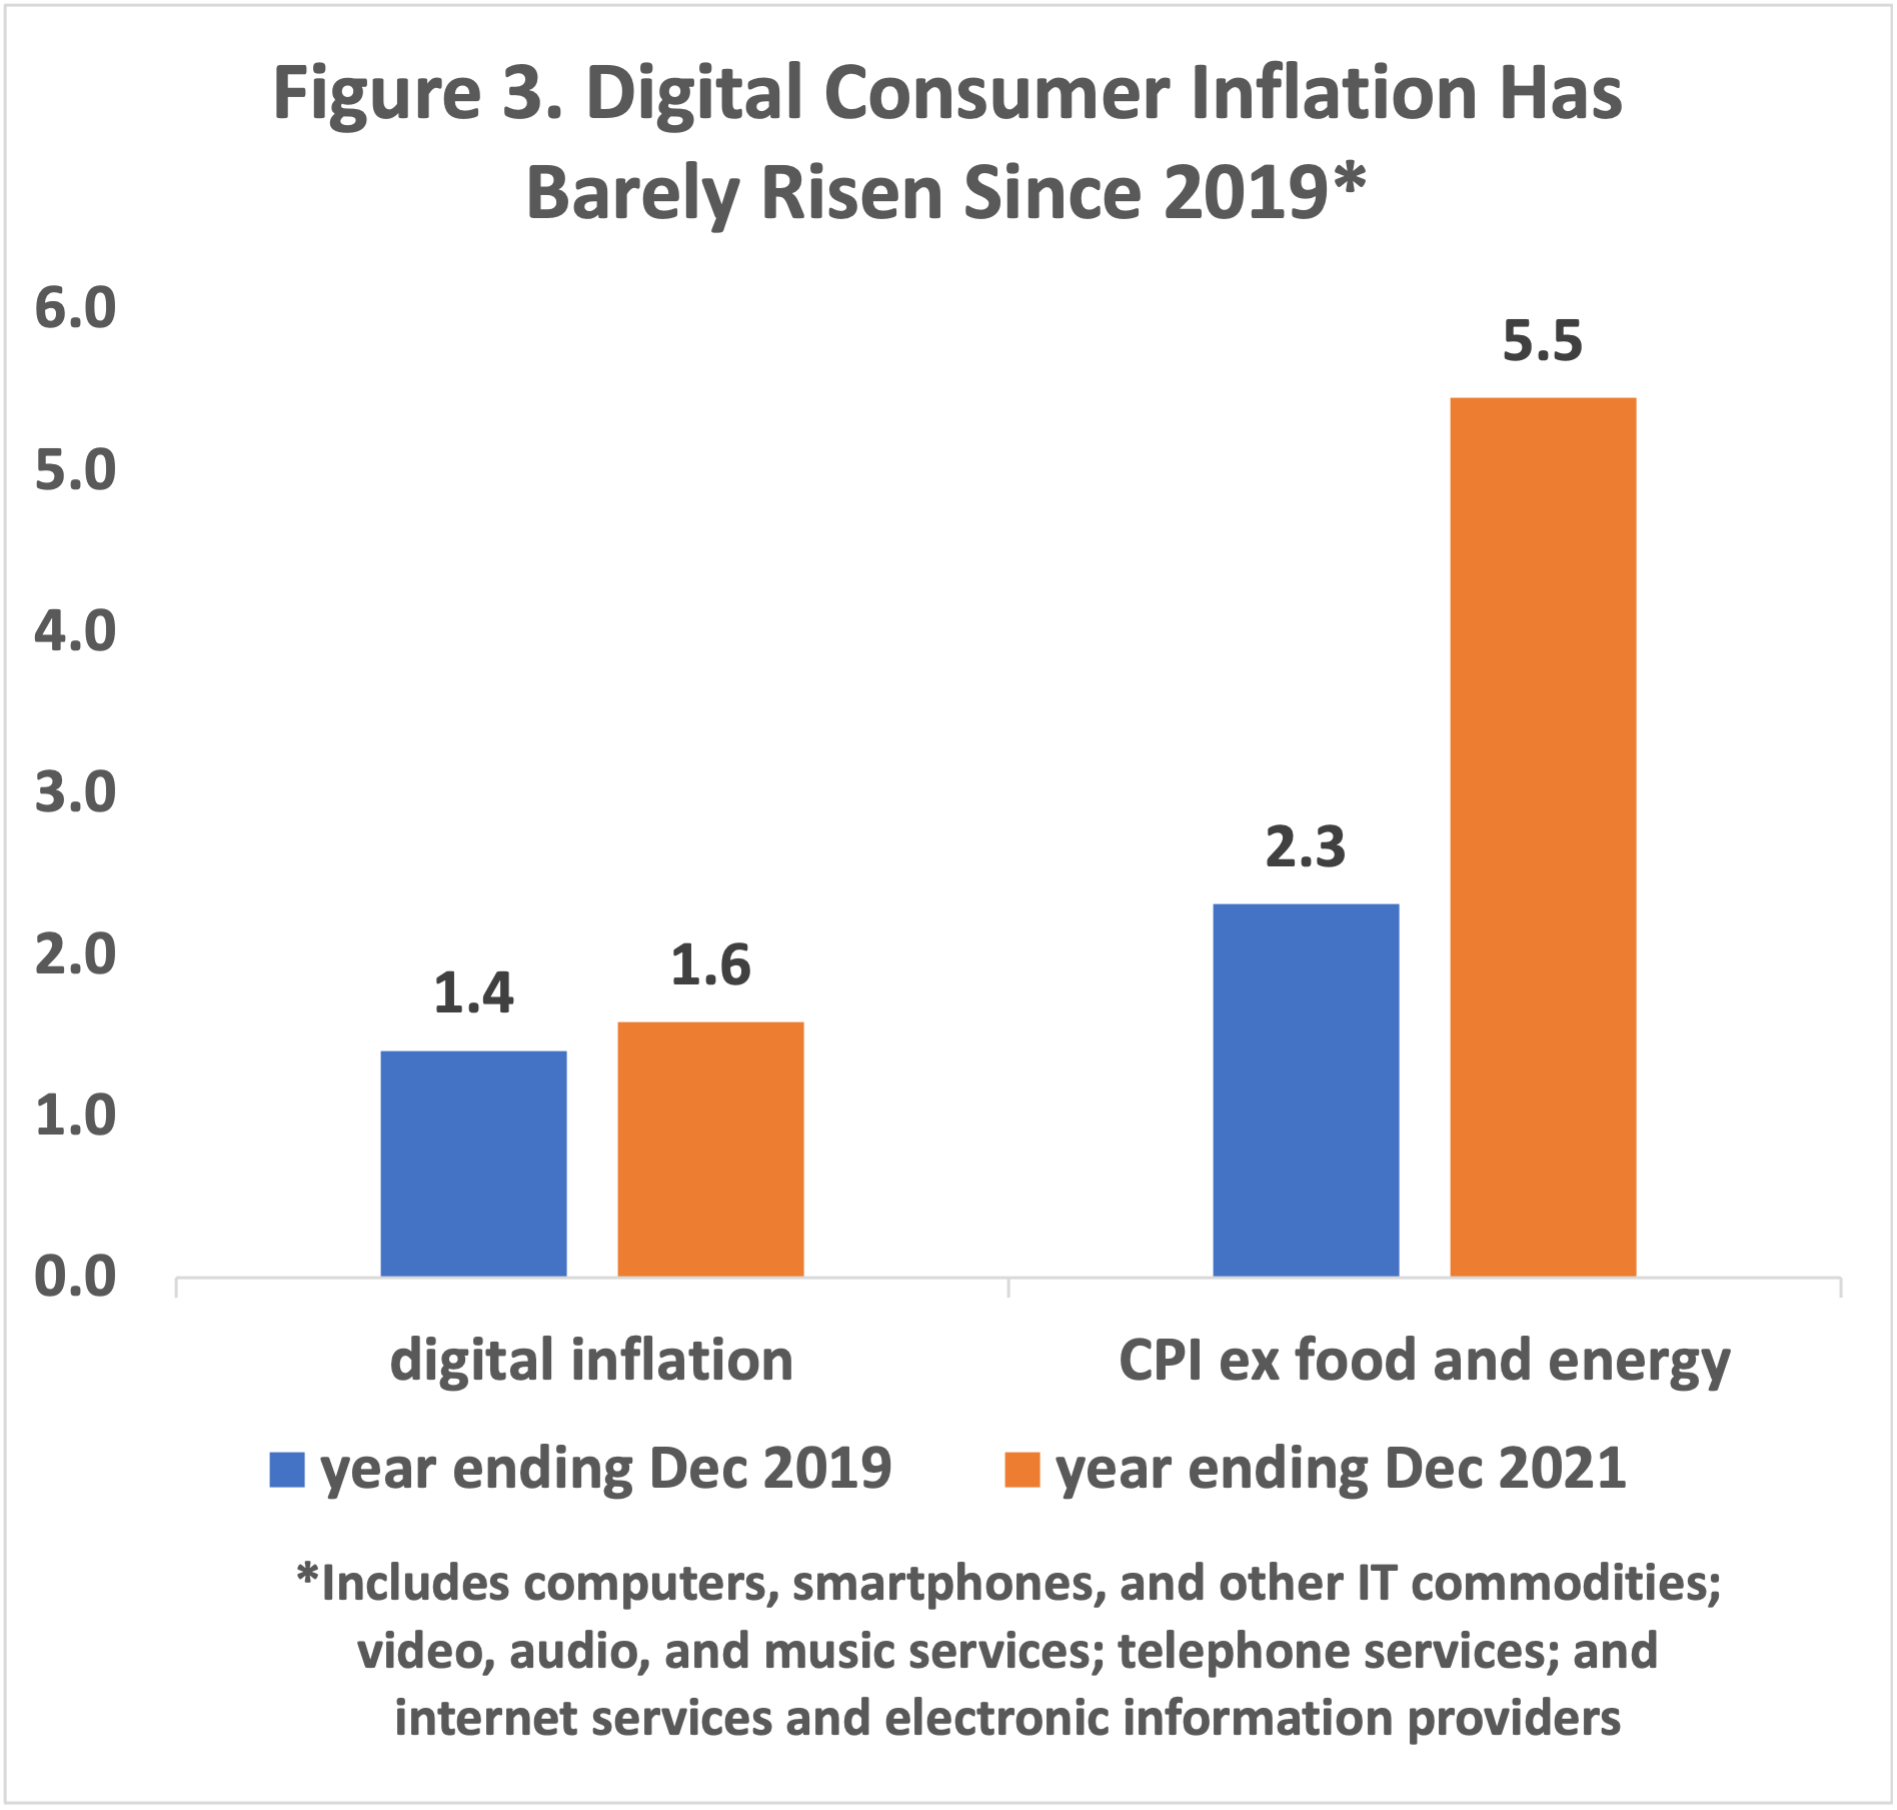
According to our analysis of BLS data, the digital consumer inflation rate was only 1.6% in the year ending December 2021, barely above the 1.4% rate in the year ending December 2019, before the pandemic started (Figure 3). This figure includes computers, smartphones, and other IT commodities; video, audio, and music services; telephone services; and internet services and electronic information providers. We use BLS spending shares to weight the components of the digital inflation rate.

Looking at individual items, the inflation rate for video and audio services, including cable and satellite television service, fell from a 3.1% rate in 2019 to a 2.6% rate in 2021. The inflation rate for telephone services, including wireless, went from 1.6% in 2019 to 0.7% in 2021. Perhaps most striking, the price of smartphones continued their relentless plunge in 2021, dropping in price by 14% after adjusting for quality.

By contrast, there was a huge jump in core consumer inflation, which went from 2.3% in 2019 to 5.5% in 2021. Note that even if some of the components of digital inflation are mismeasured, as some have argued, looking at the change over time should be more accurate if the size of the mismeasurement stays the same.

Tech Inflation

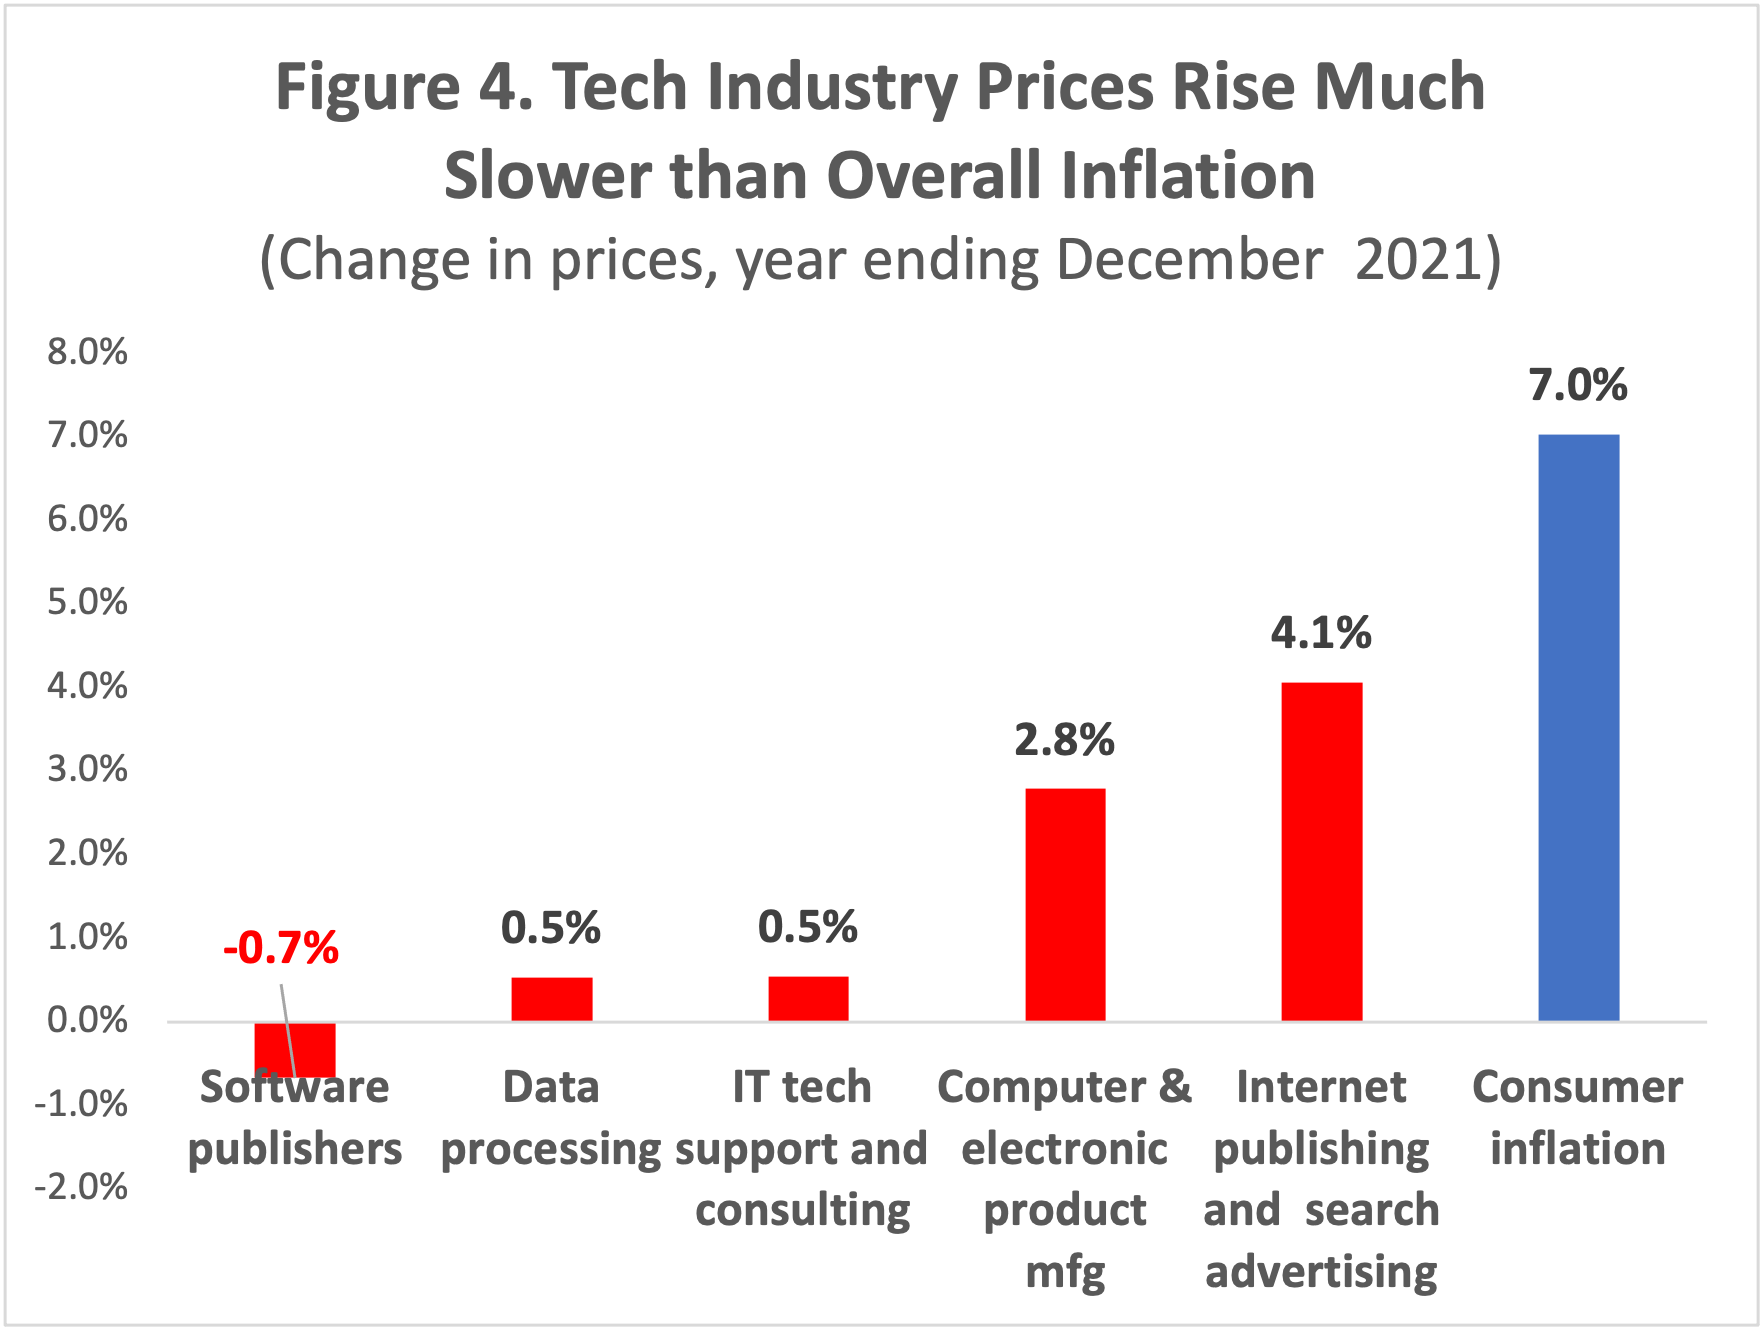
Here we drill down into inflation performance into various components of the tech sector, using data from the BLS Producer Price program.  Figure 4 compares inflation in several tech-related industries with consumer inflation.

According to the BLS, prices for the software publishing industry fell by 0.7% in the year ending December 2021. Prices for data processing and IT support and consulting rose by a measly 0.5%. Computer and electronic product manufacturing prices rose by 2.8%. And the price of internet publishing and search advertising rose 4.1%, considerably slower than the overall consumer inflation rate. That means in real terms the price of internet publishing and search advertising has been getting relatively cheaper.

The App Economy

Finally, we come to the App Economy and the app stores.  Arguably one of the great technological shifts of all time, the introduction of the Apple iPhone in 2007 and then the Apple App Store in 2008 created an entirely new model for delivering services to consumers conveniently and at a low price. It is clear that the App Economy is a profoundly disinflationary force.

The current price statistics do not break out app-relevant price measures, like the price of app downloads or in-app purchases, either from the consumer or app developer perspective. Nevertheless, a careful look at the structure of the pricing structure of the app stores suggests they are contributing to low inflation today.

App store pricing comes in two parts. First, both the Apple App Store and Google Play charge a nominal fee for registering for a developer account. Google Play charges $25 to register, an amount that hasn’t changed in years. Similarly, the Apple App Store charges an annual fee $99 for a basic developer membership, an amount that also hasn’t changed in the U.S. for years (there are a variety of exemptions). As a result, the inflation-adjusted fee has fallen substantially over time.

Most app developers pay no more than this initial fee, or the somewhat higher fee for enterprise developers. As Judge Yvonne Gonzalez Rogers wrote in her September 2021 decision in the court case involving Apple and game developer Epic: “over 80% of all consumer accounts [in the Apple App store] generate virtually no revenue as 80% of all apps on the App Store are free.” These are apps which are free to download, and have no in-app purchases or subscriptions. Many of them, like banking or airline apps, may be quite frequently downloaded and used.  This huge swath of the app stores is disinflationary, with a price that is fixed in dollars over time.

Then there are the small percentage of apps which collect significant consumer revenues on the app stores. Most of these are gaming apps.  For the purposes of assessing their impact on inflation, there are two important factors. One factor is whether the price of the subscription or in-app purchase is rising. The other factor is whether the percentage fee charged by Apple and Google for use of their platform is rising or falling.

We have little visibility into the price evolution of subscription costs and IAP prices. One survey from Sensor Tower suggest that the median price of subscriptions for non-game apps did not change from 2017 to 2020, while the median price of in-app purchases for non-game apps rose by 50%. However, even in the latter case, we have no way of knowing whether consumers are buying the same digital goods or shifting to higher value purchases, which matters for inflation.

We have much better information on the effect on inflation of the fees charged by Apple and Google. The statistical literature makes it clear that if the fee percentages stay the same, they has a neutral impact on inflation. If the fee percentages rise, that is inflationary. If fee percentages fall, that is disinflationary.

In the past year or so, both Google and Apple have voluntarily cut fees for a significant portion of their developer base. Apple, for example, cut the App Store fee from 30% to 15% for all developers who earned less than $1,000,000 in 2019. By one estimate,  that covered 98% of apps with revenue in 2019. Google reduced its fee on subscriptions to 15% (previously it had charged 30% for the first year). These are substantial changes.

With the app store registration or membership fee being held constant in money terms, and revenue-based fee percentages falling, it’s clear that the app stores are contributing to disinflationary pressures.

Conclusion

Both historically and currently, the broad swath of tech, telecom, and ecommerce companies appear to be leaders in the fight against inflation. Data from the government and elsewhere shows no evidence of accelerating price increases in this sector.



Expunging Marijuana Convictions

Public attitudes toward marijuana have changed dramatically since the counterculture days of the 1960s and 1970s when it was regarded as a “gateway” to more serious drug abuse. Today, marijuana (also known as cannabis) is widely seen as relatively benign and is used by many to ease chronic pain. Many states have moved to decriminalize the use and possession of cannabis. Nonetheless, too many Americans, especially from minority and low-income communities, still are burdened with criminal records from marijuana arrests and convictions.

That needs to change. As more states legalize the recreational use of marijuana, they should also expunge past marijuana convictions. Colorado and Washington were the first two states to legalize the Schedule 1 drug for recreational and medical use. Since then, 37 states, the District of Columbia, Puerto Rico, Guam, and the U.S. Virgin Islands have followed suit with laws allowing legal possession and use of marijuana. Taxes on cannabis sales are becoming a lucrative source of revenue for states.

As of 2020, about 40,000 Americans are burdened with marijuana-related convictions. State and federal lawmakers shouldn’t ignore the lingering damage past marijuana policies have inflicted on individuals. According to a report by the ACLU, marijuana-related arrests still account for over half of all drug arrests in the United States. There were over eight million between 2001 and 2010, with Black Americans 3.64 times more likely to be arrested for possession than Whites in every state, including those that have legalized the drug.

Based on the numbers provided by the ACLU, there were around 820,000 arrests annually between 2001 and 2010 and only 6% of those arrests led to a felony conviction for marijuana. The rest are misdemeanor charges which result in fines or probation. Whether or not it leads to prosecution or conviction, the arrest stays on an individual’s record. Having a marijuana arrest on record means the information is available for anyone to look up. Having prior marijuana convictions is a serious obstacle for people seeking jobs, education and training opportunities, and changes in immigration status. Even misdemeanor convictions can make it difficult for people to get driver’s licenses, qualify for insurance policies or apply for bank loans. Felony convictions restrict or limit certain rights such as professional licensing, voting, or receiving government assistance.

Expunging a conviction means that an individual’s case is vacated, dismissed, and “deemed a nullity” in any law or criminal records. When someone’s case is expunged, their past conviction will not appear on any public record and background check. States such as Colorado, Maryland, New Hampshire, and Oregon are allowing automatic expungement and for people to expunge their past marijuana convictions.

Guidelines for expungement differ state-by-state. Illinois legalized the recreational use of marijuana and provided the eligibility status for which individuals can apply for expungement. The act created three groups of marijuana-related records eligible for expungement. The first two groups are eligible for automatic expungement if arrests for possession were under 30 grams or less, while the third group requires a court petition to start the expungement process for possession up to 500 grams. New York’s legislation provides for automatic expungement with additional protection against discrimination in voting, housing, student loans, employment opportunities, and other vital services.

Federal marijuana trafficking cases continued to decline in 2020, according to the U.S. Sentencing Commission. There were only 1,118 such cases reported in 2020, marking a 67% decrease since 2016. The FBI’s Uniform Crime Report in 2020 revealed a decline in the number of marijuana-related arrests with a 36% decrease from 2019; these arrests were primarily made in states where possession remains criminally outlawed.

On the federal level, Rep. Jerry Nadler (D-N.Y.) introduced the MORE (Marijuana Opportunity Reinvestment and Expungement) Act of 2021. The proposal would: (1) remove marijuana from the list of federally controlled substances, (2) reinvest in communities and people based on cannabis arrest/conviction records, and (3) provide for the expungement of federal marijuana convictions and arrests.

In 2021, Senate Majority Leader Chuck Schumer (D-N.Y.) also proposed a draft of the Cannabis Administration & Opportunity Act (CAOA). Measures in the draft include descheduling cannabis and allowing states to continue to set their own cannabis laws. The discussion draft provides guidelines for the expungement of certain cannabis criminal offenses and prohibits federal agencies from denying a security clearance, federal benefits, and immigrant status based on past or present marijuana use.

Expunging marijuana-related convictions is a logical complement to the national drive to legalize cannabis use. The federal government cannot mandate state expungement, but it can set an example and offer federal funding to help states purge old convictions from legal records.

Marshall for The Hill: Biden Faces Down Putin

By Will Marshall

Russian President Vladimir Putin has a Siberia-sized chip on his shoulder. He hasn’t gotten over the unraveling of the once-mighty Soviet Union, which he served as a KGB agent, and he doesn’t think the West pays sufficient attention to Russia’s security interests.

What’s a strongman to do? Threaten war, of course. Putin has amassed over 100,000 troops on the border of Ukraine, which Russia already has invaded once (in 2014) to forcibly annex Crimea.

As Ukrainian forces continue to battle pro-Russia separatists in the country’s Donbas region, a second invasion is a plausible threat. To defuse it, the Biden administration dispatched diplomats to meet their Russian counterparts in Geneva Monday. At Russia’s insistence, neither Ukraine nor European nations were invited to this parley, an omission that reflects Putin’s disdain for Europe and nostalgia for Cold War-style summitry.

Here’s the gun-to-the-head deal Russian diplomats put on the table: Russia won’t invade Ukraine if Washington agrees to halt NATO’s eastward expansion, and dismantle military infrastructure in Eastern European countries that have joined the alliance. They presented draft security treaties obliging NATO to rescind its 2008 offer of membership to Ukraine and Georgia.

Read the full piece in The Hill. 

Why Digital Natives are Puzzled by the Senate’s Anti-Tech Bill

As a member of the first generation to grow up with internet platforms and social media, the push to dismantle America’s leading technology companies feels especially regressive. Among my peers, now entering the workforce, many of us have hardly ordered anything without the option of two-day shipping and never driven anywhere without Google Maps directing us from our smartphones. Technology companies have their faults, but the increasingly dystopian narrative around internet and technology services perpetuated by Senator Klobuchar’s American Innovation and Choice Online Act doesn’t square with how indispensable they’ve become consumers here and around the world.

Here are five reasons legislators should take a careful approach in applying the blunt instrument of antitrust enforcement against America’s most innovative and globally competitive companies:

1. Big U.S. tech firms have created and continue to create millions of new, well-paid jobs for U.S. workers at all skill levels.

As the Progressive Policy Institute has documented, tech-ecommerce companies in recent years have been the biggest source of job growth in the U.S. economy. This proved especially important during the pandemic shutdowns, when Americans turned en masse to the digital ecosystem to work, shop, keep up with their studies and stay in touch with friends and family. Over the past five years, the technology and ecommerce industry created 1.8 million jobs in the United States, more than 40% of total private sector job gains over that period.

Moreover, these jobs pay decent wages and offer good benefits to workers regardless of their skill level. In the warehousing industry, which includes most ecommerce fulfillment centers, the average hourly earnings for production and nonsupervisory workers were $21.39 per hour in November 2021, up 19% over the past year. That’s 30% higher than the comparable figure for general merchandise retailers, and just 5% below the pay in nondurable manufacturing. PPI’s analysis shows that jobs in the tech and ecommerce ecosystem pay 32% more than in the economy as a whole for workers with some college, including an associate degree.

2. As U.S consumers feel the pinch from the highest inflation rates in 40 years, inflation in the digital economy has remained low.

As the old saying goes, “if it ain’t broke, don’t fix it.” The Senate bill is supposed to help consumers, but the digital sector is working as a powerful disinflationary force. Over the past year, prices for digital consumer goods and services—including hardware such as smartphones and computers as well as phone and internet services—have risen by only 1.6% overall, compared to 5.5% for consumer inflation less food and energy. In particular, the price of smartphones has dropped by 14% over the past year, according to figures from the Bureau of Labor Statistics.

3. The innovative services provided by online platforms are highly valued by U.S. consumers.

The Senate bill uses broad generalizations about alleged threats to competition and threatens tech companies with huge penalties without offering clear guidelines for what its authors deem acceptable. This ambiguity could subject tech companies to expensive lawsuits for almost any consumer-friendly innovation. One example: Amazon Prime, which offers free rapid delivery for a yearly subscription, is extremely popular with consumers. Other sellers can share Amazon’s delivery system–built on billions of dollars of investment–by paying a fee and meeting certain requirements. If the bill becomes law, it’s certain that Amazon will be sued on the grounds that Amazon Prime’s benefits to consumers represent an unfair advantage to the company. The result could be the end or significant curtailment of the Prime program. A recent PPI poll found that 72% of voters in political battleground states oppose legislation that would prevent Amazon from selling Amazon Basics products, while 84% oppose legislation that would prevent Amazon from providing Prime shipping services.

4. Because of economies of scale, large online platforms can offer services to small businesses, retailers and developers at relatively low cost.

The Senate bill simply assumes that, where tech is concerned, big is bad. In the real world, the economies of scale offered by platforms make it possible to offer services to small businesses, retailers, and developers at relatively low cost. Take advertising, for example. The price of advertising sold by newspapers has gone down by 7% since 2010. But the price of internet advertising, except for print publishers, has dropped by almost 40% over the same period.

Similarly, small app developers can get wide distribution through Apple’s and Google’s app stores–and certification as being safe for consumers–at a minimal cost. Small businesses can use Gmail and other online services, also at zero or low cost. And small retailers and manufacturers can utilize tools such as Amazon’s Fulfillment by Amazon program to list their products on the platform with the benefit of Prime delivery. Amazon then handles the distribution of these products as well as any returns, providing simple distribution methods for businesses that lack the infrastructure to do so themselves. With more than 200 million consumers subscribed to Amazon’s prime services worldwide, the platform provides an incredible reach for small and medium sized businesses, which the company says make up 60% of their retail sales from 1.9 million individual sellers. If passed, this bill would prevent Amazon from offering these services, harming independent retailers’ ability to reach Amazon’s established customer base.

5. Leading technology companies are vital to America’s economic competitiveness on the global stage.

As the balance of economic power between the United States and China remains in question, hobbling U.S. tech companies’ ability to innovate opens the door for emerging Chinese platforms such as Alibaba and TikTok to entrench themselves in U.S. and overseas markets. The United States is losing ground in technological leadership in key areas. This is particularly troubling when compared to our Chinese counterparts, who have doubled R&D spending as a percent of GDP over the same period. The U.S. is also increasingly reliant on imports of high-tech products, running a trade deficit of $304 billion in 2018.

Assuring American competitiveness in the high-tech sector is a pressing issue for voters. The PPI poll found that 74% of voters in battleground states are worried about the need for the United States to have an innovative tech sector so that Americans won’t have to become reliant on Chinese-developed tech.

The Senate bill couldn’t come at a worse moment. The U.S. economy is starting to rebound strongly from the pandemic recession. Unemployment is failing and wages are rising, though inflation clouds the picture. This simply isn’t the time to break up or severely regulate America’s most dynamic companies.

Trade Fact of the Week: World GDP will top $100 trillion for the first time in 2022

FACT:

World GDP will top $100 trillion for the first time in 2022.


THE NUMBERS: 

$102 trillion     World GDP (currency-basis), 2022
$480 trillion     World individually held wealth, 2022


WHAT THEY MEAN:

How much is “all the money in the world”?  And where is it?

Guessing at the economic outlook last October, the International Monetary Fund projected global growth of 4.9% for 2022. This would be a jump of about $8 trillion from 2021’s $94 trillion in total world GDP, for the first time bringing this total above $100 trillion.  Of this, $60 trillion reflects the output of “advanced economies” — meaning the U.S., Canada, U.K., EU, Norway, Iceland, Switzerland, Japan, Korea, Australia, New Zealand, Taiwan, Hong Kong, and Singapore — with the rest of the world combining for the other $42 trillion. By country, about two-thirds of this represents the output of 12 countries:

COUNTRY     WEALTH OUTPUT
U.S.                 $24.8 trillion
China               $18.5 trillion
Japan                 $5.4 trillion
Germany            $4.6 trillion
U.K.                    $3.4 trillion
India                   $3.3 trillion
France                $3.1 trillion
Canada               $2.2 trillion
Brazil                   $1.8 trillion
Russia                 $1.7 trillion
Australia              $1.7 trillion
Mexico                 $1.6 trillion
All other            $30.3 trillion

Regionally, the IMF projects Latin America’s “GDP” at $5 trillion, the Middle East’s $4 trillion, and sub-Saharan Africa’s $2 trillion; its guess for the fastest-growing areas are developing Asia at 5.8%, the Middle East at 4.1%, and Africa at 3.8%. Overall, the long-term trend has been for “developing” regions to catch up toward traditionally wealthy ones, though much of this reflects the growth of China specifically. This is even more true with the alternative “purchasing power parities” method of estimating GDP, which tries to standardize the value of locally purchased goods and services; it yields a world GDP at $153 trillion for 2022, with China the largest economy at $29 trillion.

Another approach, less complete but suggesting a somewhat different pattern, comes from Credit Suisse’s annual “Global Wealth Report.”  This tries to calculate the value of individually held assets — houses, bank accounts, cars, property, stock holdings, etc. — and sums them all up to $418 trillion worldwide as of the end of 2020.  This total is rising by about 6% or 7% per year, suggesting that in 2022 the “global wealth” of individuals might be $480 trillion. This report doesn’t include a lot of valuable things, though — say, government assets such as buildings, roads and bridges, and national parks, or corporate assets like the value of entertainment industry intellectual property or the commercial airplane fleet, vehicles — and also leaves out the assets of about 2 billion of the world’s poor.  Were such things included, this version of the “all the money in the world” figure might easily be close to $1 quadrillion.

By country and region, this wealth estimate tilts more toward “advanced economies” than the IMF’s GDP projections.  By Credit Suisse’s count, the largest ones (using their 2020 figures rather than trying to extrapolate the 2022 levels) are:

COUNTRY   WEALTH ESTIMATE
U.S.                 $126.3 trillion
China                 $74.9 trillion
Japan                 $26.9 trillion
Germany            $18.3 trillion
France                $15.0 trillion
U.K.                     $15.3 trillion
India                    $12.8 trillion
Canada                $9.9 trillion
Australia               $9.3 trillion
Korea                    $9.0 trillion

Where the IMF’s GDP projections find a narrowing gap between traditionally rich countries and the rest of the world, Credit Suisse’s wealth estimates suggest an at least temporarily widening one.  It notes a worldwide increase in wealth of about 6.0% in 2020.  What with rising home values and stock indexes, the jumps in North America and Europe were 9.1% and 9.8% specifically, meaning that these regions accounted for three-quarters of the world’s wealth growth that year.


FURTHER READING

The IMF’s World Economic Outlook database, released last October; the next update comes in April.

For a quick study on currency-basis vs. PPP-basis GDP, the IMF has an explanation here.

The Credit Suisse Global Wealth Report 2021 can be read here.

More on wealth “per capita”: By Credit Suisse’s measurement, the world’s richest people cluster conveniently around C.S.’ Zurich headquarters. Switzerland tops the world at $679,000 in wealth per person.  The United States ranks second at $505,000, followed by Hong Kong, Australia, and Denmark. (They toss out small tax havens such as Liechtenstein and Luxembourg, as too difficult to estimate.)  On the other hand, Credit Suisse’s figures find the U.S. total warped upward by a relatively few extremely wealthy people.  Using the wealth of the “median” adult rather than the “mean,” America places 23rd in the world with $79,000 per person, and Australia leads the world at $238,000 for the median.  Putting some names to this, a list maintained by Forbes Magazine of the world’s 100 wealthiest people reports that 9 of the top 10 are Americans, together holding $1.6 trillion.

Treasury Secretary Yellen (April 2021) on the Biden administration’s view of the global macroeconomic outlook and next policy steps.

A book recommendation: Diane Coyle’s “GDP: An Affection History” examines the history of the GDP concept, what it tells you, and some of the things it can’t help with.


ABOUT ED

Ed Gresser is Vice President and Director for Trade and Global Markets at PPI.

Ed returns to PPI after working for the think tank from 2001-2011. He most recently served as the Assistant U.S. Trade Representative for Trade Policy and Economics at the Office of the United States Trade Representative (USTR). In this position, he led USTR’s economic research unit from 2015-2021, and chaired the 21-agency Trade Policy Staff Committee.

Ed began his career on Capitol Hill before serving USTR as Policy Advisor to USTR Charlene Barshefsky from 1998 to 2001. He then led PPI’s Trade and Global Markets Project from 2001 to 2011. After PPI, he co-founded and directed the independent think tank ProgressiveEconomy until rejoining USTR in 2015. In 2013, the Washington International Trade Association presented him with its Lighthouse Award, awarded annually to an individual or group for significant contributions to trade policy.

Ed is the author of Freedom from Want: American Liberalism and the Global Economy (2007).  He has published in a variety of journals and newspapers, and his research has been cited by leading academics and international organizations including the WTO, World Bank, and International Monetary Fund. He is a graduate of Stanford University and holds a Master’s Degree in International Affairs from Columbia Universities and a certificate from the Averell Harriman Institute for Advanced Study of the Soviet Union.

Read the full email and sign up for the Trade Fact of the Week


PPI’s Dr. Michael Mandel: Senate’s Antitrust bill will hurt American consumers, middle-class jobs and technological leadership.

Today, the Senate Judiciary Committee announced a markup of an antitrust bill aimed at a handful of America’s most successful technology companies, led by Senator Amy Klobuchar (D-MN). The bill will harm American consumers and American middle-class jobs from coast to coast.

Dr. Michael Mandel, Vice President and Chief Economist of the Progressive Policy Institute, released the following statement:

“It can’t be denied: The anti-tech antitrust legislation led by Senator Klobuchar will hurt American consumers and American middle-class jobs, and impede American technological leadership.

“The digital economy should be a source of pride for Democrats. Digital inflation is low, wage growth in the tech-ecommerce sector is extremely rapid, and digital job creation is strong – especially in pivotal swing states.

“Instead, if this bill is passed, it will undercut the tech and ecommerce industries –  which are vital to our 21st century economy – and give China the edge in leadership and the digital economy. The Senate and House bills are unpopular with voters in the battleground congressional districts, and will likely stunt job growth in these pivotal swing states ahead of the 2022 election.

“Senate Democrats should rethink their push to cater toward the extremes of the party and instead focus on pragmatic, pro-growth legislation that makes the digital economy stronger.”

###

Media Contact: Aaron White – awhite@ppionline.org

Mosaic Economic Project Announces Applications Open for March Women Changing Policy Cohort

The Mosaic Economic Project application process is now open for the March 2022 Women Changing Policy workshop, scheduled for February 28 to March 2, 2022.

“The Women Changing Policy workshop is an opportunity to connect with and learn alongside other diverse experts in fields where women are traditionally underrepresented” said Jasmine Stoughton, Project Lead. “Through our interactive workshop, participants hone the skills necessary to engage with lawmakers and the media.”

This is the fourth Women Changing Policy workshop. Previous workshops have included candid conversations with seasoned media professionals, policy leaders, and representatives from the United States Congress.

Applicants should be well established in their careers and eager to grow their profile in the policy arena. This workshop will be held in person in Washington, D.C., and the deadline to apply is February 11, 2022.

Interested applicants should apply here.

The Mosaic Economic Project is a network of diverse women with expertise in the fields of economics and technology. Their programming aims to bring new voices to the policy arena by connecting cohort members with opportunities to engage with top industry leaders, lawmakers, and the media.

The Progressive Policy Institute (PPI) is a catalyst for policy innovation and political reform based in Washington, D.C. Its mission is to create radically pragmatic ideas for moving America beyond ideological and partisan deadlock. Learn more about PPI by visiting progressivepolicy.org.

Follow the Progressive Policy Institute.

Follow the Mosaic Economic Project.

###

Media Contact: Aaron White – awhite@ppionline.org

The government stepped in to protect health care during the pandemic

In 2020, for the first time, the federal government financed the majority of health care spending in the United States. Though the use of health care services declined during the first year of the pandemic as the country shut down and people avoided unnecessary interactions with doctors and hospitals, health care spending still grew by 9.7% in 2020 over 2019, reaching $4.1 trillion — a record high. That’s because the federal government spent record high amounts on public health, provider relief funds, and a larger social safety net, propping up the health care industry as a whole.

The government stepped in to support the health care industry to help meet the demands of an unprecedented pandemic. Through Operation Warp Speed, bolstering the strategic stockpiles of drugs, funding clinical trials and guarantee purchase orders for vaccines, supporting health facility preparedness, and increased enrollment in public health programs, public health spending increased over two fold from the year prior. Excluding federal public health activity and programs, health care spending only increased 1.9% over 2019.

The federal government provided financial relief to health care providers, which propped up the sector even while people used less care overall. Hospital and doctor spending largely remained constant in 2020 thanks to federal assistance to health care providers through the Provider Relief Fund ($122 billion) and the Paycheck Protection Program ($53 billion). Even while health care utilization was down, hospital expenditures increased 6.4% in 2020, similar to the 6.3% growth rate in 2019. Physician and clinical service expenditures increased 5.4%, more than a percentage point higher than the 4.2% growth in 2019.

Medicaid and the Affordable Care Act (ACA) served as a safety net as many people lost jobs. Though the pandemic led to huge economic and employment downturns, the number of uninsured people declined by 0.6 million, or 1.9%. This was in stark contrast to the great recession when 9.3 million people lost their health insurance tied to employment. This time, safety net programs like Medicaid and subsidies available through the ACA kept people from losing health care coverage during a public health emergency. Medicaid and CHIP enrollment increased to 83.2 million, up nearly 18% since February of 2020. Because many people didn’t use services or lost their private sector coverage, spending on health care by private businesses declined 3.1% in 2020 compared to a 3.8% increase in 2019.

The pandemic’s impact on the overall economy and the health care sector was unprecedented. The GDP contracted by 2.2% (the largest drop since 1938), but because of efforts to support the health care sector, the health spending share of GDP was 19.7%, a two-percentage point increase from 2019 (17.6%).

While there were many failures throughout the pandemic, the government stepped in and mitigated a lot of the damage that could have happened to the health care sector. It supported hospitals as COVID cases surged and demand for other types of health care services waned, it protected people from losing health care coverage, and it partnered with private industry to develop and distribute vaccines at an unprecedented speed. Democrats shouldn’t forget to highlight the successes of these programs as they seek to run on their records in 2022.


MOSAIC MOMENT: Growth, Resiliency and Sustainability in New Orleans

On a new episode of Radically Pragmatic, PPI’s Mosaic Economic Project examines the findings of the 2021 Greater New Orleans Startup Report. The episode explores topics such as the growth, resiliency, and economic sustainability of New Orleans – including the effects of increased remote work options – and dives into solutions to bridge gaps in race and gender equity in critical areas from entrepreneurship to COVID relief.

Hosts Jasmine Stoughton and Crystal Swann were joined by Emily Egan, Director of Strategic Initiatives at the Albert Lepage Center for Entrepreneurship and Innovation at Tulane University, and Ann Marshall Tilton, Community Engagement Manager at the Albert Lepage Center.

Read the 2021 Great New Orleans Startup Report here.

Learn more about the Mosaic Economic Project here.

Learn more about the Progressive Policy Institute here.

Mosaic Moment on PPI’s Radically Pragmatic Podcast: Growth, Resiliency and Sustainability in New Orleans

On a new episode of the Radically Pragmatic podcast, PPI’s Mosaic Economic Project examines the findings of the 2021 Greater New Orleans Startup Report. The episode explores topics such as the growth, resiliency, and economic sustainability of New Orleans – including the effects of increased remote work options – and dives into solutions to bridge gaps in race and gender equity in critical areas from entrepreneurship to COVID relief.

Hosts Jasmine Stoughton and Crystal Swann were joined by Emily Egan, Director of Strategic Initiatives at the Albert Lepage Center for Entrepreneurship and Innovation at Tulane University, and Ann Marshall Tilton, Community Engagement Manager at the Albert Lepage Center.

Listen to the podcast here:


The Mosaic Economic Project is a network of diverse women with expertise in the fields of economics and technology. Mosaic programming aims to bring new voices to the policy arena by connecting cohort members with opportunities to engage with top industry leaders, lawmakers, and the media.

The Progressive Policy Institute (PPI) is a catalyst for policy innovation and political reform based in Washington, D.C. Its mission is to create radically pragmatic ideas for moving America beyond ideological and partisan deadlock. Learn more about PPI by visiting progressivepolicy.org.

Follow the Progressive Policy Institute.

Follow the Mosaic Economic Project.


###

Media Contact: Aaron White – awhite@ppionline.org

PPI Statement on One-Year Anniversary of Jan. 6th Attack on the Capitol

Will Marshall, President of the Progressive Policy Institute, released the following statement on the one-year anniversary of the January 6th insurrection at the United States Capitol:

“One year ago today, a lame duck president incited a mob of followers to storm the Capitol to overturn the 2020 election results. Dozens of police officers were injured in the ensuing violence, which eventually claimed five lives.

“For orchestrating this seditious and deadly attack on our elected representatives, Donald Trump was rightly impeached for a second time. But Congressional Republicans, in violation of their oath to defend the Constitution, failed again to hold Trump accountable for his lawless conduct.

“Their cowardly dereliction of duty opened the door to Trump’s despicable campaign over the past year to undermine public faith in the integrity of U.S. elections and launch what amounts to a coup attempt against our legitimately elected president, Joe Biden. It will fail, but not before eroding confidence at home and abroad in America’s commitment to democracy.

“From Trump, we can expect nothing but self-aggrandizing lies. Looking ahead, the deeper danger comes from the legions of Trump voters who seem willing to swallow his preposterous claims, and the elected Republican ‘leaders’ who lack the courage to stand up to his treacherous fabrications.

“That’s why Americans must never forget what happened on January 6th. The bipartisan House Select Committee’s investigation into the actions of the president and others who organized the insurrection must continue despite Republican stonewalling and disingenuous cries to ‘move on.’

“And what of the 147 Republican lawmakers who voted only moments after the outrage in the Capitol to support Trump’s bogus claims of a stolen election? Let’s make sure U.S. voters won’t forget their names when they go to the polls in this year’s midterm elections.”

###

Media Contact for PPI: Aaron White – awhite@ppionline.org

Trade Fact of the Week: 49 of the world’s 100 tallest buildings have opened in the last 5 years

FACT:

49 of the world’s 100 tallest buildings have opened in the last five years. 


THE NUMBERS: 

World’s tallest buildings*, 2600 BCE to present

YEAR          BUILDING HEIGHT
2010           2,716 feet (Burj Khalifa, UAE)  
2004         
1,666 feet (Taipei 101, Taipei)
1998           1,482 feet (Petronas Towers, Kuala Lumpur)
1974           1,450 feet (Sears Tower, Chicago)
1972           1,368 feet (World Trade Center, New York)
1931            1,250 feet (Empire State Building, New York)
1930           1,046 feet (Chrysler Building, New York)
1913               792 feet (Woolworth Building, New York)
1908              612 feet (Singer Building, New York)
1901               548 feet (City Hall, Philadelphia)
1311                525 feet? (Lincoln Cathedral, UK)
~2550 BCE    481 feet (Great Pyramid, Egypt)


WHAT THEY MEAN:

Stone buildings can’t get much above 500 feet, since the weight of the upper tiers will crack and break the load-bearing pillars and walls beneath.  This is why the 481-foot Great Pyramid outside Cairo held the world’s-tallest-building title for 3,800 years, until topped by a few slightly higher Gothic cathedrals in the 13th century. The cathedrals in turn held their lead until the early 20th century — unless you count free-standing towers like the 555-foot Washington Monument (1884) or 986-foot Eiffel Tower (1889) — when Chicago engineers devised the steel-skeleton frame, using curtain walls held in place by steel girders to add another 750 feet of space, metal, and glass.

Computer-aided design and new alloys — for example, twisting facades to minimize wind torque, and lightweight cladding to resist heat — enabled another jump during the 1990s. The results accelerated in the last decade with a bloom, or rash, of ultra-high skyscrapers at 1500 feet and above, mostly in Asia and the Arabian Peninsula. As 2022 begins, 49 of the world’s 100 tallest buildings, and four of the top ten, have opened since 2017. Only 13 20th century buildings remain among the top 100, and only four opened before 1990.  Eleven-year-old Burj Khalifa in Dubai remains largest of all, more than a half-mile tall at 2,717 feet or 828 meters. By location, the top 100-list maintained by the New York-based Council on Tall Buildings and Urban Habitat breaks down as follows:

  • China: 45 of the top 100 and five of the top 10, including second-place Shanghai Tower (2015) at 2,073 feet and fourth-place Ping An Tower in Shenzhen (2017).  Hong Kong adds five more.
  • United Arab Emirates: 17, with Burj Khalifa’s 2,716 feet basically one old skyscraper’s height above the Shanghai Tower. Saudi Arabia’s competing “Kingdom Tower,” aiming for more than 1,000 meters (3,281 feet), stalled out at 1000 feet in 2018 after a contract dispute.
  • United States: 15, including 7 in New York — One World Trade Center, at 1,776 feet, is the world’s sixth-highest — along with 5 in Chicago, and one each in Philadelphia and Los Angeles.
  • The rest: 18, including five in Russia, four in Malaysia, four in Korea, two in Taiwan, and one each in Vietnam, Kuwait, and Saudi Arabia.

Once unrivalled in the count of very high buildings, the U.S. now ranks third. The American intellectual role in skyscraper design and construction, though, remains central.  Specialized U.S. architecture firms in Chicago, New York, New England, and California remain at the core of worldwide tall building design, having designed seven of the current top ten and 24 of the 49 most recent entries to the list.


Burj Khalifa in the UAE stands at 2,716 feet.


FURTHER READING


New York’s Council on Tall Building and Urban Habitat lists the world’s 100 tallest buildings.

Burj Khalifa features 160 floors, a spiral shape to minimize wind torque on the upper levels, specialized glass and heat-resistant glazed aluminum/stainless steel cladding on the outer walls.

San Francisco-based Gensler designed the 2,073-foot Shanghai Tower, with “sky gardens” on the 37th of its 127 floors. BEA unromantically considers this an export of “architectural services”; in this sense, U.S. exports average about $900 million per year, against $135 million in imports. Read more from Gensler on the Shanghai Tower.

One World Trade Center (2014), at 1,776 feet, ranks sixth worldwide (pictured below).


Is China slowing down? Central government puts a cap on ultra-tall, weird, or “xenocentric” buildings.

A brief survey of three earlier tall-building eras:

1. Pyramids & Ziggurats, Middle East, 2600 BCE to 2000 BCE:  Pyramid-building began with Djoser’s 203-foot Step Pyramid around 2650 BCE and peaked a century later with Khufu’s 481-foot Great Pyramid.  Just outside modern Cairo, this building held the world’s-tallest-building title for 3,800 years, even if nobody was around to measure and compare. Not just a lame pile of rocks, the G.P. is a “smart pyramid” with a complex interior design of chambers, tunnels, and ventilation shafts meant for practical, religious, and perhaps astronomical purposes, all pointing to sophisticated architectural drafting and engineering as well as lots of donkeys and human labor. The slightly younger ziggurats in neighboring Sumer and Akkad were made of brick. The squishier material means they couldn’t be as tall, and topped out at about 170 feet, with small temples on top.

Egypt’s Great Pyramid homepage can be found here.

The Ziggurat of Ur is solid brick all the way through, with a (long-vanished) moon goddess temple on top, built around 2100 BCE per order of Sumerian King Ur-Nammu.  Read more from Iraq Heritage.

Book recommendation: The Babylon ziggurat “Etemanki” supposedly had “hanging gardens”, like the Shanghai Tower but open-air. Herodotus describes the ziggurat — eight tiers also with a temple on top — but doesn’t mention any gardens.  British Assyriologist Stephanie Dalley investigates, and concludes that they probably existed but were somewhere else.

2. Gothic Cathedrals, Europe, 1200 to 1400: “It was as though the world had shaken herself and cast off her old age, and clothed herself everywhere in a white garment of churches…”  Large buildings with enormous glass windows, hundred-foot stone pillars, and flying buttresses to relieve stress on load-bearing walls.  Designed without printing presses, standardized weights and measures, or mathematics beyond flat-plane geometry, cathedrals overtook pyramids in the 14th century and with the exception of Philadelphia’s 548-foot City Hall (1901) remain the world’s tallest stone-on-stone buildings. Lincoln Cathedral, completed in 1311, is said to been the highest Gothic cathedral, with a central spire rising to 525 feet. But the spire fell down in 1549 so we can’t be sure. The largest one still standing is Germany’s 512-foot Ulm Cathedral.

Read about the Ulm Cathedral.

Read about Abbot Sugar and the 12th-century Gothic boom.

3. Skyscrapers, United States, 1908 to 1974: Steel-skeleton buildings surpassed cathedrals with the completion of the Singer Building (referring to the sewing machine company, not the arts) in New York City in 1908. The Otis hydraulic elevator system made sure people could get to the top floors, and architects devoted occasional floors to water tanks and pumps so penthouse suites and executive offices could get toilets that flush and faucets that spout water rather than sucking air. Woolworth quickly overtopped Singer, Chrysler hit 1,000 feet in 1930, then the Empire State Building in 1931.

Read more about the Empire State Building.

Chicago’s William LeBaron Jenney, a Union army engineering corps vet, and Paris-trained architect, designed the first girders-and-curtain wall “skyscraper” — the 180-foot Home Insurance Building on South LaSalle, demolished to make way for the Field Building in 1931.


ABOUT ED

Ed Gresser is Vice President and Director for Trade and Global Markets at PPI.

Ed returns to PPI after working for the think tank from 2001-2011. He most recently served as the Assistant U.S. Trade Representative for Trade Policy and Economics at the Office of the United States Trade Representative (USTR). In this position, he led USTR’s economic research unit from 2015-2021, and chaired the 21-agency Trade Policy Staff Committee.

Ed began his career on Capitol Hill before serving USTR as Policy Advisor to USTR Charlene Barshefsky from 1998 to 2001. He then led PPI’s Trade and Global Markets Project from 2001 to 2011. After PPI, he co-founded and directed the independent think tank ProgressiveEconomy until rejoining USTR in 2015. In 2013, the Washington International Trade Association presented him with its Lighthouse Award, awarded annually to an individual or group for significant contributions to trade policy.

Ed is the author of Freedom from Want: American Liberalism and the Global Economy (2007).  He has published in a variety of journals and newspapers, and his research has been cited by leading academics and international organizations including the WTO, World Bank, and International Monetary Fund. He is a graduate of Stanford University and holds a Master’s Degree in International Affairs from Columbia Universities and a certificate from the Averell Harriman Institute for Advanced Study of the Soviet Union.

Read the full email and sign up for the Trade Fact of the Week