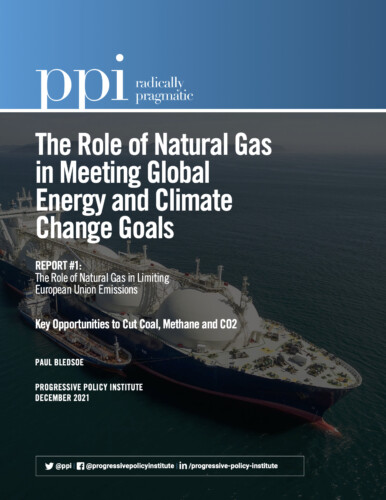
The Role of Natural Gas in Meeting Global Energy and Climate Change Goals

EXECUTIVE SUMMARY

The European Union in recent actions and the United States under President Joe Biden have both offered bold visions for deeply reducing greenhouse gas emissions and asserting leadership in the global fight against climate change. Each is taking important steps to reduce harmful emissions from natural gas, including more aggressive methane controls, emissions reporting, and investments in carbon capture and storage technology.

These initiatives hold great promise in helping Europe lessen its dependence on coal and other dirtier fuel types, as well as ensure that gas imported into the EU is as clean as possible to help Europe meet its climate goals.

For example, on July 14, 2021, the European Union announced sweeping new climate change goals in its “Fit for 55” directive. The extraordinarily ambitious program requires the EU to reduce its greenhouse emissions by 55% below 1990 levels by 2030, relying on the EU carbon trading and pricing market, new Green Deal programs, a wide range of clean energy subsidies, and the beginning of some fossil fuel use restrictions. Most climate experts see the EU proposal as the first-ever attempt by one of the world’s three major centers of economic growth and innovation to reduce emissions in keeping with the key Paris agreement goal of reaching net zero emissions globally by 2050 and keeping temperatures from rising more than 1.5 Celsius.

However, today, the EU still gets at least 15% of its electricity from coal, with far higher percentages in Germany, Poland, and other eastern European countries.  Analysis by the International Energy Agency and other leading experts predicts that the EU will use a mix of renewable energy and natural gas to displace coal. Indeed, most studies find that gas use in the EU will grow over the next decade to balance increased intermittent renewable energy on the EU electrical grid as other forms of baseload power (coal and much nuclear power) are phased out.

Yet even as the European Union undertakes these unprecedented steps to reduce emissions, it is increasing its reliance on natural gas from Russia’s notoriously leaking, antiquated, and nontransparent gas production and transport system, which has extremely high fugitive emissions of methane, a super-potent greenhouse gas. The EU imports about 40% of its total natural gas from Russia — despite data showing that Russian gas is worse from a climate change perspective than the very coal natural gas is meant to displace. Indeed, new data from the International Energy Agency (IEA) shows that Russia is the world’s largest methane emitter, with massive new “super-emitting” methane plumes detected this year, even as studies how Russia has consistently lied about and covered up its emissions for decades.

The EU’s importation of high methane emitting Russian gas is a profound flaw in the EU’s climate plans which may prevent it from truly reaching its 2030 emissions goals. While huge methane emissions from Russian gas imports may not be technically counted under the EU’s greenhouse gas accountancy system, they are nonetheless causing massive greenhouse gas emissions of methane (84 times more potent than CO2) at precisely the time leading experts say cutting methane emissions is the key to keeping temperatures below the Paris targets of 1.5°C and 2°C.

Indeed, in mid-September 2021, the EU recognized the urgent need to cut emissions of methane in an agreement with the United States, the United Kingdom, and other nations to reduce overall methane emissions from all sources within their borders by 30% before 2030. Such admirable efforts to reduce methane, however, will be swamped and rendered ineffectual by global methane emissions from Russian gas and other sources of the EU’s gas imports which are outside of this agreement.

In recent months, in fact reducing methane emissions has become a centerpiece of climate protection, as evidenced by the EU, U.S. and over 100 other nations signing a pledge at the recent UN climate negotiations in Glasgow, Scotland, to cut methane by 30% by 2030. However, Russia, Iran, Qatar and other major gas exporters and methane emitters have not signed the pledge.

This report finds that the EU has an array of new options to reduce near-term dependence on Russian gas. These include greater renewable energy use, electricity storage technologies, and imports of lower-emitting U.S. liquefied natural gas. Current high natural gas prices are roiling European markets and consumers, spotlighting the increasing need for larger liquefied natural gas shipments from the US and other sources, both this winter and for years to come. In fact, specific methane reducing actions by the EU and U.S. can play the key role in forcing all global gas imports to lower their emissions dramatically by creating demand competition for low-emitting gas.

The most important imperative is for the lifecycle of methane emissions from natural gas production to be driven down as close to zero as possible by both major exporters and importers. In the United States, President Joe Biden and Congress are acting to both impose stringent regulations on methane emissions and take new steps to sharply reduce fugitive emissions and the venting of gas from existing and old unused wells. Such efforts are crucial to limiting near- term temperatures globally as a series of studies have concluded, especially the August 2021 urgent report by the United Nations International Panel on Climate Change.

Moreover, as the IEA noted in its “methane tracker” report released in January 2021, it is in the “strong interest” of natural gas companies to cut methane emissions, since, over time, users will demand, and nations will require, the lower- emitting methane gas sources. “Aside from the environmental gains, oil and gas operations with lower emissions intensities are increasingly likely to enjoy a commercial advantage,” the report said.

Nonetheless, government action to limit methane globally is critical. This should include requirements by the EU, the world’s largest natural gas importer, that methane emissions from both domestic and imported gas be accurately verified and monitored, and then regulated to as close to zero as possible. Such a “global race to near-zero fugitive methane emissions” among natural gas competitors would dramatically cut global emissions, even as gas displaces remaining coal in Europe, Asia, and elsewhere. In this way, super-low-methane gas exports (and also low-CO2 gas with carbon capture and storage) can play a major role in reducing greenhouse gas global emissions even as renewable energy grows.

The IEA and other top analysts believe that the EU will have to use natural gas to displace remaining coal use and balance the EU grid, with gas over the next two decades providing baseload electric power as intermittent renewable energy becomes a higher percentage of the EU’s power supply and as the demand for electricity increases due to electrification of transportation and broader growth. Methane from oil and gas is Europe’s third largest source of greenhouse gas emissions. Thus, reducing methane emissions from all EU natural gas sources, including imports, is essential to meet the European goal of cutting emissions 55% compared to 1990 levels by 2030.

The EU imports more than 60% of its gas, and total methane emissions from gas-exporting countries like Russia are at least three and eight times the emissions from the domestic EU gas supply chain. If these “imported methane emissions” are calculated by the European Union as it determines its overall emissions profile, they will swamp progress made on other fronts and prevent true reduction of its total emissions. The EU also imports more than 40% of its total natural gas from Russia. Yet data consistently shows that Russian gas is even worse than coal in contributing to greenhouse gas emissions. Russia has deliberately prevented attempts to fully assess its high methane emissions for decades, choosing instead to point the finger at other gas producers and use the echo chamber of its influence operations in Europe to attempt to discredit attempts to hold Moscow to account.

The EU Commission has committed to reducing methane emissions in its domestic energy sector and engaging in a dialogue with its international partners about what carrots and sticks could be used to lower the methane profile of imported gas. But it has not yet promulgated standards to accomplish these goals.

Fortunately, new and more accurate methane detection technologies are increasingly being deployed. They should become standard in the world’s major natural gas producing nations. Nations that refuse to have their gas monitored and verified should be denied import status by the EU and other major importers over time.

New sources of gas, including liquefied natural gas (LNG) imports from the United States and other clean sources, can reduce the EU’s reliance on methane-heavy Russian gas. But of course, that will require the United States and other exporters to drive down methane and carbon dioxide emissions from the lifecycle as close to zero as possible, and verify their reductions with credible methodologies.

Moreover, the geopolitical costs of Russian gas continue to plague the EU broadly, and Ukraine and other Eastern European nations specifically. EU imports of Russian gas have actually increased since Moscow’s illegal annexation of the Crimea in 2015. Over time, limiting Russian gas imports thus could diminish its political leverage over Europe while also helping the EU achieve its climate goals.

Given these realities, European support for the Nord Stream 2 pipeline from Russia to Germany is a massive strategic mistake. Making the pipeline operational would clearly increase Russia’s leverage over Ukraine and other Eastern European countries. In addition, allowing Russia to operationalize the pipeline will dramatically reduce the EU’s leverage to compel the state- owned Russian monopoly Gazprom to reduce its methane emissions.

The United States has long had better methane and carbon dioxide reporting standards and measurements than other gas exporters, leading the world in both methane science and efforts to reduce methane emissions. More importantly, the Biden Administration, Congress, and the U.S. natural gas industry are beginning to undertake a series of strategic steps to make U.S. gas super- low emitting compared to gas from Russia and other major exporters. This would give U.S. gas a competitive advantage in world markets, boost U.S. LNG sales abroad, and enable European gas importers to make deeper cuts in greenhouse gas emissions as they transition away from burning coal.


Summary of Key Recommendations:

• The EU should put in place rigorous monitoring, reporting and verification rules covering all natural gas, both domestically produced and imported.
• Over the next few years, the EU should require gas exporters to accurately verify
lifecycle emissions of methane as a condition for gaining access to the EU market.
• The EU and United States should harmonize their monitoring, reporting, and verification(MRV) regimes of lifecycle emissions from natural gas as a key interim step in this process. This step is crucial in setting a global benchmark for MRV emissions from gas, given the much greater transparency and accuracy of emissions measurements from natural gas produced in the EU and U.S.compared to other gas exporters to the EU.
• The EU should consider adopting stringent methane emissions regulations for domestically produced natural gas immediately, and then extend these requirements to imported gas at the earliest opportunity.
• The EU should seek to diversify and expand its natural gas importation sources both to reduce gas prices to phase out coal and to pressure importers of all types to begin to cut its lifecycle methane and carbon emissions.
• The United States should accelerate its already significant measures to drive down U.S. methane emissions from natural gas production and transportation. In the near-term, the U.S. should aim at making its gas super-low emitting, with fugitive emissions of less than 0.5% of total volume, by far the lowest emitting in the world. In time, U.S. gas should be even lower-emitting, with close to zero methane emissions, and dramatically increase the deployment of carbon capture and storage technologies for CO2 emissions from gas.
• The EU should measure precisely the extent to which Russian gas with high fugitive methane emissions is undermining progress toward both EU and global climate change goals. Specifically, Brussels should study potential emissions from gas transported through the Nord Stream 2 pipeline before allowing the pipeline to become operational.
• Over time, the EU should require all natural gas used in the EU achieve super-low methane and CO2 emissions, as gas will be needed to displace coal in the EU to meet climate goals. Such EU actions during the current decade can help not only meet its own greenhouse gas emissions goals for 2030, but begin the process of bringing natural gas emissions to the lowest possible levels around the world and using it to displace global coal use.
• Increasing low-emitting U.S. liquefied natural gas imports to the EU can play a key role in. this process, and should be a domestic and
international climate change policy priority for both the EU and U.S.
• The EU should prioritize LNG port construction, access, and related infrastructure to spur a competition toward super-low emitting gas, and to displace Russian gas.
• The EU can advance its own energy and security interests, as well as its climate goals, by acting on its stated policy of reducing its
dependence on Russia gas, cutting imports by at least half during the current decade.


Download and read the full report:


Gresser for NYDN: Clogged ports, empty truck cabs: Good problems to have

By Ed Gresser


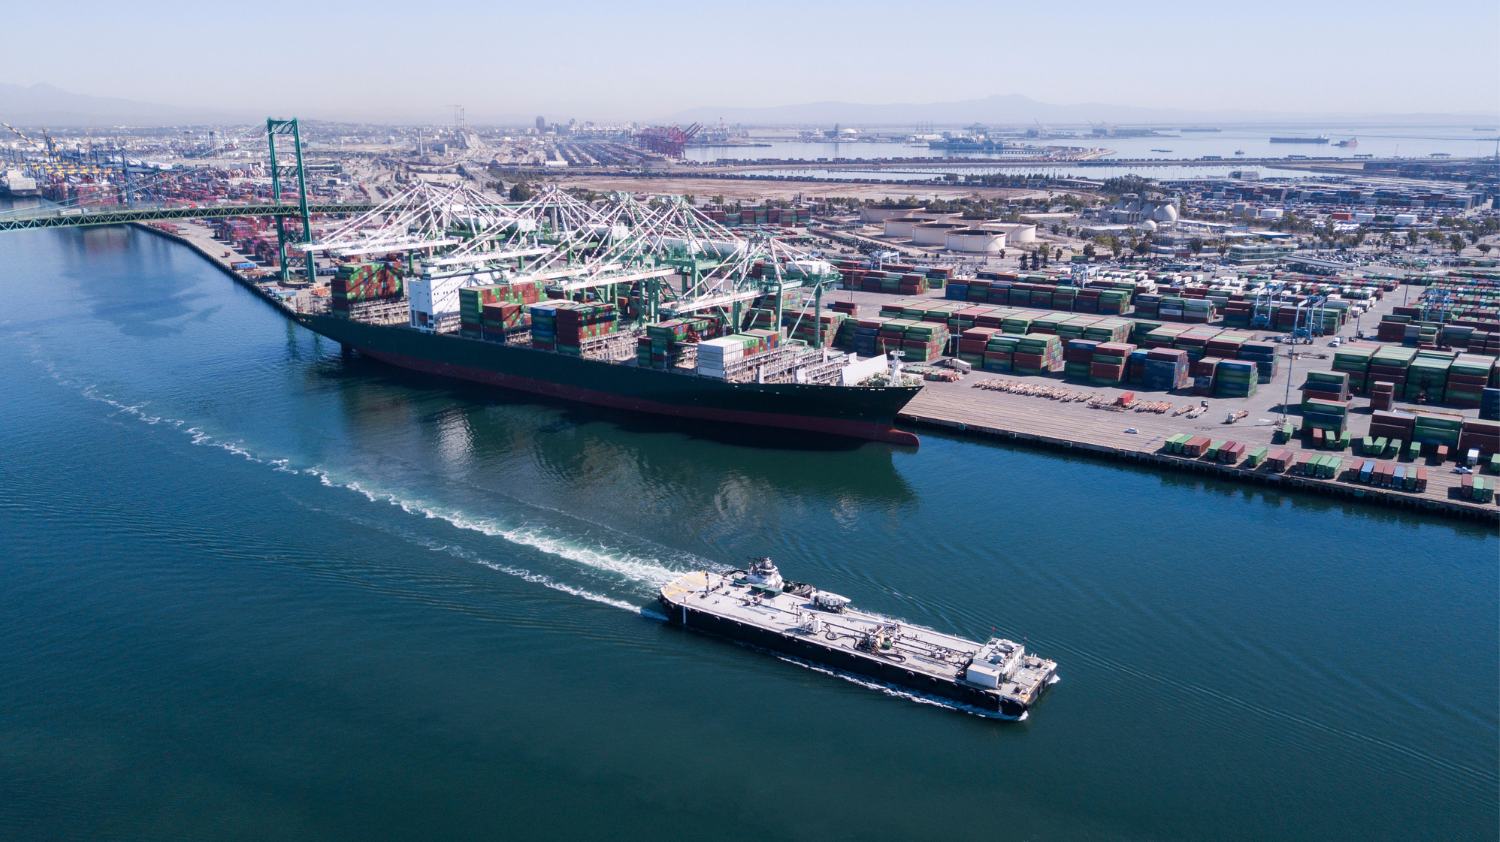
Looking out at the Pacific this year, worried farmers see giant cargo ships turning around empty, leaving their wine, butter and almond cargoes on the docks and at least $1.5 billion in exports lost. Meanwhile, 80-ship pileups off the coast of Southern California mean weeks or even months of delays unloading industrial inputs and consumer goods; and with truckers and warehouse workers quitting their jobs at record rates, full containers are piling up in fields and parking lots.

The port problems are complicated and serious enough to worry even President Biden, who has given speeches and put out policies to head off complaints about everything from empty shelves during Christmas shopping weeks to lost farm exports and inflationary bottlenecks.

But they’re also the sort of problems administrations are happy to have. This is because they’re evidence of confident consumers, workers finding new opportunities, and a successful effort, at least so far, by the Biden administration’s work to create a strong economy that grows from the middle out.


Read the full piece in New York Daily News.

How Better Statistics Lead To Better Policy In A Changing World

Today, the Innovation Frontier Project (IFP), a project of the Progressive Policy Institute, hosted a virtual conference for policymakers, staffers and journalists titled “How Better Statistics Lead to Better Policy in a Changing World.” The Innovation Frontier Project assembled a panel of leading experts who addressed the need for new statistics in the key areas of the digital economy; healthcare; and supply chains. They showed how a relatively small investment in improving our data can avoid huge policy mistakes.

Watch the event here.

###

Marshall for The Hill: To empower parents, reinvent schools

By Will Marshall

Buoyed by recent gains in Virginia and New Jersey, Republicans see an opportunity to win back suburban voters by stoking public anger at what’s happening in their public schools. A Fox News headline says it all: “Parents across US revolt against school boards on masks, critical race theory and gender issues.

While Fox’s claim is typically hyperbolic, the issue of parental control over kids’ education did loom large in Republican Glenn Youngkin’s victory over Terry McAuliffe in Virginia’s gubernatorial contest. Since GOP strategists view it as the template for next year’s midterm elections, K-12 schools seemed destined to become the new central front in the nation’s culture wars.

Around the country, riled-up parents are storming normally soporific school board meetings and targeting members for online abuse and threats. In Washington, Republicans have cobbled together a “parental bill of rights” to campaign on next year. Teacher unions and their political allies call for a counter-mobilization to win school board races around the country.

Read the full piece in The Hill.


What’s the real price of insulin?

The high price of insulin for diabetes sufferers has been one of the biggest flashpoints of the drug pricing debate for years. Clearly too many patients struggle with paying for this essential medicine. At the same time, manufacturers claim that the price that they have been receiving for insulin products has been falling.

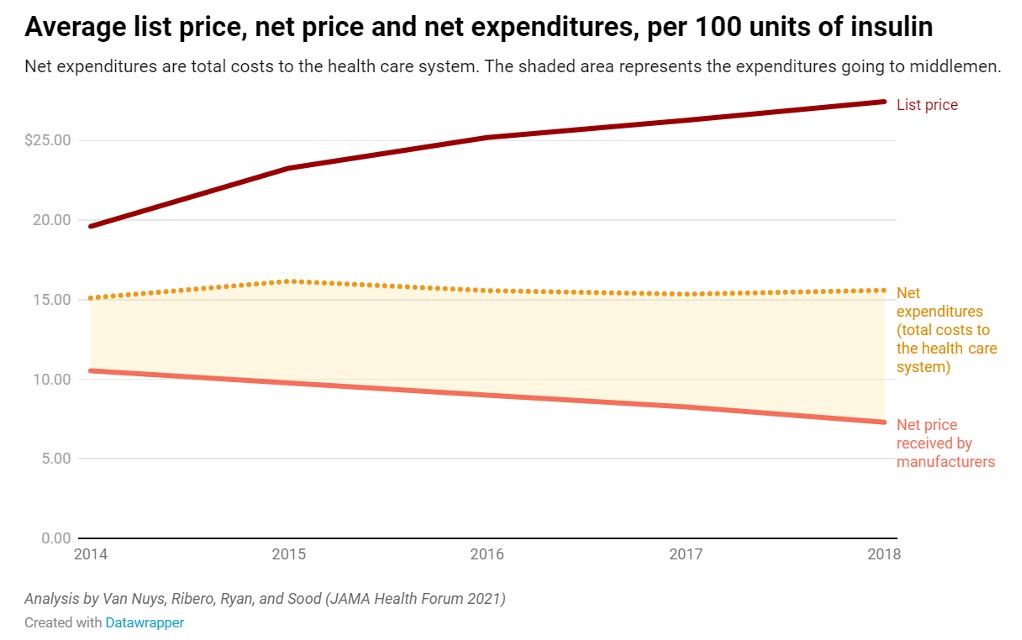
A new study from the USC Schaeffer Center for Health Policy & Economics helps resolve this paradox. The researchers found that middlemen in the distribution process — wholesalers, pharmacies, pharmacy benefit managers (PBMs) and health plans “take home more than half — about 53% — of the net proceeds from the sale of insulin, up from 30% in 2014. Meanwhile the share going to manufacturers has decreased by a third.”

The chart below from the USC report tells the story.

The top line is the list price of insulin, which rose from 2014 to 2018. The bottom line is the net price to manufacturers, which fell over the same period.  The middle line is net expenditures to the health care system, which is more or less flat.

This study is completely consistent with anecdotal evidence, suggesting that there’s a growing gap between the list price of insulin and the net proceeds going to manufacturers.

The researchers had to use 15 different data sources to put together their results. They report that:

…Of a hypothetical $100 spent on insulin, they find manufacturers accrued about $70 in 2014, falling to $47 in 2018. During this time, the share going to pharmacies increased from about $6 to $20, pharmacy benefit managers’ share increased from $6 to $14, and the share going to wholesalers increased from $5 to $8. Health plans saw their share decrease from $14 to $10 per $100 spent on insulin.

A single study is not conclusive, of course.  But it does suggest that the insulin price problem has as much or more to do with the reimbursement and distribution system as it does with the prices charged by manufacturers. It also raises the need for the government to collect better price statistics that account for discounts and rebates.


RAS REPORTS: The State of Education in America

On the first episode of RAS Reports, Co-Director of PPI’s Reinventing America’s Schools Project Curtis Valentine sits down with RAS Advisory Board Member and Fort Worth, Texas School Board Leader Cinto Ramos to explore the importance of school boards among students, parents, and local leaders. What challenges do school boards face post-COVID? And what opportunities are created from having to reinvent the wheel?

In addition, Curtis and Cinto dive into Texas SB 1882, as well as the 2021 Virginia Gubernatorial election that helped catapult school board leaders and the education debate into the national spotlight.

Learn more about the Reinventing America’s Schools Project here.

Learn more the Progressive Policy Institute here.

New PPI Report Calls for Policymakers to Make College More Affordable and Accessible by Supporting Price Transparency and Credit Transfers

The Progressive Policy Institute (PPI) released a new report today outlining several root causes of the lack of affordable and accessible higher education in America. Report authors Paul Weinstein Jr. and Veronica Goodman propose increasing price transparency and ensuring prospective students get the credit they’ve earned before beginning their degree.

“Far too often, proposals to address the skyrocketing financial costs facing college bound students involve subsidizing an already broken system with more taxpayer dollars,” said Paul Weinstein, Jr., Senior Fellow at the Progressive Policy Institute. “PPI’s recommendations for policymakers constitute an actionable, pragmatic roadmap for substantive change that will give more students opportunities to succeed without bankrupting their financial future”.

The skyrocketing cost of higher education affects young people across the country, with more than one in five U.S. households holding a student loan and the increased costs of college outpacing inflation nearly fivefold since 1983. Policymakers’ increased focus on proposals to expand financial aid and loans – or cancel them entirely – neglects the reality that these remedies would not prevent the problem from repeating itself year after year.

The report proposes the following reforms to expand access to higher education and increase affordability:

The White House should push for legislation that gives the Department of Education greater authority to establish policies for Advanced Placement (AP), International Baccalaureate (IB), and dual enrollment course credit and ensure that these credits transfer automatically.

Colleges should be required to disclose before a student matriculates the number of credits, including through AP, IB, or from community college coursework, that will be accepted.

The Department of Education should require that colleges provide easy access to information on transfer credits.

States should set clear standards for minimum test scores on AP tests and GPA-level coursework required to earn college credits.

Read the report here:

The Progressive Policy Institute (PPI) is a catalyst for policy innovation and political reform based in Washington, D.C. Its mission is to create radically pragmatic ideas for moving America beyond ideological and partisan deadlock. Learn more about PPI by visiting progressivepolicy.org.

###

Media Contact for PPI: Aaron White – awhite@ppionline.org

Hidden Prices and Higher Tuition: The Case for Transparency in Higher Education Pricing and Advanced Credit

INTRODUCTION

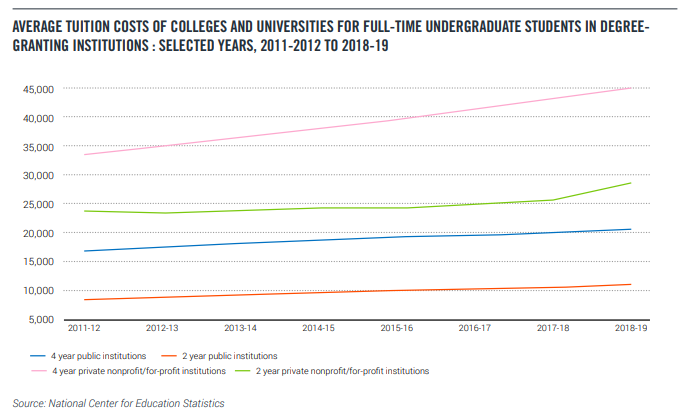
Over the last 30 years, college tuition has skyrocketed. From 1988 to 2018, tuition at public four-year institutions (in real terms) rose 213%. The numbers for private tuition are also stark, with a jump from 1988 to 2018. Students at public four-year institutions paid an average of $3,190 in tuition for the 1987-1988 school year, with prices adjusted to reflect 2017 dollars. Thirty years later, that average has risen to $9,970 for the 2017-2018 school year.

The price jump at private schools has also been significant. In 1988, the average tuition for a private nonprofit four-year institution was $15,160, in 2017 dollars. For the 2017-2018 school year, it’s $34,740, a 129% upsurge.

In response to the exponential surge in the cost of higher education, policymakers have focused increasingly on proposals to expand financial aid and loans, and canceling the vast sums of debt that college students have accumulated. Calls for canceling student debt are understandably popular with those burdened with those loans. But student loan forgiveness is a one-off gift to one generation of borrowers, that does nothing to prevent the problem from repeating itself year after year.

The first step to make college more affordable and expand access to more Americans is to increase price transparency about the true cost of college, and ensure prospective students get credit for college-level work they have completed before starting their degree.

Presently, students lack the information they need to make smart choices about if and where they should go to college. Colleges and universities are not transparent about the true cost of tuition and fees and are opaque about how much credit (if any) students can earn before enrolling (which in turn can reduce the cost). As a result, too many students aren’t getting the college credit they have earned and are being forced to pay and borrow more than they should.

As the pandemic abates, higher education institutions must commit to holding down the cost of tuition and helping students reduce the amount they have to borrow. For example, colleges should guarantee up to two semesters worth of credit for successful completion of Advanced Placement (AP), International Baccalaureate (IB), and college courses taken in high school. They should also make the transfer of credits from community colleges more seamless.

This paper offers a series of pragmatic steps policymakers could take immediately to curb college costs and borrowing. The federal government should use the leverage of billions in financial support for higher education to increase transparency around tuition price, credit transfers, and acceptances so that students can make more informed decisions around college costs:

1.) The White House should push for legislation that gives the Department of Education greater authority to establish policies for AP, IB, and dual enrollment course credit and ensure that these credits transfer automatically.

2.) Colleges should be required to disclose before a student matriculates the number of credits, including through AP, IB, or from community college coursework, that will be accepted.

3.) The Department of Education should require that colleges provide easy access to information on transfer credits.

4.) States should set clear standards for minimum tests scores on AP tests and GPA-level coursework required to earn college credits.

BACKGROUND

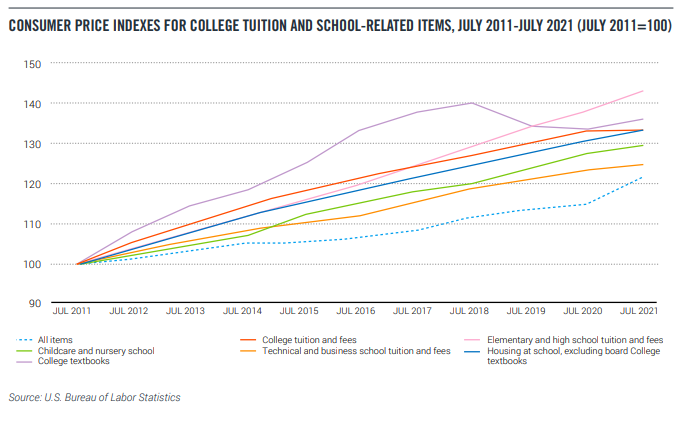
The skyrocketing cost of higher education has become a millstone around the necks of young Americans. More than one in five U.S. households hold a student loan, up from one in 10 in 1989.1 According to the Bureau of Labor Statistics, the cost of college has increased by nearly five times the rate of inflation since 1983.2

These increases depend on the type of institution a student attends, and tuition hikes have been most pronounced among four-year private universities.3 Overall, researchers point to state disinvestment in colleges and rising administrative costs as key drivers of higher education costs.

The education debt crisis has disproportionately affected millennials4, who are already saddled with lower wages and lingering economic pains from the Great Recession. Of young adults aged 25 to 34, or the bulk of millennials, approximately one-third hold a student loan.5 Collectively, as of 2019, 15.1 million millennial borrowers hold $497.6 billion in outstanding loans.6 Economists have pointed to this massive debt burden as a key reason why millennials are not buying houses, starting small businesses, or saving for retirement in the same way as past generations, and it is to the overall detriment of the economy.7


Those who have borrowed for degrees are more likely to be lower-income, Black, and less likely to have family wealth to fall back on. Thus, they are more likely to default, exacerbating poverty and the racial wealth gap. According to the U.S. Department of Education, 20% of borrowers are in default, and a million more go into default each year. Two-thirds of borrowers who default never completed their college degrees or earned only a certificate and owe a comparatively low average amount of $9,625.8 Those who default include veterans, parents, and first-generation college students.9 This “debt with no degree” syndrome leaves borrowers in the hole without access to the earning power associated with a postsecondary degree.

Pell Grant recipients from lower-income households represent an exceptionally high percentage of defaulted borrowers. For example, close to 90% of defaulters received a Pell Grant at one point.10 Of this group, even those who earned a bachelor’s degree are three times more likely to default than students from families that don’t qualify for a Pell Grant.11

For young people who borrow heavily and get in over their heads, default often has catastrophic implications for future access to credit. Many have their wages garnished and tax records seized, starting adulthood and careers on the wrong foot.12

DIMINISHING CREDIT FOR COLLEGE LEVEL COURSEWORK COMPLETED IN HIGH SCHOOL

More high school students are graduating with college-level coursework that could help alleviate some of these costs. High schools with AP and IB programs, as well as Early College high schools,13 give students a head start on advance credits. But many colleges are not transparent about which of these credits will transfer once students matriculate.

According to data from the National Center for Education Statistics, nearly 71% of community college students intend to, at some point, pursue a baccalaureate degree.14

Adding to their data, studies from the Center reveal that approximately 20-50% of new university students are actually transfer students from community college. As students move between institutions, they find it very difficult to navigate the system of credit transfers and agreements.

In fact, colleges have made it increasingly difficult to receive course credit for AP, IB, and work completed at community colleges.15 Some schools (Dartmouth, Brown, and Williams, to name a few) have stopped granting course credit entirely for AP. Furthermore, only 20 states have statewide policies for AP course credit, and more often than not, those that do have statewide policies do not have a minimum score guaranteeing credit transfer.

Why are schools restricting the use of AP? Many claim AP courses are not an actual substitute for college courses. Yet most of these schools that restrict credit are willing to grant those same students’ waivers out of many college courses, which underscores that AP courses are perfectly acceptable substitutes for college courses. A more likely reason is revenue, as more and more schools have become dependent on tuition in order to keep operating.


HIGHER EDUCATION’S TRANSPARENCY PROBLEM

To say that higher education has a transparency problem is an understatement. No industry, with the possible exception of health care, makes it more difficult to compare costs and lock-in an actual price.

Many have long recognized this problem, but efforts to get schools to provide basic pricing information has lagged. For example, work conducted by researchers at the University of Pennsylvania noted that some colleges do not comply with federal rules requiring net-price calculators, while others offer “misleading,” “incomplete,” or dated information about price.16

Another problem is inconsistent financial aid offers — sometimes loaded with obscure and overly complex language, or sometimes omitting the cost of attendance altogether, according to New America and uAspire’s report, Decoding the Cost of College.17

Students looking for information on credits for Advanced Placement work or courses completed at community colleges often have to wait until they arrive on campus. Most schools have made it increasingly difficult to figure out how much AP credit will be awarded, with many leaving that decision to university and college departments. And more and more schools are offering only waivers or exemptions, instead of actual course credit that can reduce the cost of tuition.

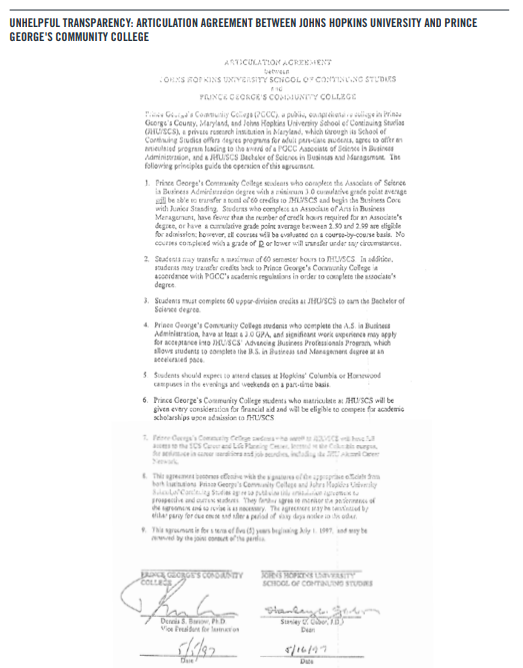
What information schools do provide is often vague and confusing. As the reprint below of an agreement between Johns Hopkins and Prince George’s Community College on course transfers highlights, many school websites provide no more than a low-quality copy of legal language that raises more questions than it answers.

The federal government has attempted to address some of these issues, but most of these reforms have proven ineffective because neither party is willing to use the billions in federal support for higher education as leverage.19

MAKING FEDERAL AID CONTINGENT ON PRICING AND ADVANCED CREDIT TRANSPARENCY

During his campaign, President-elect Joe Biden proposed creating a more seamless process for earning credit for college-level work completed prior to enrolling as an undergraduate (dual enrollment). The Biden administration should fast track this effort in two steps.

First, President Biden should direct the Department of Education to create a federal website where prospective undergraduates could access simple and clear information on the AP, IB, and dual enrollment policies of undergraduate institutions. Trying to find whether your AP test score or that community college class you took will earn you credit at a particular college is like looking for a needle in a haystack. Schools often bury this information on their website, or even worse, don’t provide it all. This lack of transparency can often deter prospective students from even trying to get credit for work that should qualify.

Second, the Biden administration should require schools that receive federal aid to provide admitted students with a detailed spreadsheet of how much credit they will or won’t receive from AP, IB, and dual enrollments prior to their matriculation. No student should have to wait until they arrive on campus to learn how many courses they need to take (and how much money they will have to spend) to graduate.

Accessing early college coursework opportunities can make high school more relevant, increase college-going, make higher education more affordable, and provide a financial lifeline to eligible colleges struggling with depressed enrollments. College-level coursework through AP, IB, and dual enrollment can be motivating to disadvantaged students. It facilitates completing a degree faster and at lower total cost to students and their families.

Of course, neither of these policies would reverse the impact of those colleges and universities that have made it increasingly difficult to get actual course credit for AP, IB, and work completed at community colleges. To truly bring down the cost of tuition and the debt burden on future students without relying completely on federal subsidies, a Biden-Harris administration will need to push for legislation that gives the Department of Education greater authority to establish policies for AP, IB, and dual enrollment course credit.

For example, colleges and universities should be prohibited from capping the amount of credits one can earn towards their degree outside from AP or community college coursework. As long as the students meet the minimum requirements, credit should be granted automatically.

In addition, schools would be required to agree to a universal minimum test score for all AP subject matter tests and a GPA level for coursework at a community college.

These two reforms would help millions of future college students reduce their tuition bill and get them into the job market or graduate school sooner.


CONCLUSION

Promises of massive debt cancellation and increased federal aid are popular with students, but they won’t fix the higher education system’s broken financial model. Instead, they’ll pour more taxpayer money into an opaque, high-inflation college sector and generate new waves of debtladen students and families. We need to break this pernicious cycle by rethinking transparency in higher education with a focus on bringing down costs through a more seamless and transparent process for credit transfers.

Policymakers should require increased transparency on AP and IB credits as part of acceptance packages, as well as ensure that credits transfer more easily between institutions. These will help students and families better plan for the cost of a postsecondary education, and reduce the bills for those who matriculate or transfer with college-level coursework.


ABOUT THE AUTHORS

Paul Weinstein Jr. is a Senior Fellow at the Progressive Policy Institute and Director of the Graduate Program in Public Management at Johns Hopkins University.

Veronica Goodman is the former Director of Social Policy at the Progressive Policy Institute.


REFERENCES


1 Venoo Kakar, Gerald Eric Daniels, and Olga Petrovska, “Does Student Loan Debt Contribute to Racial Wealth Gaps? A Decomposition
Analysis,” Journal of Consumer Affairs 53, no. 4 (2019): pp. 1920-1947, https://doi.org/10.1111/joca.12271.
2 “Not What It Used to Be,” The Economist, December 1, 2012, https://www.economist.com/united-states/2012/12/01/not-what-it-used-to-be
3 “The Rising Cost of College,” The Hamilton Project, December 3, 2010, https://www.hamiltonproject.org/charts/the_rising_cost_of_college.
4 “The Biden Plan for Education beyond High School,” Joe Biden for President: Official Campaign Website, August 2020,
https://joebiden.com/beyondhs/.
5 Ben Miller et al., “Addressing the $1.5 Trillion in Federal Student Loan Debt,” New America (The Emerging Millennial Wealth Gap, October
2019), https://www.newamerica.org/millennials/reports/emerging-millennial-wealth-gap/addressing-the-15-trillion-in-federal-studentloan-debt/.
6 Wesley Whistle, “The Emerging Millennial Wealth Gap,” New America (The Emerging Millennial Wealth Gap, October 2019),
https://www.newamerica.org/millennials/reports/emerging-millennial-wealth-gap/millennials-and-student-loans-rising-debts-and-disparities/.
7 Christopher Ingraham, “Millennials’ Share of the U.S. Housing Market: Small and Shrinking,” The Washington Post, January 20, 2020,
https://www.washingtonpost.com/business/2020/01/20/millennials-share-us-housing-market-small-shrinking/.
8 Ben Miller et al., “Addressing the $1.5 Trillion.”
9 Colleen Campbell, “The Forgotten Faces of Student Loan Default,” Center for American Progress, October 16, 2018,
https://americanprogress.org/article/forgotten-faces-student-loan-default/.
10 Ben Miller, “Who Are Student Loan Defaulters?”, Center for American Progress, December 14, 2017,
https://americanprogress.org/article/student-loan-defaulters/.
11 Ben Miller et al., “Addressing the $1.5 Trillion.”
12 Ben Miller et al., “Addressing the $1.5 Trillion.”
13 Joel Vargas, Caesar Mickens, and Sarah Hooker, “Early College,” Jobs for the Future, https://www.jff.org/what-we-do/impact-stories/
early-college/.
14 Ellen M. Bradburn, David G. Hurst, and Samuel Peng, “Community College Transfer Rates to 4-Year Institutions Using Alternative
Definitions of Transfer,” U.S. Department of Education (Research and Development Report, June 2001), https://nces.ed.gov/
pubs2001/2001197.pdf.
15 Paul Weinstein, “How Biden Can Cut the Cost of College,” Forbes, December 14, 2020, https://www.forbes.com/sites/
paulweinstein/2020/12/14/how-biden-can-cut-the-cost-of-college/?sh=43214ce936a8.
16 Laura W. Perna, “It’s Time to Tell Students How Much College Costs,” The Hill, May 18, 2021, https://thehill.com/blogs/congress-blog/
education/553650-its-time-to-tell-students-how-much-college-costs.
17 Stephen Burd et al., “Decoding the Cost of College,” New America, June 5, 2018, https://www.newamerica.org/education-policy/policypapers/decoding-cost-college/.
18 Paul Weinstein, “Diminishing Credit: How Colleges and Universities Restrict the Use of Advanced Placement,” Progressive Policy Institute,
September 2016, https://www.progressivepolicy.org/wp-content/uploads/2016/09/MEMO-Weinstein-AP.pdf.
19 “Two Decades of Change in Federal and State Higher Education Funding,” The Pew Charitable Trusts, October 15, 2019, https://www.
pewtrusts.org/en/research-and-analysis/issue-briefs/2019/10/two-decades-of-change-in-federal-and-state-higher-education-funding.

PPI’s Trade Fact of the Week: Trump tariff increases contribution to inflation: ~0.5%?

FACT:

Trump tariff increases contribution to inflation: ~0.5%?

THE NUMBERS: 

U.S. tariff collection

2021:        $85.5 billion?*
2016:        $32.2 billion

* Estimated, based on available tariff data for January-September 2021

WHAT THEY MEAN:

The Bureau of Labor Statistics’ startling October 2021 Consumer Price Index report found “the largest 12-month increase [in consumer prices] since the period ending November 1990” — specifically, price inflation of 6.2% from October 2020 through October 2021. The report’s finer detail shows inflation at different rates in different parts of the economy: 30% for energy, 3.2% for services, 5.3% for food, 8.4% for goods excluding food and energy, 9.2% for automobiles, and so on. What sort of role (if any) did tariffs play in this?

Some data first: In 2016, the U.S. “trade-weighted average” tariff was 1.4%. (Taking that year’s $32 billion in tariff revenue, and dividing it by the U.S.’ $2.21 trillion in goods imports.)  In January 2017, the Congressional Budget Office projected that at the same rates, tariff revenue in 2021 would be $42 billion, with income rising slowly along with economic growth. Then, from late 2018 through mid-2020, the Trump administration imposed a series of tariffs: “Section 301” tariffs from 7.5% to 25% on about $350 billion in Chinese imports and “Section 232” tariffs of 25% on steel and 10% on aluminum, along with unusual “safeguard” and “countervailing duty” tariffs on washing machines, solar panels, and Canadian lumber, which are more typical trade policy steps. By 2019, the U.S.’ average tariff had doubled to 2.8%, bringing in a likely $86 billion on about $2.9 trillion in goods imports this year.  Of the extra $54 billion, $46 billion comes from tariffs on Chinese goods, and $1.9 billion from tariffs on steel and aluminum (excluding Chinese-produced metals.)

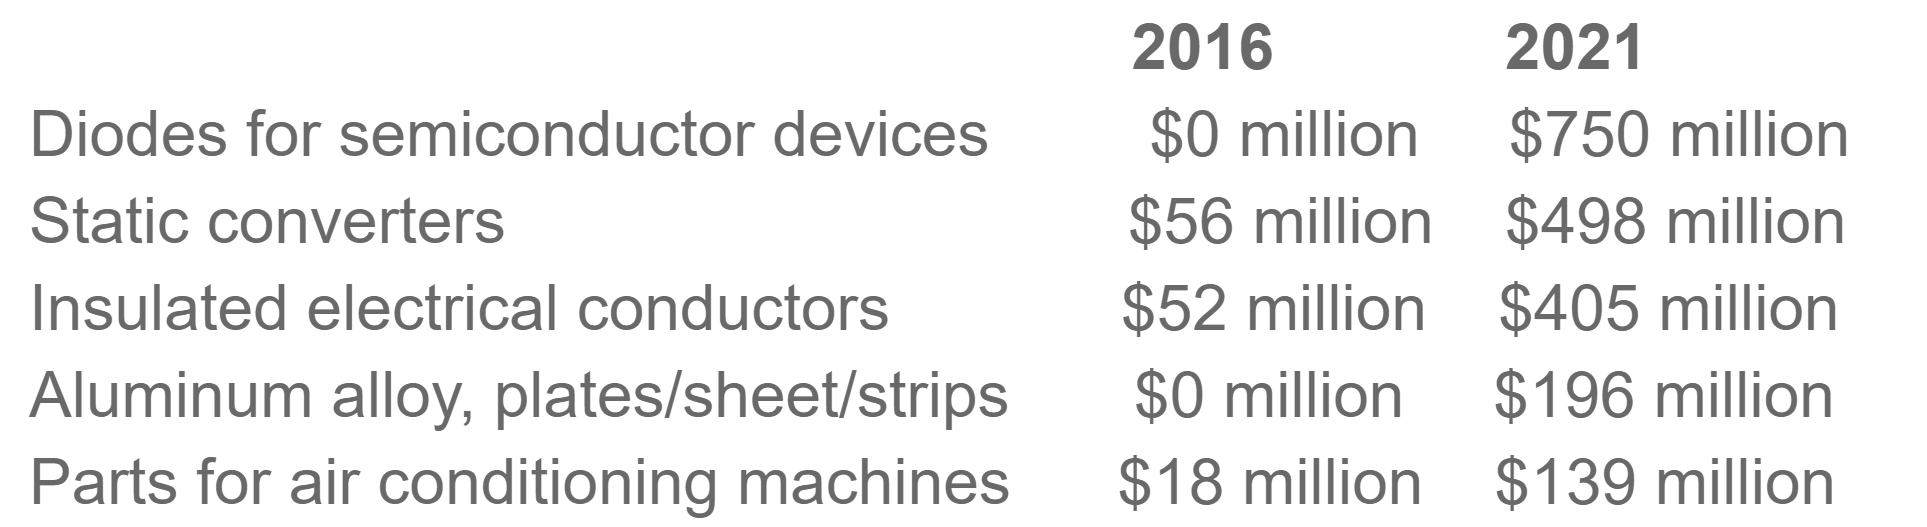
The “232” and “301” tariffs (so-called for the sections of U.S. trade law used to impose them) differ from the U.S.’ permanent “MFN” tariff system in an important way. The permanent U.S. tariff system mainly taxes retailers and shoppers, since its high tariffs are dominated by clothes, shoes, and a few other home goods.  On the other hand, it imposes relatively few taxes on industrial inputs and raw materials, and almost none of those it does charge are very high. The Trump tariffs, while they also cover many consumer products, hit many more industrial inputs and capital goods.  A few examples, again annualizing 2021 revenue figures from the available 9 months of data, illustrate the sources of the extra $54 billion in some detail:

These sorts of things, obviously, are bought more by industrial customers making various other products — machinery manufacturers, automakers, construction firms, air conditioner factories (and repair shops) — than by families.  Economists typically find that import prices of products subject to tariffs did not fall, so the buyers absorbed pretty much the full cost of the tariffs, meaning in turn that they will eventually raise prices of the things they make. A study of the tariff increases on Chinese goods in by San Francisco Federal Reserve staff economists in March 2019 – about halfway through the cycle of tariffs and retaliations — predicted as much, finding a likely consumer price increase of 0.1% economy-wide, and a business investment goods price increase of 0.4%. It also noted that more tariffs would mean more inflation, up to 0.4% in consumer prices and 1.4% in business investment goods were the administration to impose an across-the-board tariff of 25% on all Chinese goods.

More China tariffs did follow over the course of 2019, but not to that hypothetical level; on the other hand, the S.F. Fed study didn’t cover the metals tariffs. Taking this as a guide, the actual tariff contribution to inflation would be likely lie somewhere between the study’s initial 0.1% economy-wide estimate and its hypothetical 0.4%. Adding in the metals might reasonably bring it to 0.5%. Essentially, a secondary but noticeable contribution, presumably with a somewhat higher contribution to the BLS’ actual 8.4% inflation in goods-excluding energy and food.


FURTHER READING

  • The Bureau of Labor Statistics on the Consumer Price Index for October 2020 to October 2021 can be read here.
  • San Francisco Federal Reserve staff study potential inflationary impacts of tariffs, March 2019. Read more here.
  • The Congressional Budget Office looks at broader economic impacts, August 2019. (Conclusion: “On balance, in CBO’s projections, the trade barriers imposed since January 2018 reduce both real output and real household income. By 2020, they reduce the level of real U.S. GDP by roughly 0.3 percent and reduce average real household income by $580 (in 2019 dollars. Beyond 2020, CBO expects those effects to wane as businesses adjust their supply chains.  By 2029, in CBO’s projections, the tariffs lower the level of real U.S. GDP by 0.1 percent and the level of real household income by 0.2 percent.”) Read the CBO’s take.
  • Academics Pablo Fajgenbaum, Pinelopi Goldberg, Patrick Kennedy, and Amit Khandelwal examine the tariffs and their impact, finding (among much else) that U.S. buyers pay it all.
  • Peterson Institute’s Chad Bown in depth on the China tariffs can be read here.


ABOUT ED

Ed Gresser is Vice President and Director for Trade and Global Markets at PPI.

Ed returns to PPI after working for the think tank from 2001-2011. He most recently served as the Assistant U.S. Trade Representative for Trade Policy and Economics at the Office of the United States Trade Representative (USTR). In this position, he led USTR’s economic research unit from 2015-2021, and chaired the 21-agency Trade Policy Staff Committee.

Ed began his career on Capitol Hill before serving USTR as Policy Advisor to USTR Charlene Barshefsky from 1998 to 2001. He then led PPI’s Trade and Global Markets Project from 2001 to 2011. After PPI, he co-founded and directed the independent think tank ProgressiveEconomy until rejoining USTR in 2015. In 2013, the Washington International Trade Association presented him with its Lighthouse Award, awarded annually to an individual or group for significant contributions to trade policy.

Ed is the author of Freedom from Want: American Liberalism and the Global Economy (2007).  He has published in a variety of journals and newspapers, and his research has been cited by leading academics and international organizations including the WTO, World Bank, and International Monetary Fund. He is a graduate of Stanford University and holds a Master’s Degree in International Affairs from Columbia Universities and a certificate from the Averell Harriman Institute for Advanced Study of the Soviet Union.

Read the full email and sign up for the Trade Fact of the Week

U.S. Primed to Harness Untapped Geothermal Energy Potential, Argues New Report from PPI’s Innovation Frontier Project

With clean energy a central component of the Biden Administration’s climate strategy, any divestment from existing oil and gas projects should go hand in hand with exploring geothermal energy, a largely untapped renewable resource, argues a new report from the Progressive Policy Institute (PPI)’s Innovation Frontier Project.

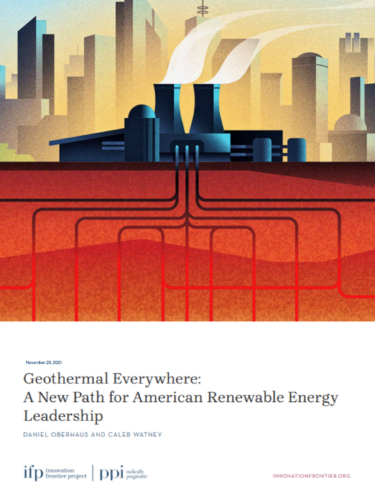
The report, authored by Daniel Oberhaus and Caleb Watney and titled “Geothermal Everywhere: A New Path for American Renewable Energy Leadership,” identifies the technological, political, and economic reasons that the U.S. has failed to utilize its valuable geothermal resources, along with actionable policy recommendations to lay a new foundation for green energy and international geothermal expansion.

“The far-reaching potential of geothermal energy provides a rare opportunity for the United States to capitalize upon a new renewable energy pathway, not just for domestic production but sustainable development globally. With strong leadership and smart policy–as Oberhaus and Watney identify–we can rapidly accelerate the development of geothermal projects, leading the world on climate while encouraging innovation and creating jobs,” said Jack Karsten, Managing Director of the Innovation Frontier Project at PPI.

Oberhaus and Watney argue that while less than 0.5% of U.S. electricity generation is derived from geothermal resources, our abundant hot rock resources and deep talent pool in the oil and gas sector uniquely prepare us to lead on that technology. They conclude that with the right policy implementations, geothermal energy production could increase 26-fold by 2050.

The report makes the following recommendations for incentivizing geothermal investment and expanding production capacity:

Streamline the federal permitting process for geothermal projects.

Increase the federal budget for large scale geothermal R&D projects, particularly those led by public-private partnerships.

Create incentives for geothermal generation in state electricity markets.

Establish federal innovation prizes, or related mechanisms, for the development of key geothermal technologies.

Reskill oil and gas workers for geothermal projects through federal jobs programs and private investment.

Read the report and expanded policy recommendations here:

Based in Washington, D.C., and housed in the Progressive Policy Institute, the Innovation Frontier Project explores the role of public policy in science, technology and innovation. The project is managed by Jack Karsten. Learn more by visiting innovationfrontier.org.

The Progressive Policy Institute (PPI) is a catalyst for policy innovation and political reform based in Washington, D.C. Its mission is to create radically pragmatic ideas for moving America beyond ideological and partisan deadlock. Learn more about PPI by visiting progressivepolicy.org.

###

Media Contact: Aaron White; awhite@ppionline.org

PPI’s Trade Fact of the Week: U.S. farm export losses as shipping companies decline cargoes, as of mid-year 2021: $1.5 billion?

FACT:

U.S. farm export losses as shipping companies decline cargoes, as of mid-year 2021: $1.5 billion?

THE NUMBERS: 

Containers* arriving at Port of Los Angeles:

4.72 million:      January-October 2021
3.48 million:      January-October 2020
3.97 million:      January-October 2019

* Counted in TEUs (“twenty-foot equivalent units”, for the standard 20’ x 8’ x 8.5’ shipping container)

WHAT THEY MEAN:

D.C.’s taxi cabs and their dispatchers obey a public-interest rule:  If you wish to serve the lucrative routes — say, Dulles-to-Mayflower Hotel and back — you must also agree to pick up fares from the neighborhoods. Representatives John Garamendi (D-Calif.) and Dusty Johnson (R-S.D.), in their proposed Ocean Shipping Reform Act, pose a question: Shouldn’t the world’s container ships live by a similar rule, requiring them to carry American export cargoes as well as inbound containers?

Statistics put out monthly by American container ports suggest why they ask this question.  From January through October, the Port of Los Angeles — the busiest U.S. container port — took in 4.72 million containers (again in TEUs). This is a bigger total than all but one of LA’s full-year incoming container counts, and based on a daily average of about 15,500 arriving containers, the 4.87 million-TEU record set in 2018 probably fell two weeks ago.  Statistics are much the same at the second-busiest port — Long Beach, ten minutes’ drive east on the Seaside Freeway — which likely broke its own annual record last weekend.  Meanwhile, truckers and warehouse workers have been leaving their jobs all year for better options: 1.4 million workers in the Bureau of Labor Statistics’ transport/warehousing/utility sector have quit through September, easily breaking the 1.1 million full-year record set in 2002.  So with record arrivals on one hand and bottlenecks on the other, the ports have clogged up. The resulting worries about Christmas inventories and intra-U.S. supply bottlenecks are intense enough to worry even the President of the United States.

A less publicized consequence of the incoming-container surge is a perverse incentive for shipping companies:  they’re tempted to ignore U.S. exporters. Fees to ferry a container from Asia to the West Coast, normally between $2,000 and $3,000, have run at $15,000 for much of this year and at times hit $20,000.  With import income so high, a ship can often earn more money by turning around empty to refill in Asia than by loading a waiting U.S. export cargo for $3,000 or so.  September’s Port of Los Angeles container report provides a vivid illustration: it counted 434,294 outbound containers, of which 358,351 traveled empty, and only 75,713 carrying U.S. cargo — the Port’s lowest count of full export containers since the autumn of 2002.

This hits farm exporters who use containers especially hard, as producers of meats, dairy, wines, tree nuts, and specialty crops often require quick pickup of perishable goods.  As of mid-year they reported losing $1.5 billion in exports. To put this in perspective, calculations by the Department of Agriculture’s Economic Research Service done for 2019 suggest that each $1.5 billion in agricultural exports meant about $1.7 billion in economic activity for the U.S., including about 12,000 jobs and $500 million in farm income.

Hence, the bill Reps. Garamendi and Johnson propose.  Returning to the taxicab analogy, a D.C. taxi company fielding a request for dispatch must accept the fare (unless the customer is belligerent, intoxicated, etc.) or face a $250 civil penalty.  Maritime shipping operates on an obviously different scale — a single medium-sized container ship could carry all 7,151 D.C. cabs if it wanted to**, and there are 6,293 such ships on the water — but also has some similarities.  Like taxicabs, the mighty vessels run by Maersk, Evergreen, COSCO, MSC et al. are “common carriers” given a right to serve U.S. ports. Under the bill, this right would come with a complementary responsibility to serve American exporters and could not “unreasonably decline export cargo bookings if such cargo can be loaded safety and timely and carried on a vessel scheduled for such cargo’s immediate destination” without becoming liable to penalties by the Federal Maritime Commission.

** Yes, we know, not a likely real-world scenario.  Cars aren’t easy to squish into containers (though it can be done if necessary), and usually travel on roll-on/roll-off ships. Just meant as a visual.


FURTHER READING

Legislation

From Reps. Garamendi and Johnson, read the Ocean Shipping Reform Act.

A supportive White House post can be read here.

The Federal Maritime Commission, tasked with regulating ocean carriers and (should the Garamendi/Johnson bill pass) enforcing new rules.

Agriculture and the export economy

Farm Bureau economist Daniel Munch on the West Coast port challenges and their impact on American agriculture, read the piece here.

The New York Times’ Ana Swanson (subs. req.) has the view from the California dairy farm, read the piece here.

And the USDA’s most recent investigation of ag exports and their economic impact at home can be read here.

Ports and ships

Container statistics from the Port of Los Angeles can be found here.

UNCTAD’s 2021 Review of Maritime Transport, with examinations of the impact of COVID-19 on 2020 shipping and cargo, the 2021 rebound, and some glum detail on U.S. ports.  The three busiest U.S. container ports – Los Angeles, Long Beach, and New York – handle 25 million containers per year, about as many as China’s 4th-busiest port (Shenzhen) does all by itself.  The world’s top two — Shanghai and Singapore — manage 44 million TEU and 37 million TEU, respectively.

Help on the way — The White House summarizes the maritime investment sections of the bipartisan Infrastructure Investment & Jobs Act.

And last …

What are container ships really like?  Horatio Clare’s Down to the Sea in Ships (2015) recounts a trip on the Gerd Maersk, a 6,600-TEU ship built in 2006, on a UK-through-Suez-to-Malaysia-Vietnam-China-to-Los Angeles rout. Detail on crew life (Filipino ratings, European and Indian officers; no alcohol at any time), cargo loading, rules for avoiding piracy, the approach to the Port of L.A., etc. The average (mean) capacity of a container ship this year is about 4,000 TEU, placing Gerd Maersk in the larger-than-average class able in theory to carry *nearly* all of D.C.’s taxicabs. The biggest current ships are the three Japanese-built 23,992-TEU Ace series delivered to Taiwan’s Evergreen line this year; 1,312 feet long, 212 feet wide, and 108 feet deep, they could carry the whole D.C. cab fleet and still be two-thirds empty.

ABOUT ED

Ed Gresser is Vice President and Director for Trade and Global Markets at PPI.

Ed returns to PPI after working for the think tank from 2001-2011. He most recently served as the Assistant U.S. Trade Representative for Trade Policy and Economics at the Office of the United States Trade Representative (USTR). In this position, he led USTR’s economic research unit from 2015-2021, and chaired the 21-agency Trade Policy Staff Committee.

Ed began his career on Capitol Hill before serving USTR as Policy Advisor to USTR Charlene Barshefsky from 1998 to 2001. He then led PPI’s Trade and Global Markets Project from 2001 to 2011. After PPI, he co-founded and directed the independent think tank ProgressiveEconomy until rejoining USTR in 2015. In 2013, the Washington International Trade Association presented him with its Lighthouse Award, awarded annually to an individual or group for significant contributions to trade policy.

Ed is the author of Freedom from Want: American Liberalism and the Global Economy (2007).  He has published in a variety of journals and newspapers, and his research has been cited by leading academics and international organizations including the WTO, World Bank, and International Monetary Fund. He is a graduate of Stanford University and holds a Master’s Degree in International Affairs from Columbia Universities and a certificate from the Averell Harriman Institute for Advanced Study of the Soviet Union.

Read the full email and sign up for the Trade Fact of the Week


Johnson for New York Daily News: Give Biden credit for going big

By Jeremiah Johnson

Left-wing pundits have created a narrative around Biden’s presidency — small-time actions, disappointment and betrayals. The Young Turks’ Cenk Uygur calls Biden a “corporate Democrat” and claims that the Build Back Better bill is “trash” that contains “nothing for progressives.” Some progressive groups claim that the bipartisan infrastructure bill “makes things worse,” compared to doing nothing. This is a long-running theme with left-wing criticism. Progressive darling Nina Turner compared Donald Trump to eating a bowl of excrement, then compared Biden to eating half a bowl — as though the two were remotely comparable. These critics paint Biden as unwilling to take bold actions, to break from Trump or to go big.

These criticisms are fundamentally wrong. Far from playing small ball, Joe Biden is having one of the most impressive and transformative first years of any president in generations. Biden deserves far more credit for going big and getting things done.

Read the full piece in New York Daily News.

Solving the 5G/Altimeter Conundrum

The headline of a November 18 article in Ars Technica says it all: “FAA forced delay in 5G rollout despite having no proof of harm to aviation: US delays even as 40 countries use C-band with no reports of harm to altimeters.”

What’s the story here? An interagency squabble between the FAA and the FCC could damage the US ability to implement 5G service, just as the economy is starting to accelerate. 5G provides essential new capabilities for businesses in areas from digital manufacturing to logistics to agriculture. A 2020 PPI report projected that 5G-enabled enterprises could create 4.6 million jobs over the next 15 years, and hundreds of thousands of jobs in the near-term. The Biden Administration must step in and make sure that this issue is settled as quickly as possible, in a way that accounts for safety without holding back growth.

Mobile providers have just spent $80 billion on licenses for what is known as C-band spectrum, which has very desirable characteristics for 5G service, in terms of speed and coverage. The issue is that aircraft altimeters, which measure the altitude of a plane, utilize frequencies that are close to the C-band spectrum used for 5G. Aware of this problem, the FCC put in a large “guard band” of unused spectrum between the 5G frequencies and the altimeter frequencies.

The FAA decided that the FCC’s actions weren’t good enough, and warned of “potential adverse effects on radio altimeters.” This forced Verizon and AT&T to delay their planned roll-out of the new 5G capabilities for at least a month while the agencies duked it out.

But here’s the thing. This C-band spectrum is already in use in 40 other countries which have experienced no problems with altimeters. Moreover, US airlines continue to fly to these countries As Roger Entner wrote, if the interference problem is as dire as the FAA says, “why have the airlines and aeronautics manufacturers not grounded planes” in those countries?

Moreover, the FAA is relying on studies which appear to be using unrealistic assumptions. Based on these assumptions, existing systems would already be interfering with altimeters. For example, Peter Rysavy writes that

Navy radar, such as the AN/SPN-43 radar, operates in mid-band frequencies at extremely high power with ground transmitters pointing at aircraft in geographical areas where U.S. planes operate. Such potential interference, however, has not been a problem in the real world.

This is not the time for agency parochialism. The Biden Administration has to make sure that this problem gets resolved quickly and in accordance with science and good engineering practice.

Bledsoe for The Hill: Can America prevent a global warming cold war?

By Paul Bledsoe

At the 11th hour of climate negotiations in Scotland last week, the U.S. and China released a “Joint Glasgow Declaration on Enhancing Climate Action in the 2020s” outlining increased cooperation on a wide range of climate and clean energy topics. The communique’s careful language was redolent of Cold War détente documents, increasing a sense that climate change bargaining with China, Russia and other adversaries is becoming like Cold War nuclear nonproliferation negotiations: failure could be catastrophic, so enhanced cooperation is crucial, but often slow-going.

Yet, the climate crisis doesn’t permit the luxury of time. Leading science finds that to limit devastating near-term climate impacts, and reduce risks of runaway warming, China especially must cut its emissions as soon as possible this decade, not just in the long-term.  So far, however, despite the new declaration, and climate discussions this week between President Joe Biden and Chinese President Xi Jinping, Beijing has made no such commitment. In fact, Chinese coal use just reached an all-time high.

Read the full piece in The Hill. 

Marshall for The Hill: Popping the progressive bubble

By Will Marshall

For Virginia Democrats like me, the odd-year elections earlier this month were like a gruesome coda to Halloween. Republicans swept the top three statewide offices, took over the House of Delegates and knocked the Old Dominion back into swing state status.

As painful as they were, however, the Democratic losses in Virginia and close shave in New Jersey have had one salutary effect: They seem to have popped the progressive bubble — the activist left’s claims, credulously accepted by many media commentators, to be the authentic voice and future of the Democratic Party.

Post-election analysis has highlighted the pitfalls for Democrats of heeding only that voice. The protracted battle in Washington over progressives’ big social spending demands has reinforced public doubts about President Biden. Republicans also made notable gains among parents angry over school closures, falling standards and academic “antiracism” theories promoted by progressive social justice warriors.

Read the full piece in the Hill.

Is American Technological Leadership Under Attack?

The Progressive Policy Institute’s Innovation Frontier Project released a comprehensive research deck on the threats facing American innovation. The authors of the deck, innovation experts Ashish Arora and Sharon Belenzon of Duke University, found the United States has lost a substantial amount of corporate research since the 1980s, with only a handful of present-day U.S.-based companies investing in research at a meaningful level.

The deck also lays out clear political implications for lawmakers. The Biden Administration’s top strategic economic priorities are based on a foundation of strong U.S. competitiveness and innovation, yet Congress’s percolating anti-tech antitrust legislation would undermine these priorities by impairing the ability of America’s few leading R&D performers to develop new products and enter new markets. The restrictions on these companies will reduce our national investment in R&D and hurt American economic prosperity and national security.

Jack Karsten, Managing Director of the Innovation Frontier Project, and Michael Mandel, Vice President and Chief Economic Strategist at PPI break down the deck’s research and discuss how antitrust legislation in Congress would devastate American technological leadership and innovation.

Check out the research deck here.

Learn more about the Progressive Policy Institute here.