FACT: PPI’s Trade Fact of the Week: A quarter of Ohio’s manufacturing workers work for international businesses.
THE NUMBERS:
| U.S. private-sector employment, 2021: | 124.38 million |
| … at foreign-owned businesses: | 7.94 million |
| … U.K.-owned: | 1.22 million |
| … German-owned: | 0.92 million |
| … Canadian-owned: | 0.87 million |
| … Japanese-owned: | 0.96 million |
| … all other countries: | 3.97 million |
WHAT THEY MEAN:
Anxiety-filled comment from Sen. J.D. Vance, an Ohio Republican, last month in response to U.S. Steel’s acceptance of a $14 billion purchase offer from Tokyo-based Nippon Steel:
““Today, a critical piece of America’s defense industrial base was auctioned off to foreigners for cash …”
In fact of course the company was not at “auction” as a sort of estate sale or distressed asset, Japan is not a random group of unknown foreigners but a core U.S. ally, and Nippon Steel is a long-term participant in U.S. metals production. A more temperate comment from Lael Brainard, running the White House’s National Economic Council, says these sorts of transactions can have implications beyond the capital markets, and that the U.S. government has a well-established process for examining them:
“This looks like the type of transaction that the interagency committee on foreign investment Congress empowered and the Biden Administration strengthened is set up to carefully investigate. This Administration will be ready to look carefully at the findings of any such investigation and to act if appropriate.”
Here’s some background:
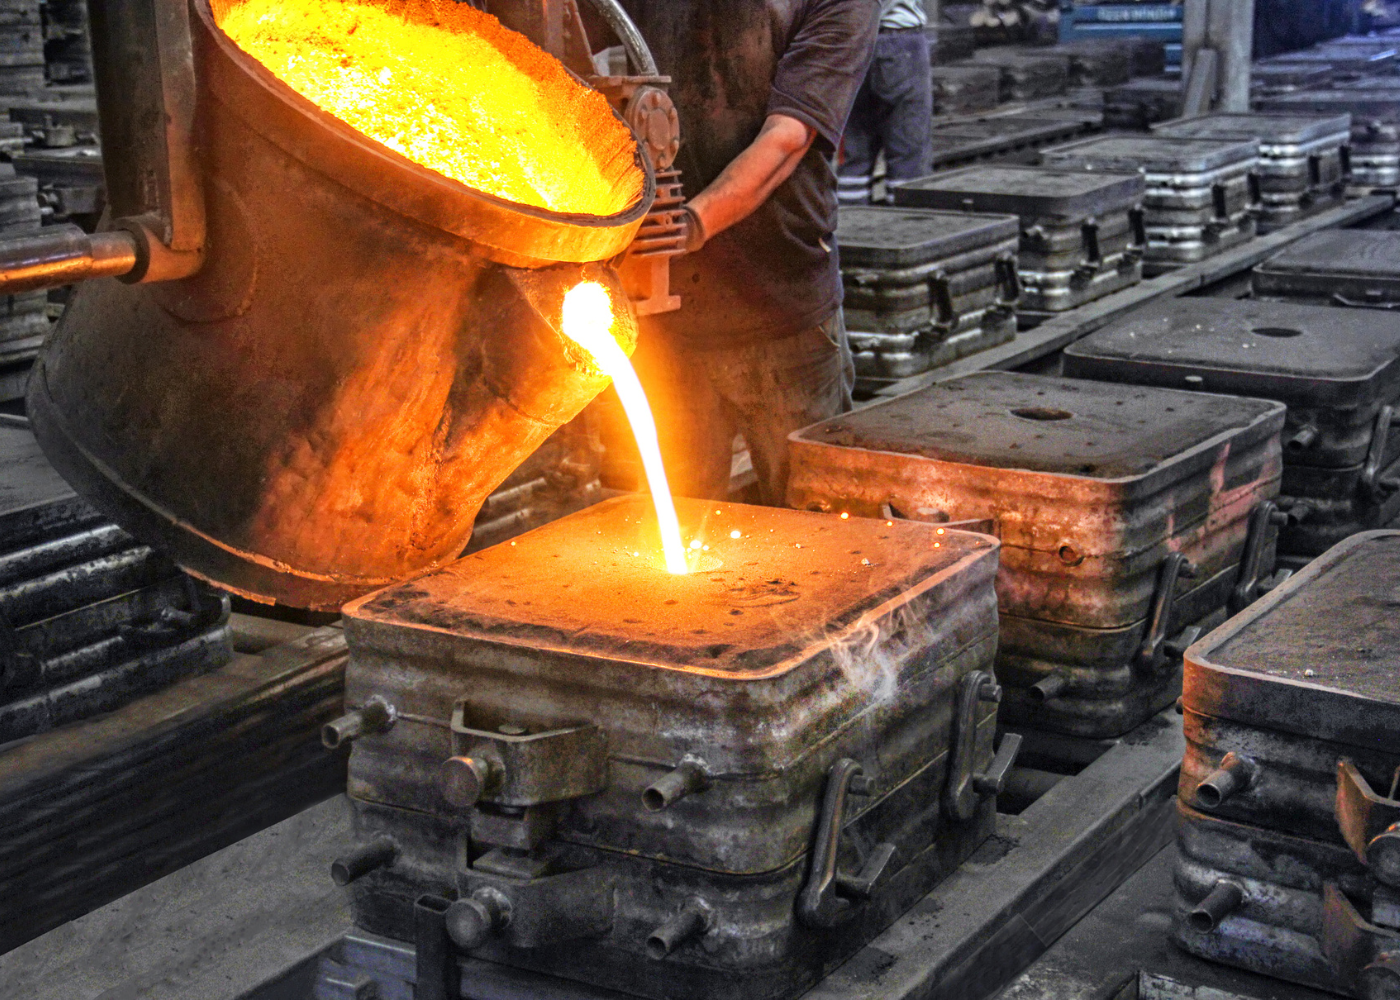
Steel Output: The world’s steel mills pour about 1.9 billion glowing tons of metal a year. The World Steel Association’s “World Steel in Figures 2023” summary places China’s 1.018 billion tons at more than half of 2022’s 1.885 billion-ton total, with India a distant second at 125 million tons, Japan third at 89 million tons, and the U.S. fourth at 80.5 million tons. Six of the world’s 10 largest producers are Chinese; the remaining four include two Japanese firms, one Korean company, and the equivocal Arcelor-Mittal, which is based in Luxembourg but Indian by origin and management. Nippon Steel’s 44.4 million tons of output placed it fourth in the world. U.S. Steel’s 14.5 million tons ranked 27th worldwide and third in the U.S. after Nucor’s 20.6 million tons and Cleveland-Cliffs’ 16.8 million.
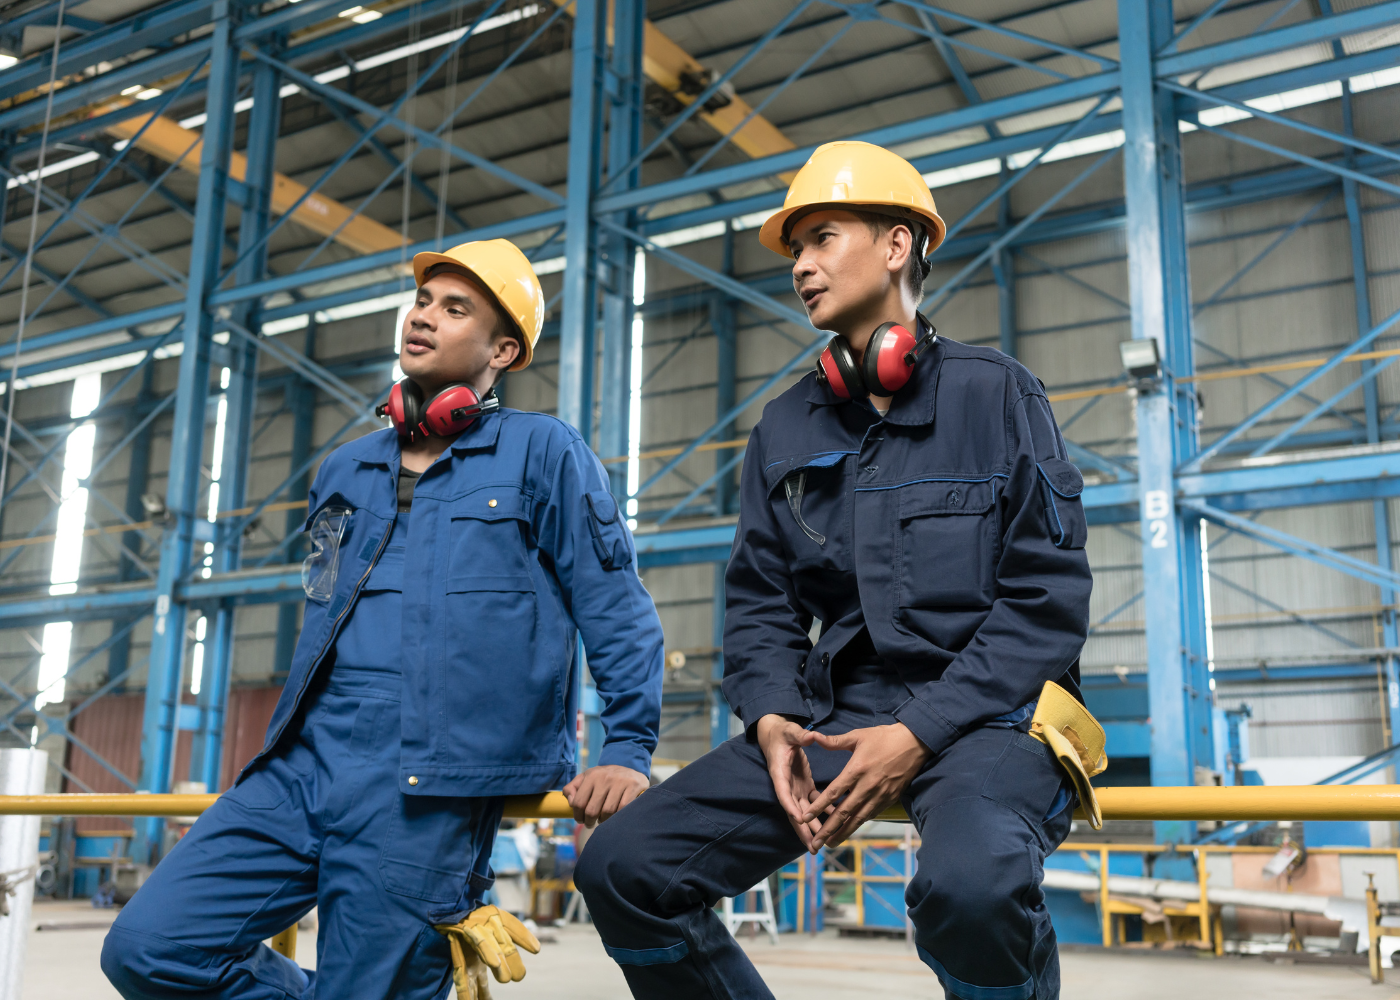
Foreign Investment in the United States: The Commerce Department’s Bureau of Economic Analysis, meanwhile, tracks U.S. business investment abroad and foreign investment here. Its most recent annual tally, out last August and covering the year 2021, reports that international businesses employed 7.94 million American workers in 2021 – that is, a modest 6.2% share of that year’s 124.3 million private-sector workers. The international role in U.S. manufacturing is a lot larger, though: 2.81 million American manufacturing workers — about 23% of 2021’s 12.35 million total — go to work daily for international businesses. This includes 153,000 of Ohio’s 675,000 manufacturing workers, mirroring the national 23% employment share and the fourth-largest total of any state. In Ohio as nationwide, Japanese firms are the top employer and Germans second. By country of origin, the largest groups are:
| All manufacturing workers: | 12.35 million |
| U.S.-based firms: | 9.54 million |
| International firms total: | 2.81 million |
| Japanese firms: | 0.54 million |
| German firms: | 0.32 million |
| British firms: | 0.24 million |
| French firms: | 0.21 million |
| Swiss firms: | 0.18 million |
| Canadian firms: | 0.15 million |
By industry, the single largest group of workers at international manufacturers — 512,000 — are in automaking, followed by 426,000 in chemicals and 334,000 in food production. In “primary metals” (which in BEA’s reports are combined as a group – steel, copper, aluminum, lead, etc.) BEA finds international firms producing $7.1 billion of 2021’s $74 billion in value-added U.S. output and employing 62,000 of the 357,000 total American metal workers. As an example, the Calvert mill in Alabama, with a 5.3 million ton annual capacity, has operated as a joint venture by Nippon Steel and Arcelor-Mittal since 2014, after its 2010 launch by German industrial conglomerate Thyssen-Krupp.
BEA’s “primary metals” employment figure is actually a bit low in historical terms — noticeably down from the 95,000 workers of 2000 and the 92,000 of 2019. The post-2019 decline appears mainly to reflect Arcelor-Mittal’s 2020 sale of most of its U.S. steel assets (but not the Alabama site) to Cleveland-Cliffs. This event wasn’t especially unusual for FDI transactions, in which ownership occasionally shifts back and forth among the U.S., Canada, Europe, and Japan. In autos, for example, Fiat’s current ownership of the venerable Chrysler Motors factories — now operating under the name “Stellantis”, with French producer Peugeot also a partner – followed a period of sole U.S. ownership from 2007-2014; and this in turn succeeded the company’s 1998-2007 incarnation as DaimlerChrysler.
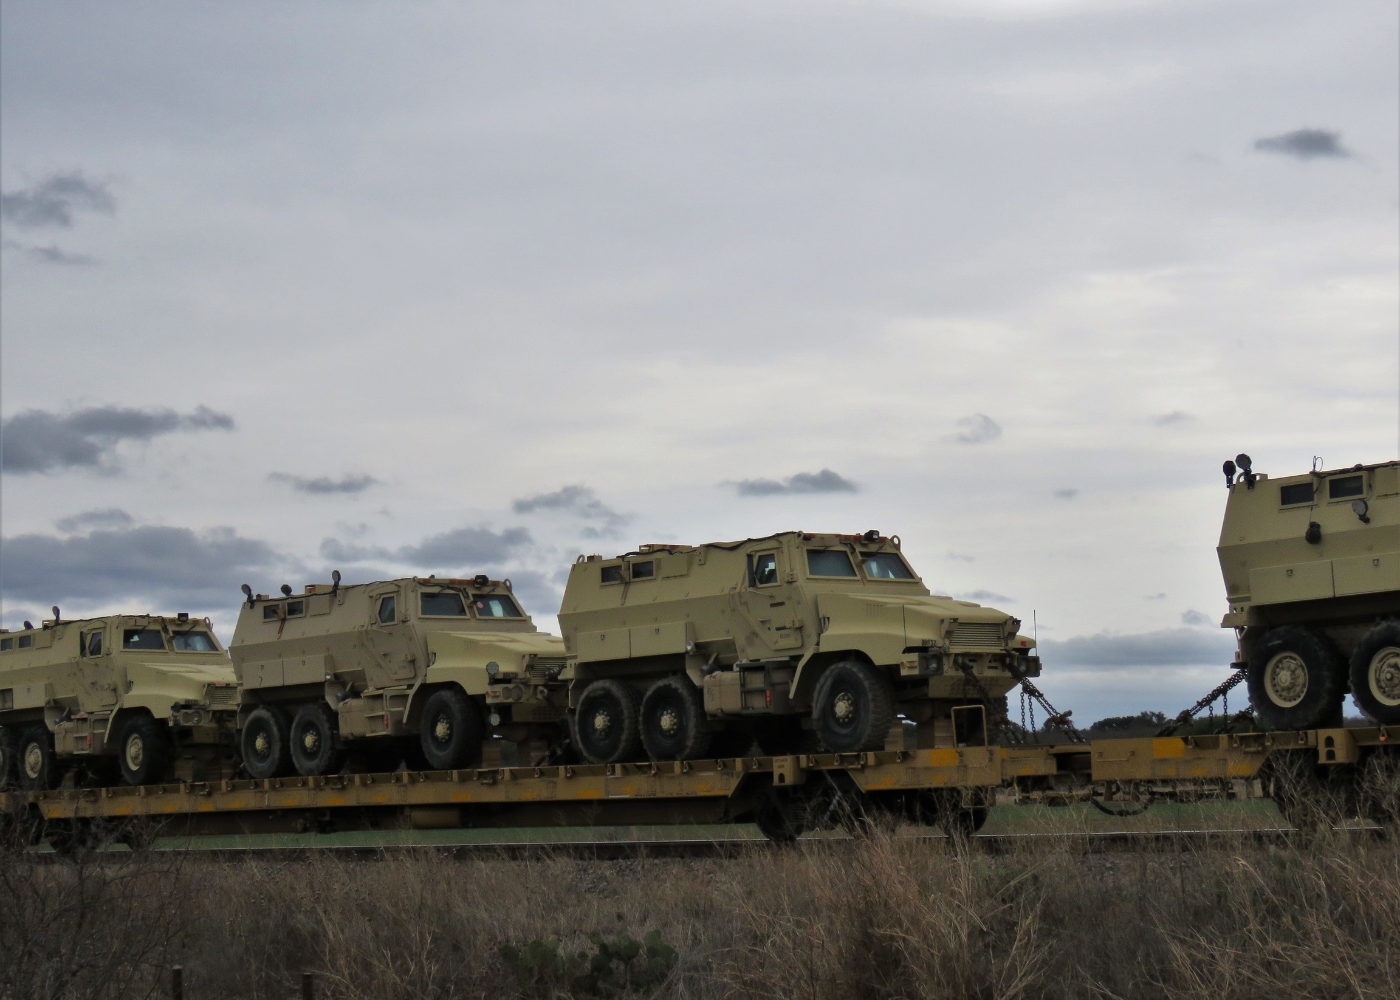
U.S. Policy & Institutions: With all this in the background, (a) international participation in U.S. heavy industry in general, or metals specifically, isn’t new, and (b) some purchases, of course, are sensitive by the nature of the industry or the prospective buyer. To examine and answer the questions they raise — for the defense industry, critical infrastructure, intellectual property, and research, or other reasons — and take such action as might be necessary (if any is needed), the U.S. government uses the long-functioning interagency group Dr. Brainard’s comment cites.
Known as the Committee on Foreign Investment in the United States, “CFIUS”, this is a permanent executive-branch expert group composed of nine agencies — the Treasury Department as the chair, along with the Departments of State, Justice, Commerce, Homeland Security, Energy, and Defense, plus the U.S. Trade Representative and the White House’s Office of Science and Technology Policy. CFIUS reviewed 154 FDI deals in 2022 (some easily decided to be non-controversial, others requiring more investigation), a total slightly below the 164 reviews of 2021 and a bit above the 120 of 2020. These involved facilities and enterprises ranging from auto parts, metalworking, pharmaceuticals, and boat-building through the information sector such as software publishing and data processing to telecommunications, financial services, and medical labs.
In sum: International businesses are a large and lively part of the U.S. economy, particularly in manufacturing. They carry on lots of research, make lots of cars and a significant amount of metal, and employ about a quarter of the American factory workforce. It’s perfectly reasonable nonetheless to examine new purchase proposals. And given U.S. Steel’s unusually evocative history — sepia-tinged images of Carnegie, Morgan, and Schwab; mid-20th-century black-and-white reels tagged “Rooting for the Yankees is like …” — emotional reactions aren’t surprising. But neither the basic issues, nor Nippon Steel as a particular company given its significant participation in U.S. metals production over time, are novelties. As Brainard suggests, the government has a perfectly functional way to examine any questions the transaction might raise, and a hyperventilating response probably isn’t very useful.
FURTHER READING
Perspectives on metals:
Sen. J.D. Vance worries.
National Economic Council Chair Brainard suggests a review.
The World Steel Association’s most recent stat summary, with top producing and consuming countries, companies, and trends.
And the Alabama Department of Commerce on international steel investment at Calvert.
Data:
BEA’s summary of foreign multinationals’ U.S. affiliates.
… and data back to 2007.
Looking the other way, U.S.-based multinationals produced about $5.1 trillion worth of goods and services in the U.S. in 2021, and $1.5 trillion abroad, while employing 28.9 million workers in the U.S. and 14.0 million overseas.
And UNCTAD’s World Investment Report has global context.
And CFIUS explained:
U.S. Treasury Department’s background and foreign investment policy guidance.
… and CFIUS’ annual reports with stats and investigation summaries back to 2008.
ABOUT ED
Ed Gresser is Vice President and Director for Trade and Global Markets at PPI.
Ed returns to PPI after working for the think tank from 2001-2011. He most recently served as the Assistant U.S. Trade Representative for Trade Policy and Economics at the Office of the United States Trade Representative (USTR). In this position, he led USTR’s economic research unit from 2015-2021, and chaired the 21-agency Trade Policy Staff Committee.
Ed began his career on Capitol Hill before serving USTR as Policy Advisor to USTR Charlene Barshefsky from 1998 to 2001. He then led PPI’s Trade and Global Markets Project from 2001 to 2011. After PPI, he co-founded and directed the independent think tank ProgressiveEconomy until rejoining USTR in 2015. In 2013, the Washington International Trade Association presented him with its Lighthouse Award, awarded annually to an individual or group for significant contributions to trade policy.
Ed is the author of Freedom from Want: American Liberalism and the Global Economy (2007). He has published in a variety of journals and newspapers, and his research has been cited by leading academics and international organizations including the WTO, World Bank, and International Monetary Fund. He is a graduate of Stanford University and holds a Master’s Degree in International Affairs from Columbia Universities and a certificate from the Averell Harriman Institute for Advanced Study of the Soviet Union.