FACT: Haiti exported half a billion clothing articles to the U.S. last year.
THE NUMBERS: Haitian clothing exports to U.S. (2021) –
~10% of GDP
~20% of wage-paying jobs
WHAT THEY MEAN:
A vivid passage from Pamela White, an Obama-era U.S. Ambassador to Haiti, testifying to the House Foreign Affairs Committee on life in Port-au-Prince in late September:
“No legitimate government, no judiciary, no parliament, and a weak police force incapable of stopping the gangs that now rule over 60% of the capital. … Haitians are living in hellish conditions — all social services were terminated months ago. Port-au-Prince has the highest number of kidnappings in the world.”
And a very careful State Department comment last Friday:
“[T]he question of a security presence is obviously an area where we are treading very carefully to make sure that we are doing the right things and not doing the things in the past that have not worked…”
In such circumstances, neither outsiders nor Haitians have easy ways to find the “right things”. A relatively easy place to start, though, is to identify and preserve things that have worked. With this in mind, here is some opaque stuff about clothing trade, from the U.S. Commerce Department’s Office of Textiles and Apparel:
“Unlimited duty-free treatment for various apparel products [from Haiti], with certain restrictions regarding the source of the yarns and fabrics used in the apparel, and duty-free treatment for certain apparel products up to certain annual quota levels, known as trade preference levels (TPLs).”
The programs Commerce describes, designed in the late 2000s and known as “HOPE” and “HELP,”* mean in practice that a Haitian-made pullover shirt normally subject to tariffs of 16.5% (if cotton) and 32% (if polyester) is not only (a) duty-free but (b) in contrast to the intricate rules imposed on T-shirts arriving under free trade agreements, can be made of fabric from whatever country makes most economic sense.
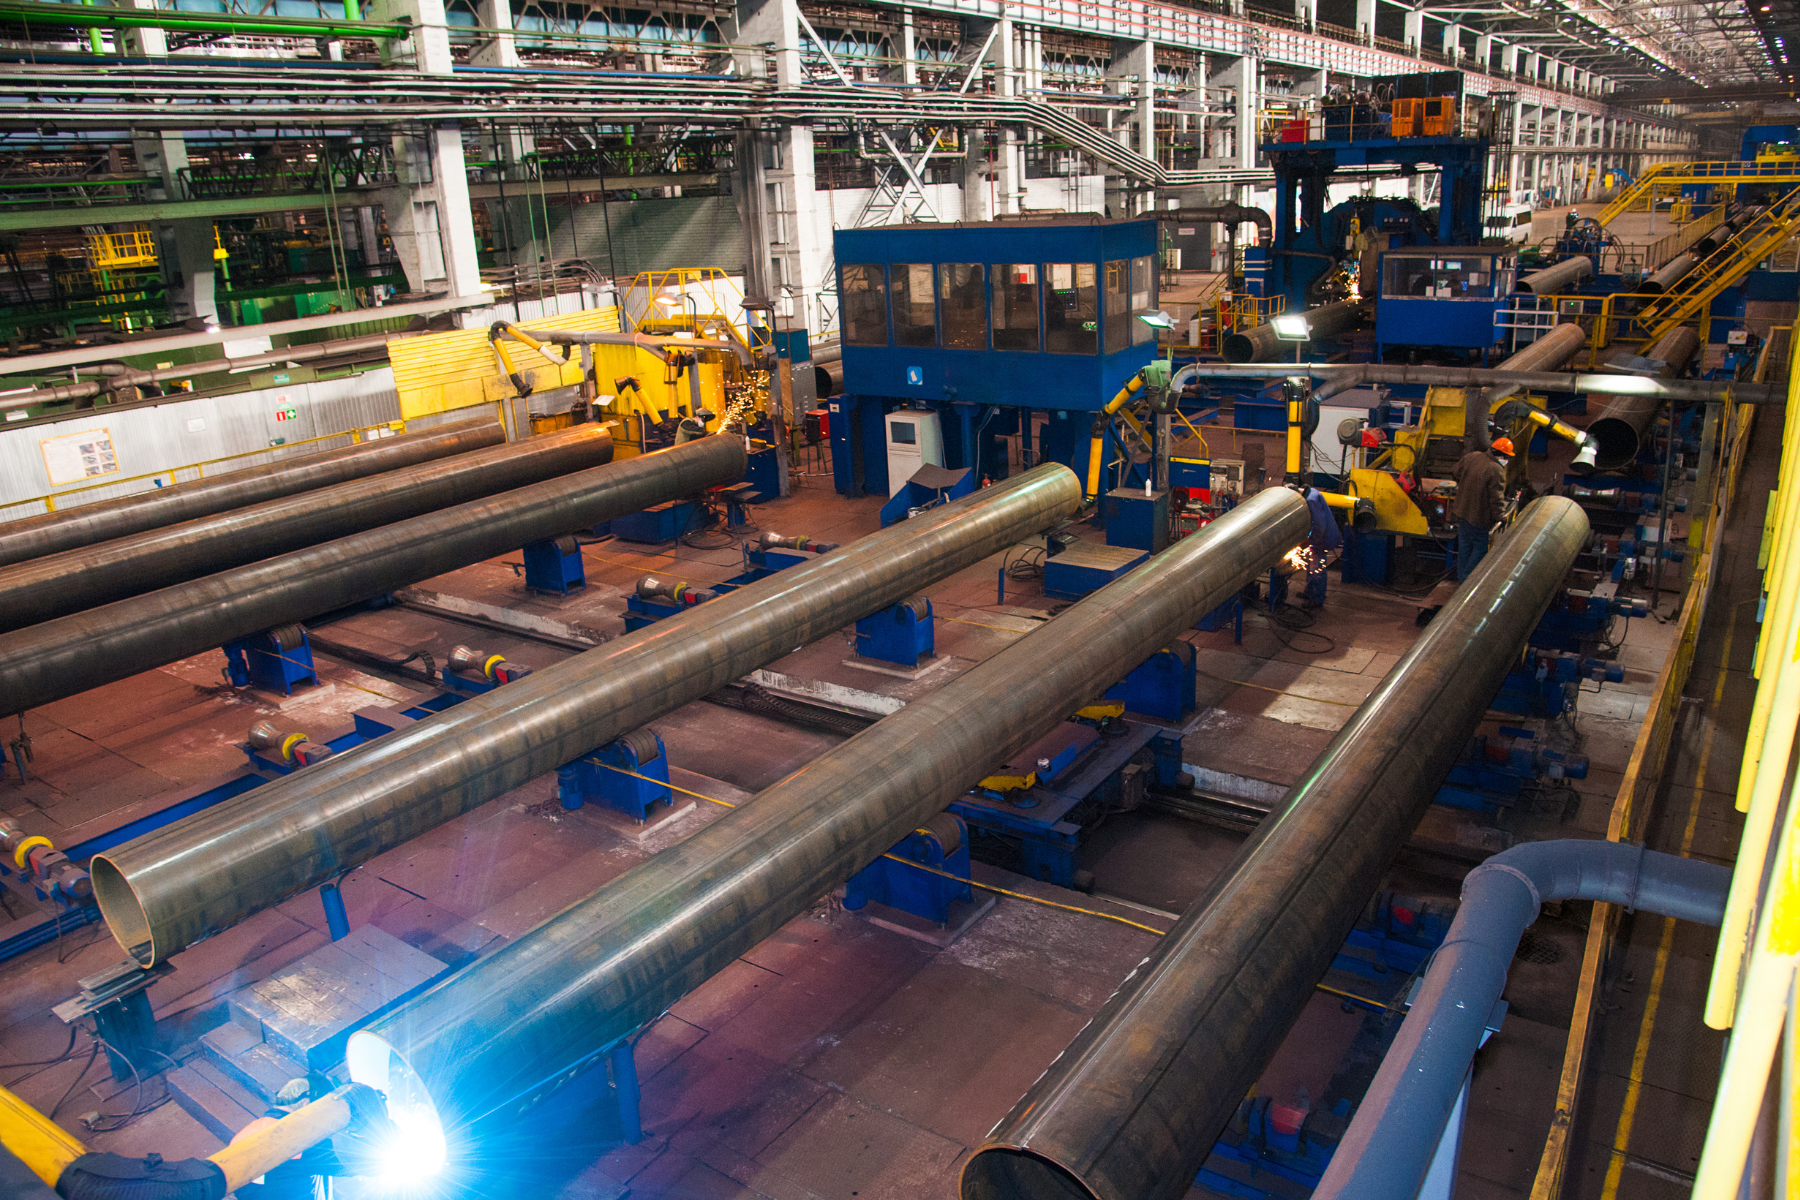
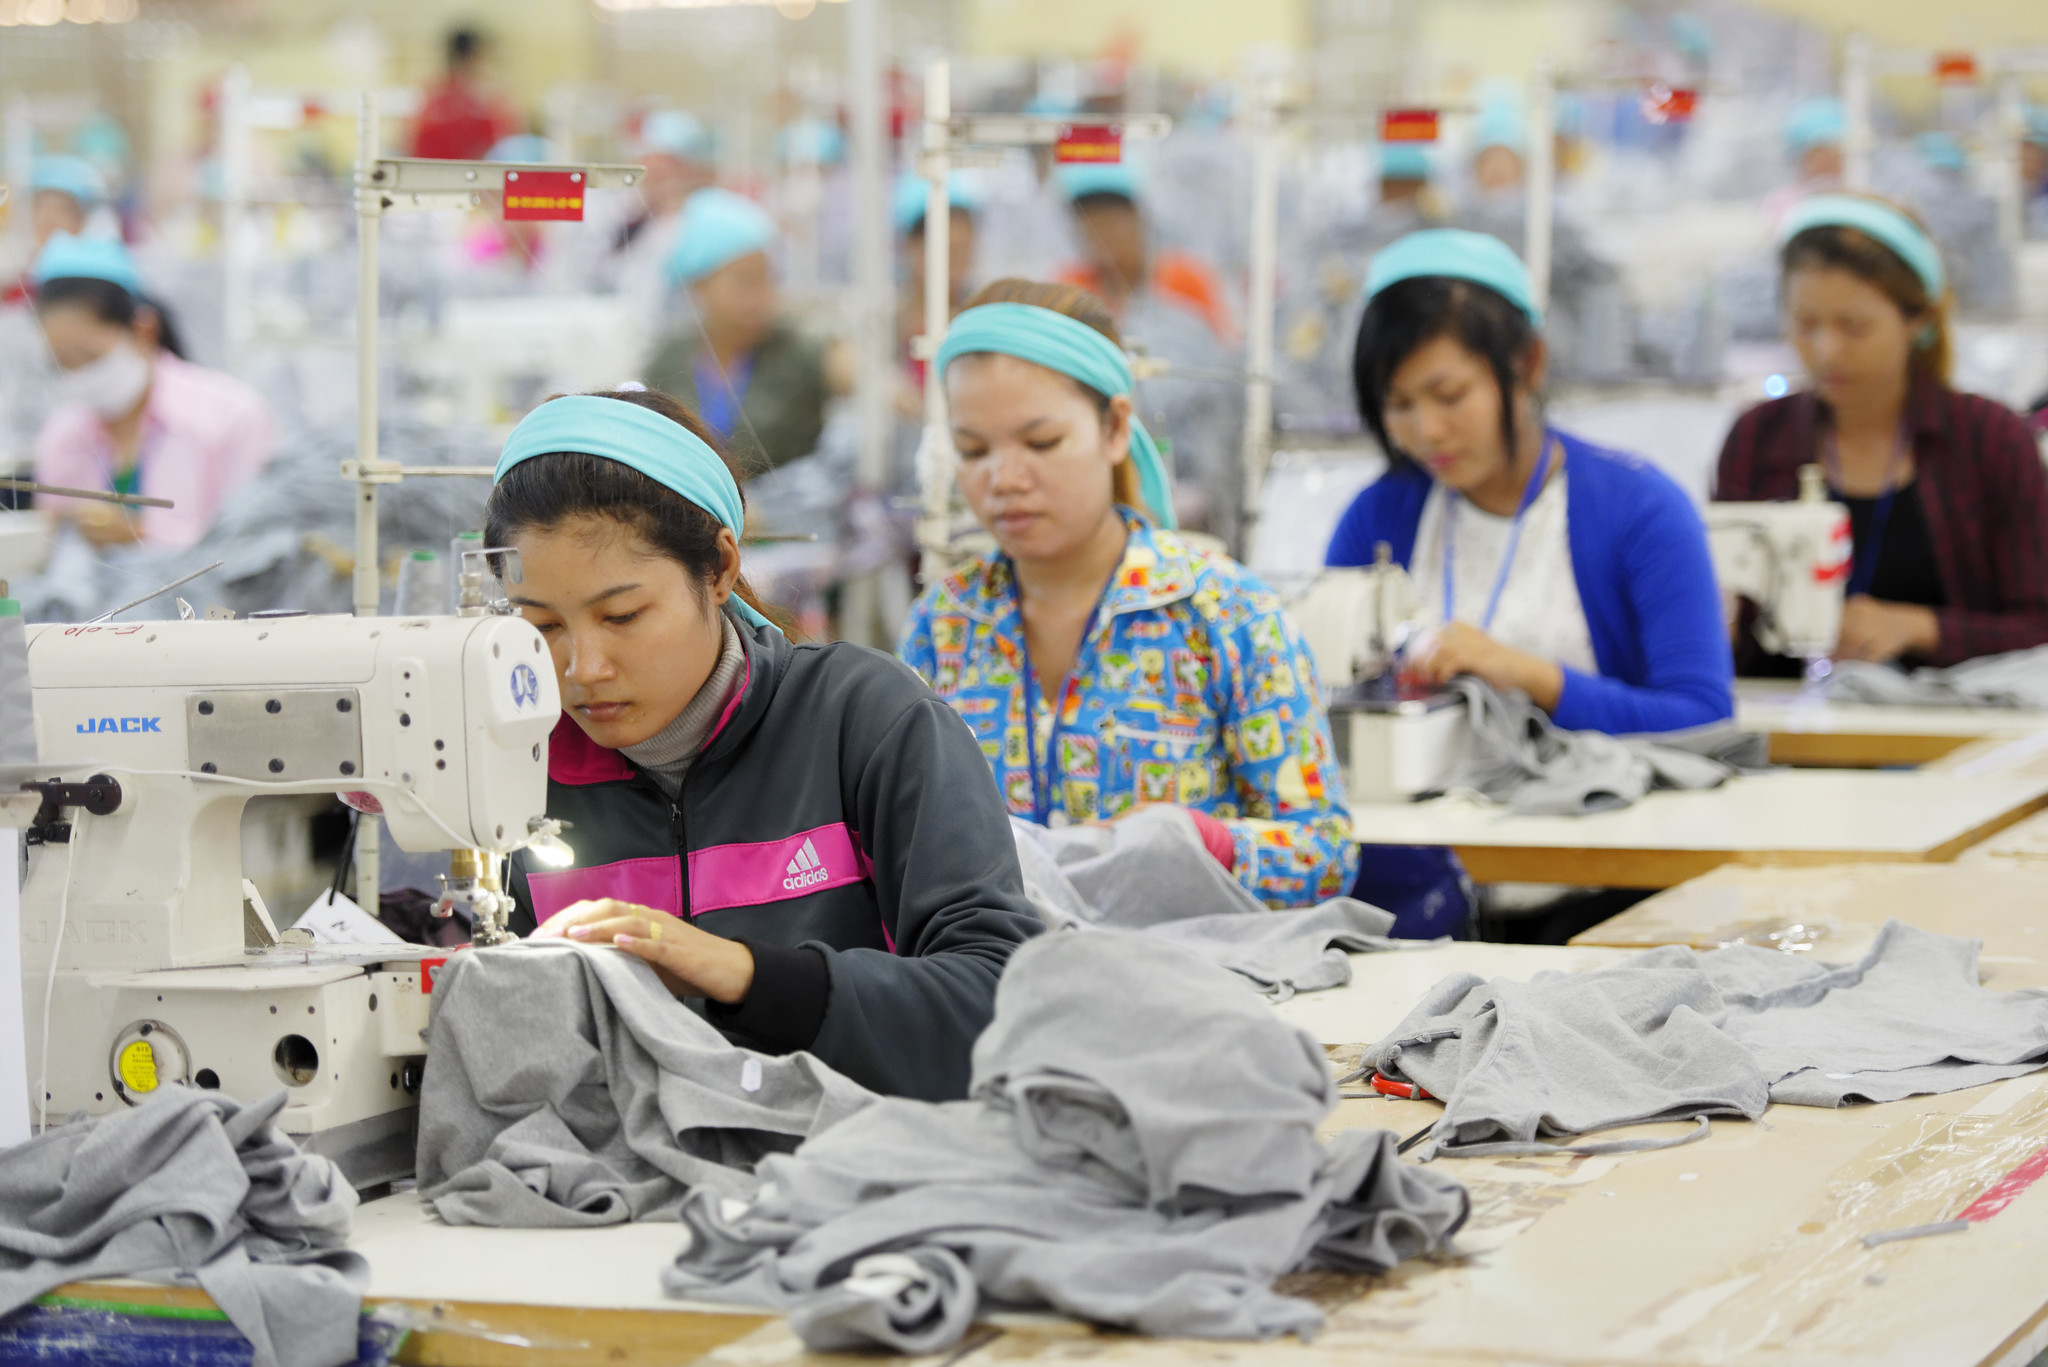
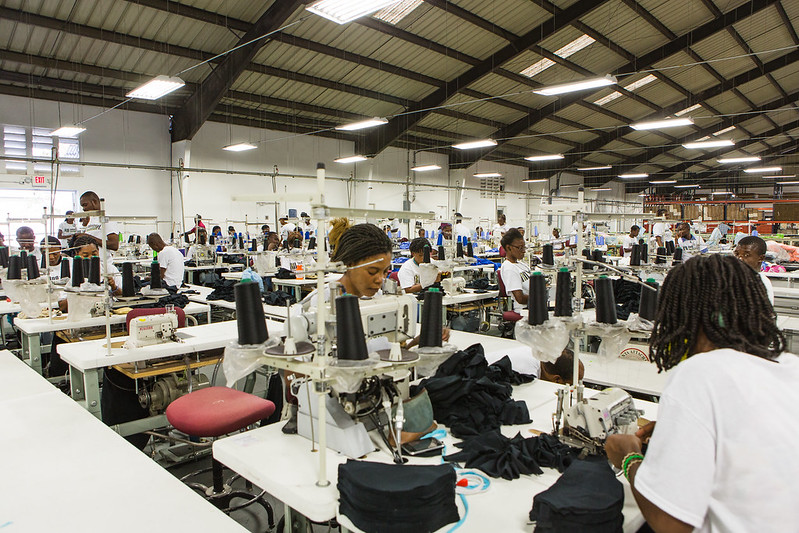
The result is that each year up to this summer, Haiti’s clothing business has been a success and a factor providing some degree of economic stability. In brief, 29 factories in three industrial parks — Port-au-Prince, Cap Haitien, and Ouanaminthe — have been shipping about 475 million articles of clothing valued at $1 billion (279 million T-shirts, placing Haiti 6th in the world as a supplier to the U.S. last year, along with 93 million of the pullovers and sweaters, 730,000 track suits, 36 million pieces of women’s and girls’ underwear, 2 million face-masks, etc) to Americans via a 40-hour boat ride to the Port of Miami. At the individual level, these factories employ about 60,000 workers, which is about a fifth of all the formal-sector wage-paying jobs in Haiti. These start at a minimum wage of about $2000 per year (as against a national per capita income around $1,650 before this year’s crises). On the “macro” scale, clothing exports account for 6.8% of Haiti’s $20 billion GDP,** a figure roughly comparable in American terms to the Bureau of Economic Analysis’ combined figures for the U.S. agricultural, entertainment, automotive, air freight, and energy industries.
The clothing factories are pretty durable, equipped with their own generators and security services. After the 2010 earthquake, for example, they reopened in hours. But two of the three parks are closed; last month gangs began blocking factory-to-port roads, depriving the factories of fabric, fuels, or replacement parts, and making them unable to move finished products out to their customers. Looming up in 2025 is the statutory end to HOPE & HELP tariff waivers and TPLs. The combination of an immediate and indefinite interruption of trade, and the programs’ limited term, raises the prospect that this until-now healthy part of the Haitian economy will not recover from this crisis, and one of the ‘things that work’ will not return.
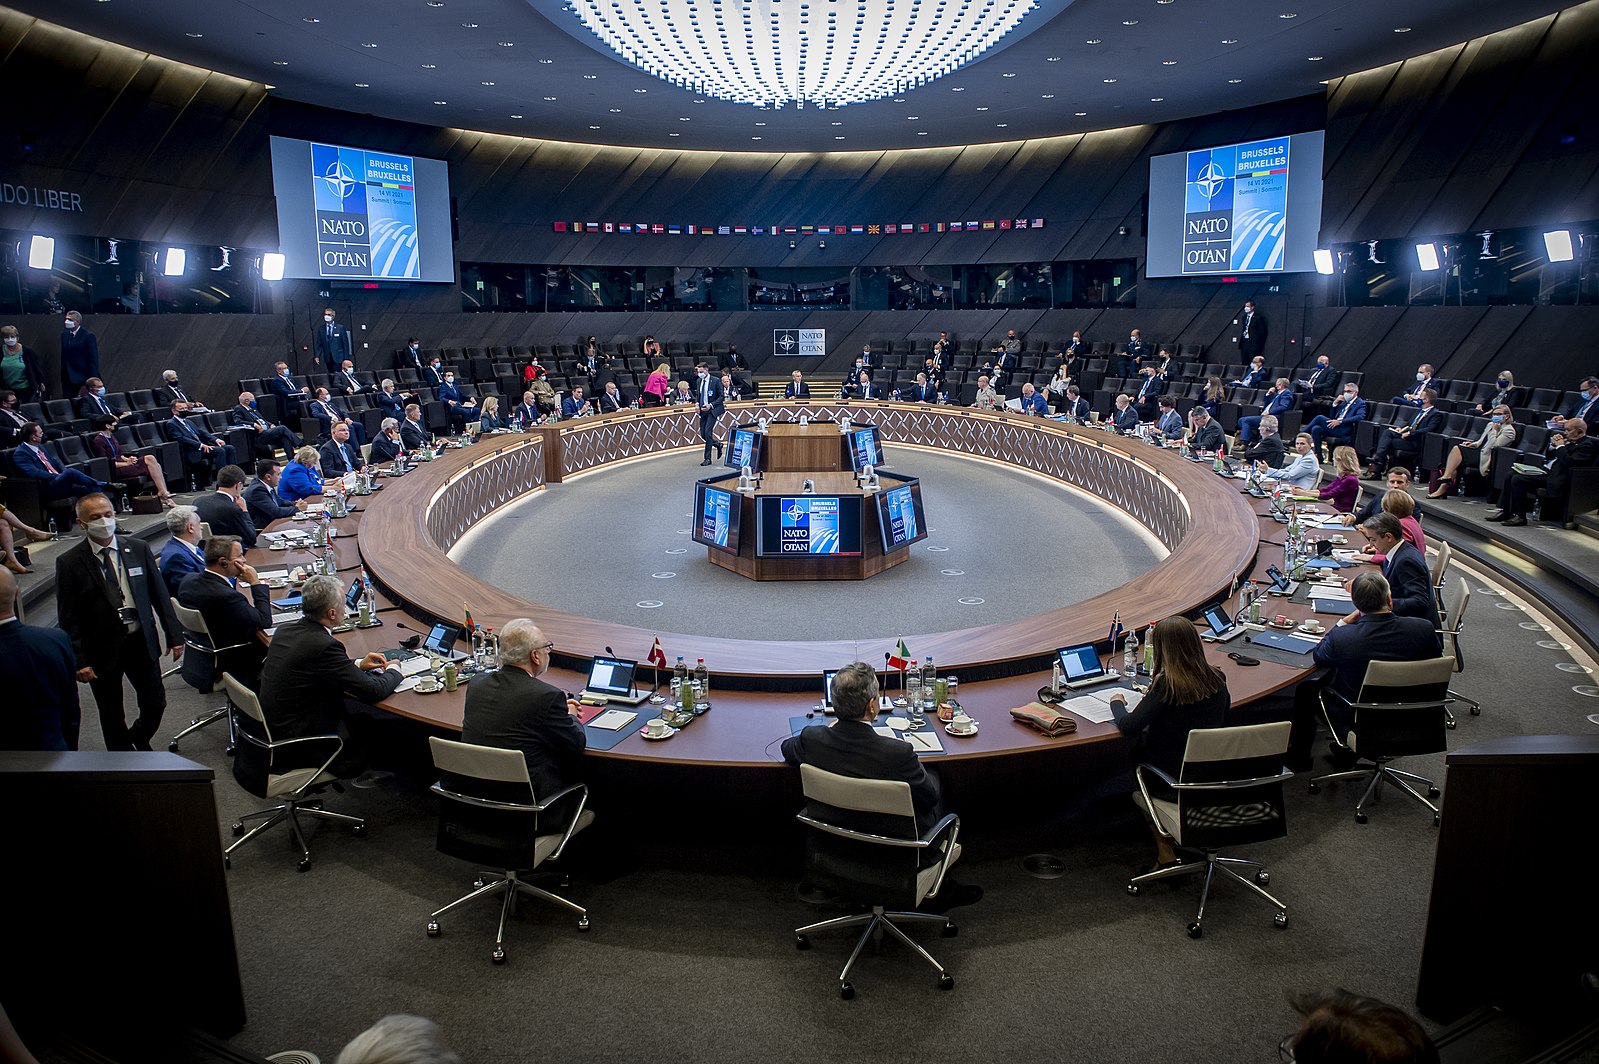
In these circumstances, whatever unpleasant security policy steps the outside world — the United Nations Security Council, the U.S./France/Brazil/Spain/Germany/EU “Core Group”, or something else — may take to stabilize the situation and restore public services will likely prove harder to sustain. Which is to say that Congress, thinking about possible trade bills this coming December, can do something very useful and valuable by extending, ideally permanently, the HOPE and HELP programs.
* Acronyms for “Haitian Hemispheric Opportunity through Partnership Encouragement” and “Haitian Economic Lift Program.”
** Using a 2021 World Bank estimate; link below. Take this figure as a well-educated WB guess, given the scarcity of statistics.
FURTHER READINGS:
Perspectives:
Rep. Greg Meeks chairs September’s0 House Foreign Affairs Committee hearing, with testimony and video.
U.N. Secretary-General Guterres proposes a military mission last Thursday.
A very careful State Department response to a reporter’s question on this — “[T]he question of a security presence is obviously an area where we are treading very carefully to make sure that we are doing the right things and not doing the things in the past that have not worked…”
… and also from State, a grim advisory for visitors to Port-au-Prince.
HOPE and HELP:
Commerce Department’s Office of Textiles and Apparel “explains” HOPE/HELP rules.
Florida Reps. Frederica Wilson and Elvira Salazar propose extending the programs.
And some context on garment-sector jobs:
The World Bank’s databases say that before this year’s crises, Haiti’s labor force totaled about 5.1 million, with an unemployment rate of 15.7%. “In this case, we would expect about 760,000 unemployed workers and about 4.3 million with wage-paying or salaried jobs.
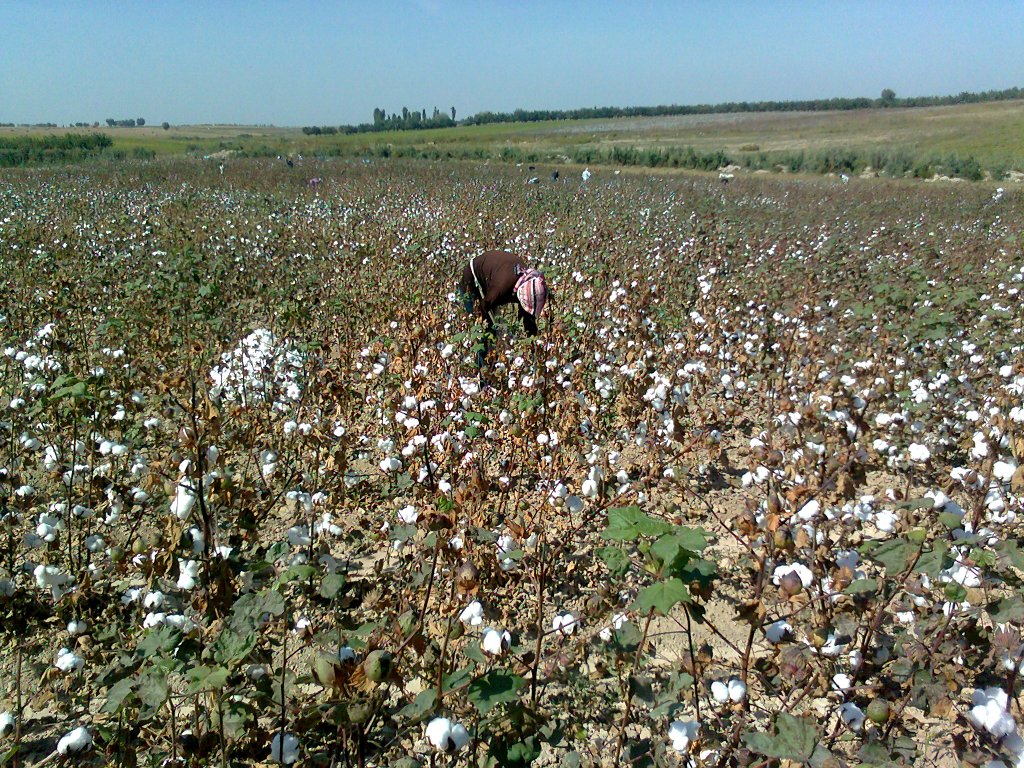
“Unemployment,” though, is a labor-market term designed for wealthy countries in which workers typically have wage-paying jobs subject to national laws and taxes. Concepts and terminology like these aren’t easily applicable to least-developed country realities. An actual on-the-ground WB report from 2021 guesses that 86% of ‘employed’ Haitian workers, or about 4 million people, were in the “informal sector” — that is, doing irregular and spottily paid work in seasonal harvesting, maid and gardening work, occasional jobs on construction sites, and so on. This implies that a total of about 500,000 wage-paying jobs, such as those in the garment industry, which offer health and safety inspection, minimum wage laws, and so on.
The World Bank’s look at Haiti’s pre-COVID, pre-“gang era” private-sector economy.
ABOUT ED
Ed Gresser is Vice President and Director for Trade and Global Markets at PPI.
Ed returns to PPI after working for the think tank from 2001-2011. He most recently served as the Assistant U.S. Trade Representative for Trade Policy and Economics at the Office of the United States Trade Representative (USTR). In this position, he led USTR’s economic research unit from 2015-2021, and chaired the 21-agency Trade Policy Staff Committee.
Ed began his career on Capitol Hill before serving USTR as Policy Advisor to USTR Charlene Barshefsky from 1998 to 2001. He then led PPI’s Trade and Global Markets Project from 2001 to 2011. After PPI, he co-founded and directed the independent think tank Progressive Economy until rejoining USTR in 2015. In 2013, the Washington International Trade Association presented him with its Lighthouse Award, awarded annually to an individual or group for significant contributions to trade policy.
Ed is the author of Freedom from Want: American Liberalism and the Global Economy (2007). He has published in a variety of journals and newspapers, and his research has been cited by leading academics and international organizations including the WTO, World Bank, and International Monetary Fund. He is a graduate of Stanford University and holds a Master’s Degree in International Affairs from Columbia Universities and a certificate from the Averell Harriman Institute for Advanced Study of the Soviet Union.
Read the full email and sign up for the Trade Fact of the Week