PPI’s Trade Fact of the Week: U.S. tariffs on cheap stainless steel spoons are 5 times higher than on sterling silver spoons 

FACT: U.S. tariffs on cheap stainless steel spoons are four times higher than tariffs on sterling silver spoons.

THE NUMBERS: U.S. tariff rates –

Sterling silver spoons:                                  3.3%
Stainless steel spoons, ≥25 cents each:       6.8%
Stainless steel spoons, <25 cents each:      14.0%

* About 20% for a spoon valued at 25 cents on imports; 25% for a spoon costing 10 cents or less. Tariff lines are 71141130 for sterling silver, 82159930 for stainless steel spoons costing less than 25 cents each, and 82159935 for spoons at or above 25 cents each.


WHAT THEY MEAN:

How is it that cheap spoons are taxed more heavily than sterling silver?

In his 1832 essay on the U.S.’ tariff law, the former Treasury Secretary Albert Gallatin — then  a 70-year-old observer and occasional commentator on policy; in earlier life a teenage immigrant from Geneva in the 1780s, a Jeffersonian-Republican politician and founder of the Ways and Means Committee in the 1790s, and Treasury Sec. for the Jefferson and Madison administrations from 1801-1814 — makes a cautious case for progressive taxation:

“Higher duties on luxuries than on articles generally, and in some cases exclusively, used by the less wealthy classes of society are justified by the propriety of laying a heavier burden on those who are the best able to bear it.”

He then glumly notes that, tariffs being an especially opaque way to raise money, and businesses and wealthy people being more able to investigate and complain about their “burdens” than the public in general and the poor in particular, the tariff laws of 1816 and 1828 had done the opposite.

“The principal commodities which have been selected for special protection, iron and all the coarser woollen articles of clothing, are as well as salt, coal, and sugar, essentially necessary to all classes of society.  The duties laid on such commodities fall therefore much more heavily, in proportion to their means, on the less wealthy classes; and it has already been seen with what singular ingenuity that on woollens has been so arranged, as to make the poor pay, in every instance, considerably more than the rich.  This your memorialists consider to be one of the most obnoxious features of the restrictive system.”

Income and payroll taxes now far exceed the $90 billion tariff system as a U.S. revenue source. But 190 years after Gallatin’s essay, the case of spoons raises some strikingly similar questions. Buyers of cheap stainless steel spoons pay about four times the tax on wealthy neighbors buying sterling, to wit:

(1) Mass-market: Low-priced stainless steel spoons, imported at prices below 25 cents each, get a 14% tariff. For readers familiar with the D.C. metro area, think middle-class and low-income families in Rockville or P.G. County, or the Salvadoran and Ethiopian restaurants along Georgia Avenue just north of the District. No such spoons seem to be made in the U.S. at all.

(2) Luxury: The tariff on sterling silver spoons is 3.3%, a bit less than a quarter of the cheap-stainless rate. Say, McLean and Georgetown, the Mayflower and the Four Seasons, downtown law firms, etc. In this sector, American companies and individuals do make sterling silver spoons, sometimes in batches and sometimes as artisanal pieces, but the prices are high enough to make tariff rates irrelevant.

(3) Mid-tier: More expensive stainless steel falls in the middle, with a 6.8% tariff.  One company in upstate New York, Sherill Industries, makes high-priced stainless steel silverware, whose prices seem to average around $4.00 per piece.

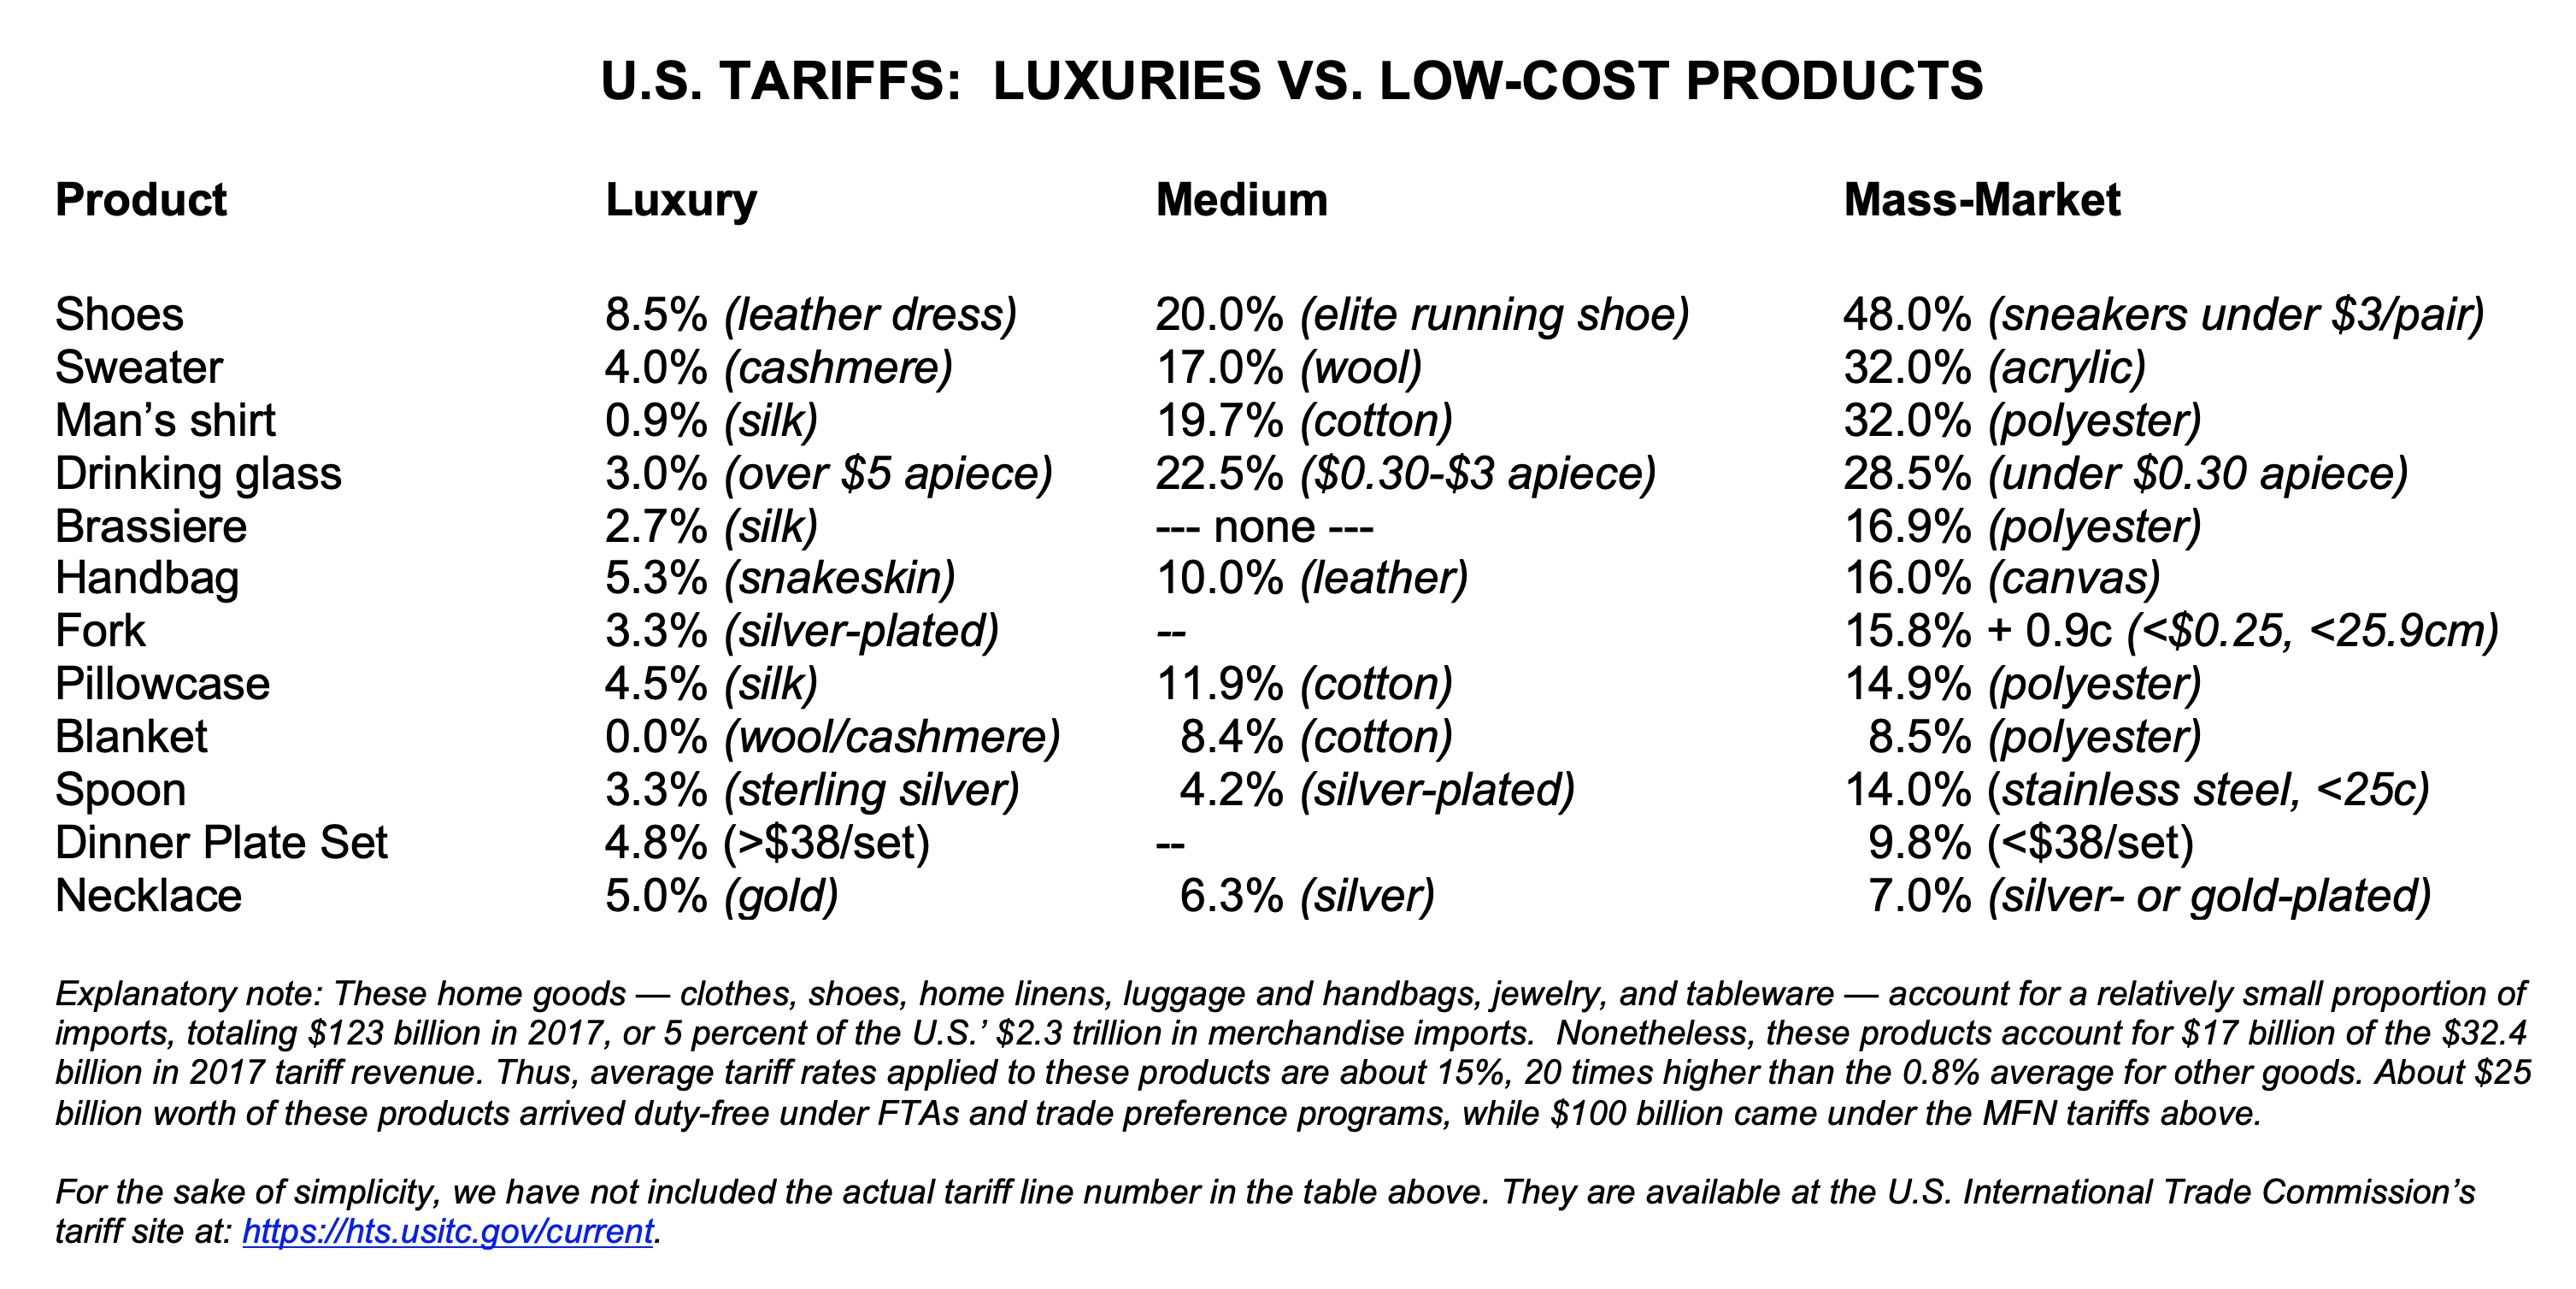
Gallatin’s term “obnoxious” is subjective, but doesn’t seem unreasonable here. Neither the cheap-spoon line (“82159930”) nor the sterling line (71141130”) appear to affect trade flows much, so in this case the tariff system is acting much more in its ‘tax’ role than its ‘trade’ role. There’s little doubt that in this case the poor are taxed considerably more than the rich, and the spoons case is more a typical case than a weird anomaly. An illustrative table of 12 products, drawn from PPI testimony to the International Trade Commission last year:

In this perspective, Gallatin seems to identify a structural challenge that remains powerful despite the passage of nineteen decades. Perhaps especially in tariffs as opposed to more transparent income or sales taxes, low-income people often don’t know when they are being taxed and aren’t in a position to ask for lighter burdens.  And in the political system, most tariff analysis relates to trade policy rather than the role of tariffs in taxation; Gallatin’s Ways and Means Committee, in fact, appears not to have held a hearing on the tax implications of tariff policy since 1974. So with little knowledge about strange phenomena like the differential rates on stainless steel and sterling even among policymakers, policies rarely get critical examination and “the less wealthy classes” seem to wind up carrying the heavier burdens.


FURTHER READING:

Analysis then and now:

Frederick Taussig’s State Papers and Speeches on the Tariff collection (1892), featuring Gallatin’s 1832 essay along with other 18th- and 19th-century trade policy luminaries (Alexander Hamilton, Daniel Webster, and the now-obscure Robert Walker, who was James K. Polk’s Treasury Secretary in the 1840s).

Economists Miguel Acosta and Lydia Cox trace the low-tariffs/luxury vs. high-tariff/mass-market skew of the U.S. tariff system back to agreements of the 1930s and 1940s.

PPI’s Ed Gresser looks at consumer goods tariff inequities in 2022 testimony to the International Trade Commission.

Tariff schedule:

The Harmonized Tariff Schedule; see Chapter 71, heading 7114 for sterling silver and other precious-metal “silverware,” and Chapter 81, heading 8215 for “base metal.”

And a summary of the 11,414 current U.S. tariff lines – how many “duty-free,” how many covered by tariffs, how many the various Free Trade Agreements waive.

And via the St. Louis Fed, a copy of the 1828 tariff law which so annoyed ex-Secretary Gallatin.

More on Gallatin:

The Treasury Department’s Albert Gallatin statue.

Nicholas Dungan’s admiring 2010 bio.

And a silverware-maker:

Liberty Tabletop in New York.


ABOUT ED

Ed Gresser is Vice President and Director for Trade and Global Markets at PPI.

Ed returns to PPI after working for the think tank from 2001-2011. He most recently served as the Assistant U.S. Trade Representative for Trade Policy and Economics at the Office of the United States Trade Representative (USTR). In this position, he led USTR’s economic research unit from 2015-2021, and chaired the 21-agency Trade Policy Staff Committee.

Ed began his career on Capitol Hill before serving USTR as Policy Advisor to USTR Charlene Barshefsky from 1998 to 2001. He then led PPI’s Trade and Global Markets Project from 2001 to 2011. After PPI, he co-founded and directed the independent think tank Progressive Economy until rejoining USTR in 2015. In 2013, the Washington International Trade Association presented him with its Lighthouse Award, awarded annually to an individual or group for significant contributions to trade policy.

Ed is the author of Freedom from Want: American Liberalism and the Global Economy (2007).  He has published in a variety of journals and newspapers, and his research has been cited by leading academics and international organizations including the WTO, World Bank, and International Monetary Fund. He is a graduate of Stanford University and holds a Master’s Degree in International Affairs from Columbia Universities and a certificate from the Averell Harriman Institute for Advanced Study of the Soviet Union.

Read the full email and sign up for the Trade Fact of the Week

PPI’s Trade Fact of the Week: Multinationals employ three out of every 10 American workers

FACT: Multinationals employ three out of every 10 American workers. 

THE NUMBERS: Employees of multinational firms (U.S.- and foreign-based) as a share of total U.S. private-sector employment –

2020          31%
2019           29%
2012           26%
2002          26%
1992           25%


WHAT THEY MEAN:

Here is J.M. Keynes, looking back from 1919 at the “globalized” world of the 1910s, from the perspective of a wealthy (male) Londoner:

“[For] the middle and upper classes, life offered, at a low cost and with the least trouble, conveniences, comforts, and amenities beyond the compass of the richest and most powerful monarchs of other ages. The inhabitant of London could order by telephone, sipping his morning tea in bed, the various products of the whole earth, in such quantity as he might see fit, and reasonably expect their early delivery upon his doorstep; he could at the same moment and by the same means adventure his wealth in the natural resources and new enterprises of any quarter of the world, and share, without exertion or even trouble, in their prospective fruits and advantages; or he could decide to couple the security of his fortunes with the good faith of the townspeople of any substantial municipality in any continent that fancy or information might recommend.”

Taking up his themes of easy and uninterrupted flows of investment and trade a century later, with some employment focus as against Keynes’ investor-and-consumer viewpoint–

The U.N. Conference on Trade and Development’s annual “World Investment Report”, reports that annual cross-border “foreign direct investment” flows have varied between $1 trillion and $2 trillion over the last decade, with the U.S. in most years both the largest source and recipient. Last year was a typical example, with the U.S. receiving $367 billion of the worldwide $1.6 trillion in total inbound FDI flows, and sending out $404 billion.

Reporting each year on these flows’ real-world manifestations, the Commerce Department’s Bureau of Economic Analysis publishes figures on international businesses’ employment, investment stocks, employment, R&D, payrolls, and so forth in the United States and abroad. Their most recent editions cover the year 2020 and find U.S. “affiliates” of foreign-based firms employing 8.6 million workers, and U.S.-based firms with overseas operations employing 28.4 million people in the U.S. (along with 14 million overseas). Together, then, internationally operating businesses employed 37 million private-sector workers, or 31% of the COVID-depressed 120 million total. Two bits of perspective on this:

(1) Economic role: The “multinational’ firms — both U.S. “parents” and foreign “affiliates” — are particularly employers in manufacturing (10 million of 12.2 million), retail (10 million of 17 million, and information industry (2.0 million of 2.7 million).  They are also very prominent in private-sector science, together accounting for $430 billion of 2020’s $717 billion in U.S. R&D spending. (U.S.-based firms did most of this at $361 billion, not counting $59 billion in overseas R&D; U.S.-based affiliates of foreign firms contributed $73 billion in U.S.-based R&D. And they account for about two-thirds of U.S. goods trade, including $1.08 trillion of 2020’s $1.66 trillion in exports, and $1.43 trillion of the $2.35 trillion in imports.

(2) Over time: At least with respect to employment, multinationals’ role in U.S. economic life has been pretty stable over the last generation. The 31% share of employment in 2020 is at the high end of BEA’s records, but this is mainly because, before COVID vaccines, employment was especially depressed in industries with fewer multinationals, such as restaurants, hotels, beauty shops, and other small services businesses. Over the last 30 years, the “multinational” share of U.S. employment has varied between 25% and 29% of private-sector workers – or, to cite a few specific years, 26% of the 121 million private-sector workers in 2012, 26% of the 108 million in 2002, and 25% of the 90 million in 1992. Over this time, U.S.-based multinationals have added about 11 million employees in the U.S. (17.5 million then, 28.4 million in 2020), while simultaneously adding 10 million overseas. International firm employment in the U.S. has grown at a slightly faster pace in percentage terms but less sharply in total numbers, rising by about 80% from 4.8 million in 1992 to 8.6 million in 2020.

Lots of money and research, the various products of the world freely available, employment rising at typically modest but positive gradations each year. All this may feel a bit reassuring, as “geopolitics” grows steadily more menacing, and international institutions fray at the edges — but it also makes Keynes’s close, as he reflects on how fragile the apparent calm and stability of his own recent past were, especially unsettling:

“[H]e [the hypothetical upper-middle class Londoner, probably referring to himself] regarded this state of affairs as normal, certain, and permanent, except in the direction of further improvement, and any deviation from it as aberrant, scandalous, and avoidable. The projects and politics of militarism and imperialism, of racial and cultural rivalries, of monopolies, restrictions, and exclusion, which were to play the serpent to this paradise, were little more than the amusements of his daily newspaper, and appeared to exercise almost no influence at all on the ordinary course of social and economic life.”


FURTHER READING:

More from BEA: 

U.S.-based multinationals.

… and earlier reports on American multinationals 2004-2021, with a link to an archive dating back to 1982.

International firms in the United States.

… and the counterpart set of reports on foreign investment in the United States.

International perspective: 

UNCTAD’s World Investment Report 2022.

Sources and destinations: 

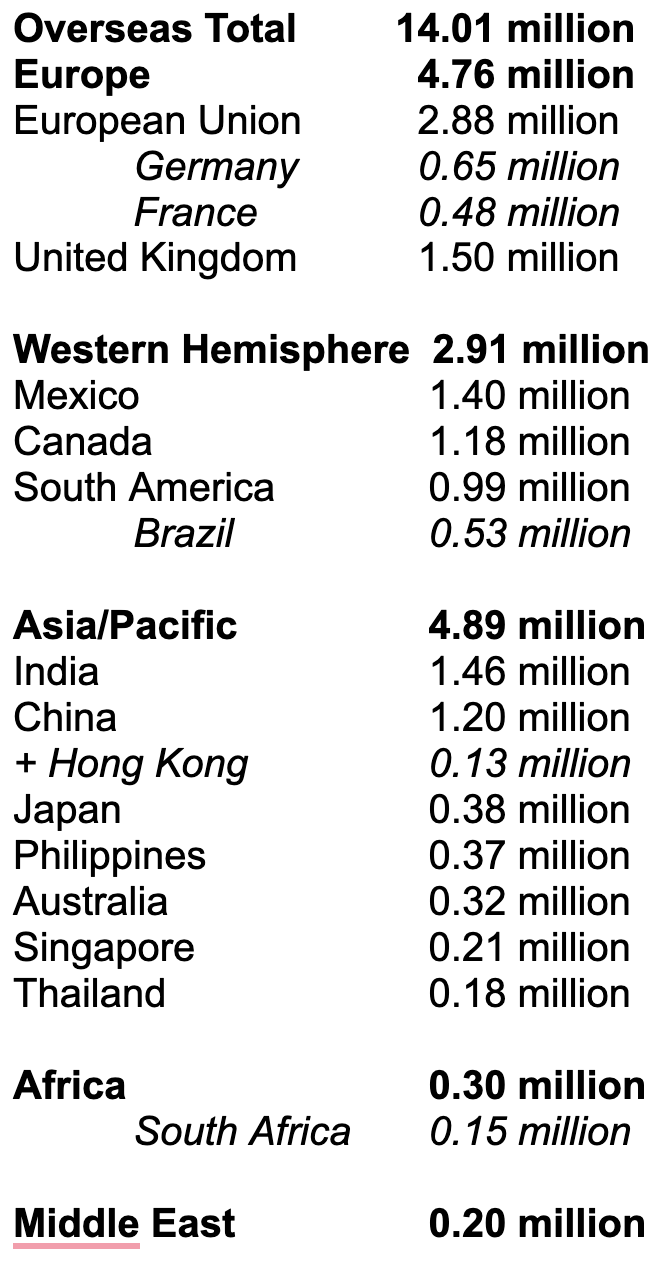
BEA’s figures look at U.S. private-sector investment abroad as well as multinationals operating here, with some detail on destinations for U.S. investment and the ownership of investment here. As both a destination and a source, Europe is the main partner and Canada is disproportionately large. By value (“investment stock”), Europe is home to $4 trillion of $6.5 trillion in U.S. FDI abroad (2020), with the U.K. at $1.0 trillion, EU members $2.7 trillion, and Switzerland, Norway, Iceland, and Turkey together $0.25 trillion. Latin American countries are at $0.25 trillion, led by Mexico at $110 billion; Asia and the Pacific are at $960 billion, topped by Singapore at $294 billion, Australia at $167 billion, and Japan and China both around $118 billion. Measured by jobs, though, U.S. firms employ about as many people in Asia as in Europe. A table of U.S. overseas employment by region:

Looking the other way, European firms are likewise the main international employers in the United States, at 5 million jobs or about 60% of the 8.6 million total. By country, U.K. firms led at 1.2 million, followed by Japanese at just above 1 million, Canadians just below, Germans at 885,000, French at 740,000, and Dutch at 569,000. Japanese firms employed a bit more than 1 million Americans, second only to the Brits; Canadians just a bit less at 940,000. Chinese firms, though receiving much attention and publicity, were modest employers of Americans at 153,000; Mexicans were at 89,000, and Indians 73,000.

And the ghost at the banquet: 

Keynes’ The Economic Consequences of the Peace (1919).


ABOUT ED

Ed Gresser is Vice President and Director for Trade and Global Markets at PPI.

Ed returns to PPI after working for the think tank from 2001-2011. He most recently served as the Assistant U.S. Trade Representative for Trade Policy and Economics at the Office of the United States Trade Representative (USTR). In this position, he led USTR’s economic research unit from 2015-2021, and chaired the 21-agency Trade Policy Staff Committee.

Ed began his career on Capitol Hill before serving USTR as Policy Advisor to USTR Charlene Barshefsky from 1998 to 2001. He then led PPI’s Trade and Global Markets Project from 2001 to 2011. After PPI, he co-founded and directed the independent think tank Progressive Economy until rejoining USTR in 2015. In 2013, the Washington International Trade Association presented him with its Lighthouse Award, awarded annually to an individual or group for significant contributions to trade policy.

Ed is the author of Freedom from Want: American Liberalism and the Global Economy (2007).  He has published in a variety of journals and newspapers, and his research has been cited by leading academics and international organizations including the WTO, World Bank, and International Monetary Fund. He is a graduate of Stanford University and holds a Master’s Degree in International Affairs from Columbia Universities and a certificate from the Averell Harriman Institute for Advanced Study of the Soviet Union.

Read the full email and sign up for the Trade Fact of the Week

PPI’s Trade Fact of the Week: Two-thirds of the world now has internet access

FACT: Two-thirds of the world now has internet access

THE NUMBERS: Internet users as a share of the world population – 

2022                      66%
2018                       50%
2012                       34%
2009                      25%
2002                      10%
1990                       0.05%


WHAT THEY MEAN:

The venerable International Telecommunications Union (ITU), the world’s oldest “international organization,” has been printing, telegraphing, broadcasting, and posting telecom data since its launch in 1865.* Its most recent look at the digital world, out last September, finds 5.3 billion people, or two-thirds of the world’s 8 billion population, now have internet access. Two observations on this:

(1)  This year’s 5.3 billion internet users are nearly three times the 2.0 billion ITU counted in 2010; over ten times the 0.4 billion it found in 2000; and about 1,000 times the roughly 3 million comp sci students, telecom enthusiasts, and government officials using the pre-WWW, copper-cable-based networks of 1990. In high-income countries, more than 90% of people are now online, with the exceptions (if the U.S. is a good sample) mostly infants and elderly people who don’t want service. Many of the newer users — 600 million have logged on since the COVID pandemic — are now in lower-income regions: Least-developed country use has jumped from 89 million to 407 million since 2015, and 40% of sub-Saharan African households are now online, as against 11% in 2015.

(2)  Information exchange is rising faster than user count. ITU estimated 1,230 terabits of bandwidth in use every second (Tbps) in 2022, up from 979 Tbps in 2021, and four times the 292 Tbps it found in 2017. About 40% of data exchange goes on in Asia, which accounted for 542 of the 1,230 TBps last year. Europe added 242 TBps, the Western Hemisphere (including the U.S., Canada, the Caribbean, and Latin America) 224, and the rest of the world 220.

Intellectual and cultural assessments of the rising user counts and accelerating data exchanges are always pretty subjective. Economic measurements are also often murky, but there are some useful gauges, especially with respect to the U.S.. The OECD, for example, estimates that the $25 trillion U.S. economy now includes $112 billion in annual sales of data and data-related advertising, and that data stocks are worth about $421 billion in national “wealth.” With respect to trade, the Commerce Department’s Bureau of Economic Analysis reports $89 billion in U.S. exports of information and communications services and $594 billion in digitally deliverable services in 2021 — together, more than a quarter of the $2.26 trillion in total U.S. exports.

In purely physical terms, the growth in user counts will have to slow down by the late 2020s. But the scale of information exchange can easily keep rising, since the physical capacity to carry data continues to grow both under the oceans and above the atmosphere. The glass-watchers at TeleGeography, for example, see 552 submarine cables operating in 2023, with 33 new ones scheduled to go live this year and 19 more so far in 2024. Meanwhile, satellites are handling larger shares of data flow, and 1,000 to 1,500 new ones go into orbit each year.

In ‘governance’ terms, however, questions about fraying policies and thickening cyber-borders seem to be intensifying even as the Internet accommodates more users and carries more information. Examples: steady interest among lots of governments in digital service taxation; last year’s efforts, especially from India, to end the WTO’s 24-year-old “moratorium” on tariffs for digital transmissions; and the quiet but intense ideological tug-of-war between the “internet sovereignty” concepts proposed by authoritarian governments and the “multi-stakeholder”/free flow of data views held traditionally by the U.S. and most liberal democracies, and elaborated in last year’s 61-country Declaration for the Future of the (“open, free, global, interoperable, reliable, and secure”) Internet.

* Created to deal with the questions raised by the deployment of the first telegraph cables; converted into a League of Nations organization in 1919, and a U.N.-specialized agency more recently.


FURTHER READING:

ITU’s 2023 “Facts and Figures” report on internet populations, data exchange, smartphone use, and more worldwide and by region.

OECD researchers measure the value of U.S.-held and -exchanged data.

And BEA tallies U.S. ICT and digitally deliverable services trade.

PPI on digital issues:

Chief Economist Michael Mandel reports on the high-performance U.S. digital economy post-COVID crisis (lower inflation than the rest of the economy, net gain of +1.4 million jobs or 66% of net private-sector job creation).

Jordan Shapiro on privacy.

… And Malena Dailey on the risk of overenthusiastic antitrust.

Policy:

The State Department’s Bureau of Cyberspace and Digital Policy.

… and the 61-country Declaration for the Future of the Internet, including 39 in Europe, five in the Pacific, three in Africa, one in the Middle East, and 9 in the Western Hemisphere (of which two are Caribbean, two North American, one Central American, and four South American).

… the WTO’s digital technology and trade site.

… the African Union’s continental digital strategy.

… the OECD debates digital services taxes.

… China’s White Paper on digital policy, “Jointly to Build a Community With a Shared Future in Cyberspace.”

… and perceptions of Chinese digital strategy from U.S. non-governmental analysts at Pacific Forum, via the State Department.

Sea and space:

TeleGeography’s summary of fiber-optic cable deployment.

… and its interactive cable map, with search by year of deployment, countries and landing points, etc.

… and Reuters on cable deployment, geopolitics, and U.S.-China rivalry.

SpaceFlightNow’s launch calendar for 2023.


ABOUT ED

Ed Gresser is Vice President and Director for Trade and Global Markets at PPI.

Ed returns to PPI after working for the think tank from 2001-2011. He most recently served as the Assistant U.S. Trade Representative for Trade Policy and Economics at the Office of the United States Trade Representative (USTR). In this position, he led USTR’s economic research unit from 2015-2021, and chaired the 21-agency Trade Policy Staff Committee.

Ed began his career on Capitol Hill before serving USTR as Policy Advisor to USTR Charlene Barshefsky from 1998 to 2001. He then led PPI’s Trade and Global Markets Project from 2001 to 2011. After PPI, he co-founded and directed the independent think tank Progressive Economy until rejoining USTR in 2015. In 2013, the Washington International Trade Association presented him with its Lighthouse Award, awarded annually to an individual or group for significant contributions to trade policy.

Ed is the author of Freedom from Want: American Liberalism and the Global Economy (2007).  He has published in a variety of journals and newspapers, and his research has been cited by leading academics and international organizations including the WTO, World Bank, and International Monetary Fund. He is a graduate of Stanford University and holds a Master’s Degree in International Affairs from Columbia Universities and a certificate from the Averell Harriman Institute for Advanced Study of the Soviet Union.

Read the full email and sign up for the Trade Fact of the Week

PPI’s Trade Fact of the Week: ‘Total column ozone counts’ are rising

FACT: ‘Total column ozone counts’ are rising

THE NUMBERS: World ozone-depleting substance consumption* –
1989             
1.32 million tons
2005             
0.25 million tons
2010             
0.10 million tons
2015             
0.01 million tons?
* Includes chlorofluorocarbons, hydrochlorofluorocarbons, methyl bromide, carbon tetrachloride, halons, and methyl chloroform. (Our World in Data)

WHAT THEY MEAN:

Here is a success story:

Chlorofluorocarbons, known for pronunciation’s sake as “CFCs,” are strings of carbon atoms joined with the halide elements fluorine and chlorine rather than their more common hydrogen-ion partners. First synthesized in 1928 by American refrigerator-makers, they were used worldwide as coolants and industrial solvents from the 1930s to the 1990s by manufacturers, building superintendents, food-service professionals, and home-owners, all of them unaware that CFCs react easily with ozone, and that this, in turn, could have large consequences.

Via eleventh-grade chemistry, meanwhile, ozone is a pungent form of oxygen arranged chemically as “O3,” as distinct from breathable oxygen “O2.” Floating in a “layer” 15-35 kilometers above the earth, ozone absorbs ultraviolet light and in doing so reduces the risk of skin cancer to people, cools lower-atmosphere temperatures, and facilitates photosynthesis in land plants and oceanic phytoplankton. CFCs are fairly stable molecules that float around for a long time — depending on the particular molecule, they can last from 100 to 200 years before breaking up and raining down out of the sky — and react quickly with ozone.  Thus their release from buildings and refrigerators began an era of high-atmosphere chemical reactions, which scientists predicted in the 1970s and then detected as a fall in the atmosphere’s “total column ozone” count by 1985. This eased ultraviolet light passage to the earth, with especially large effects over Antarctica where a large “hole” of missing ozone appeared in the early 1980s, first at about 5 million square km and reaching 28 million square km by 2000.

How to respond? The Montreal Protocol, a monument of Reagan-administration and international environmental diplomacy, banned the production and use of CFCs in 1987, and has since been ratified and implemented by 196 countries and territories.  Over the ensuing 35 years, production and industrial consumption of CFCs has dropped by about 100%, from 1.1 million tons in 1986 to 43,000 tons in 2005, then to a tiny 63 tons in 2010, and since then oscillating around zero.  (“About 100%” and “oscillating” because sometimes discovery and destruction of unused CFC stocks create a negative output; alternatively, sometimes destruction of old buildings inadvertently releases old “banks” of CFC-containing insulation for a small positive output.)

The “Kigali Amendment” negotiated under the Obama administration in 2016 added a ban on hydrofluorocarbons — a temporary replacement for CFCs which are less potent ozone-depleters but have strong greenhouse effects — and made the sale of the next generation of chemicals conditional on participation.  This went into effect in 2019, with Senate ratification last fall. The HFCs are supposed to be gone by 2030.

Two results of all this:

(1) CFC atmospheric concentration down: Near zero in 1920, the level of chlorine in the Antarctic stratosphere hit 2.2 parts per billion in 1980 and peaked at 4.7 parts per billion in the mid-1990s.  Since then it has been falling by 0.4% to 0.8% per year, with NOAA charts showing “CFC-11” down from 540 points per trillion to 490 ppt since the late 1990s, “CFC-12” from 270 ppt to 220 ppt, and “CFC-113” from 84 ppt to 68 ppt.  The current CFC level is about 3.5 parts per billion, and though CFCs degrade only slowly, NOAA’s projections show a return to 1980 levels by the 2070s.

(2) Ozone layer slowly recovering: As CFC levels drop, ozone levels have stabilized.  UNEP believes “total column ozone” is rising by about 1% to 3% per year, and the “ozone hole” above Antarctica now oscillates in a range between 16 million square km in 2019 and 24.5 million square km in 2022. The UN Environmental Programme’s 2022 ozone assessment tentatively projects that atmospheric ozone will return to its 1980 levels sometime around the year 2040 worldwide, and in the 2060s for the Antarctic. The reduced emissions of CFC and related gases, meanwhile, appear to have averted a rise of 0.5 to 1 degree Celsius in average global temperatures; and the Kigali Amendment is likely to prevent another 0.5-degree rise.

So altogether: With good scientific evidence, commitment by governments of quite different political outlooks, implementation by bureaucracies and businesses, and some modest temporary sacrifice for the common good, policy can achieve a lot.


FURTHER READING:

Then – 

From Ronald Reagan’s enthusiastic comments on the Montreal Protocol in April 1988:

“The Montreal protocol is a model of cooperation. It is a product of the recognition and international consensus that ozone depletion is a global problem, both in terms of its causes and its effects. The protocol is the result of an extraordinary process of scientific study, negotiations among representatives of the business and environmental communities, and of international diplomacy.  It is a monumental achievement.” 

Full text from the Reagan Library

35 years later, the U.S. Environmental Protection Agency explains ozone-depletion chemistry

And in 2016, President Obama announces the Kigali Amendment

Now –

NOAA on the state of the ozone

Nairobi-based UN Environmental Programme oversees the Montreal Protocol and explains the laws and obligations

Smithsonian Institution studies ultraviolet effects on phytoplankton (and thus on photosynthesis and a large oceanic carbon sink)

MIT analysts track down CFC banks, with up to 2.1 million tons of CFC still stored

And NASA’s ‘ozone watch’ tracks ozone density (as measured in Dobson Units) over the South Pole


ABOUT ED

Ed Gresser is Vice President and Director for Trade and Global Markets at PPI.

Ed returns to PPI after working for the think tank from 2001-2011. He most recently served as the Assistant U.S. Trade Representative for Trade Policy and Economics at the Office of the United States Trade Representative (USTR). In this position, he led USTR’s economic research unit from 2015-2021, and chaired the 21-agency Trade Policy Staff Committee.

Ed began his career on Capitol Hill before serving USTR as Policy Advisor to USTR Charlene Barshefsky from 1998 to 2001. He then led PPI’s Trade and Global Markets Project from 2001 to 2011. After PPI, he co-founded and directed the independent think tank Progressive Economy until rejoining USTR in 2015. In 2013, the Washington International Trade Association presented him with its Lighthouse Award, awarded annually to an individual or group for significant contributions to trade policy.

Ed is the author of Freedom from Want: American Liberalism and the Global Economy (2007).  He has published in a variety of journals and newspapers, and his research has been cited by leading academics and international organizations including the WTO, World Bank, and International Monetary Fund. He is a graduate of Stanford University and holds a Master’s Degree in International Affairs from Columbia Universities and a certificate from the Averell Harriman Institute for Advanced Study of the Soviet Union.

Read the full email and sign up for the Trade Fact of the Week

PPI’s Trade Fact of the Week: Southeast Asians work the longest hours

FACT: Southeast Asians work the longest hours.

THE NUMBERS: Countries with the longest and shortest known working years*

2017                 Cambodia, 2,456 hours; Germany, 1,354 hours
2000                South Korea, 2509 hours; Germany, 1,452 hours            
1980                 South Korea, 2,864 hours; Sweden, 1,517 hours
1950                 Chile, 2,678 hours             
1929                 United States, 2316 hours
1900                 France, 3,115 hours
1870                 Belgium, 3,483 hours; U.K., 2,976 hours

* Our World in Data. Note that data (a) is available for 70 countries in 2017 and fewer in earlier years, (b) covers “non-agricultural workers,” so is less dependable for countries with large rural/farming populations, and (c) applies to formal-sector workers for whom data is reported and available, and misses sometimes very large informal-sector workforces.


WHAT THEY MEAN:

The Washington Post reports on an unusual proposal from the Korean Labor Ministry:

“South Korea’s conservative government has proposed increasing the legal cap on weekly work hours from 52 to 69 … South Koreans already toil more than many of their overseas counterparts. They work an average of 1,915 hours a year, compared with 1,791 hours for Americans and 1,490 hours for the French, who have a 35-hour workweek, according to figures from the Organization for Economic Cooperation and Development. The OECD average is 1,716 hours.”

Comparisons like these are a bit fraught. The OECD, whose data covers 44 middle- and upper-income countries plus averages for the EU and the OECD membership, very responsibly warns that its “data are intended for comparisons of trends over time; they are unsuitable for comparisons of the level of average annual hours of work for a given year, because of differences in their sources and method of calculation.” Broader attempts to add low-income country data (for example the 70-country table published by Our World in Data) are even riskier, (a) low-income country statistical agencies may be less accurate; (b) coverage of informal-sector workers in low- and middle-income countries will be either much spottier than formal-sector work or nonexistent; and these surveys typically exclude farm labor, whose share of total jobs is low in high-income regions but often high in low-income countries. All these cautions noted, the available figures do suggest a couple of conclusions:

1. Southeast Asians spend the most time on the job. Our World in Data, whose figures go through 2017, reports that Cambodians — garment-workers in Phnom Penh, hotel maids and concierges around Siem Reap, truckers, and crane operators on the Phnom Penh-Sihanoukville run – spent an average of 2,456 hours on the job that year.* Also in Our World’s top six: Myanmar at 2,438 hours per year, Malaysia and Singapore at 2,238 hours each, and Bangladesh (“South Asian” by geographic convention but in the same neighborhood) at 2,232 hours.  The non-Asian representative in the longest-hour tier is Mexico, at 2,255 hours per year. ASEAN generally is a long-hour region: Thai workers rank 10th in the Our World table with 2,185 hours per year, Vietnam and the Philippines 12th and 13th, and Indonesia 19th with 2,024. To the west and north, India and Pakistan clock in at about 2,100 hours each, with China at a slightly higher 2,174 hours.

2. Europeans spend the least time on the job: Relaxed but efficient Europeans show up at the bottom-hour tiers of all three surveys.  Defying all stereotypes, Germans work the fewest hours, at 1,354 per year in Our World’s 2017 table, and 1,349 hours in OECD’s 2021 figures. This is the equivalent of 38 five-day weeks, assuming 8-hour days, with 14 weeks off. Just above the Germans come Danes, Luxembourgers, Dutch, Norwegians, Icelanders, Austrians, Swedes, and French, all working less than 1,500 hours per year.  EU workers score well on productivity figures, though, so they get a lot done in their limited office/plant/lab/shop time. Americans are pretty near a hypothetical world average (1,757 working hours by Our World’s count and 1,791 hours according to the OECD) with Japan’s 1,738 hours and Australia’s 1,731 about the same. The longest high-income work years turn up in the Baltic states and Taiwan at nearly 2,000 hours each — 30 8-hour days more than Americans — with Hong Kong’s 2,186 hours and Singapore’s 2,238 hours the high-income world’s longest working years.

3. Over time, people work less: In the very big picture, even the world’s highest work-hour totals look modest when matched against those of earlier times. The Our World database includes 11 countries whose labor ministries were able to estimate annual work hours in 1870. All reported over 3,000 hours a year on the job, with Belgium’s 3,455 hours — essentially a ten-hour day, every day with a couple of holidays and no weekends off — looking like the longest year ever measured. The U.K.’s 2,755 hours, the lowest in the 1870 records, is still 300 hours more than Cambodia’s modern estimate.  National holidays, 8-hour-day laws, overtime pay rules, and similar legal and regulatory changes brought these remarkable totals down through much of the 20th century. In the U.S.’ case, the 3,096-hour work year of 1870 fell to 2,605 hours by 1913. In 1950, 15 years after the Fair Labor Standards Act, the work year was just above 2,000 hours.

4. No clear recent pattern: Using a more relatable time frame — say, the last generation’s experience since 1990 or 2000 — no clear pattern appears. The U.S.’ total hasn’t changed much — 1,796 hours in 1990, a bump up to 1,845 in 2000, and 1,796 in 2021. On the other hand, work years have lengthened in much of Asia and parts of Latin America — up by 30 to 84 hours in India, Colombia, Cambodia, the Philippines, China, and Indonesia. Elsewhere, though, Thai workers have cut their 2500-hour year by 310 hours since 2000, Taiwanese by 190 hours, Irish by 187 hours, and Chileans and Costa Ricans by 289 and 155. And as the Korean economy has evolved from a heavy-industry center to a services-and-tech “Hallyu Wave” [link: https://www.progressivepolicy.org/blogs/ppis-trade-fact-of-the-week-squid-game-outdrew-the-world-series-this-year-nov-17-2021/], its working year has fallen by a full 600 hours: 2,677 hours in 1990, 2,509 in 2000, 2,063 in 2017, and most recently 1,909 in 2021.  This is still a bit long by high-income country standards, but represents a drop of 600 hours, or 75 8-hour days, in a single generation. Perhaps this suggests why senior Labor Ministry bureaucrats, remembering their weekend-less youth, may feel that 69 hours a week isn’t too much to ask?

* As an example, the 2,456-hour average may reflect the experience of a very limited fraction of Cambodian workers, as ILO figures show 92% of Cambodians are in informal work, and World Bank data report that 75% of Cambodians live in rural areas.  


FURTHER READING:

Data and comparisons:
OECD’s working hour data for 44 countries, the EU as a whole, and the OECD membership averages

Our World in Data with working hours per worker in 1870, 1900, 1913, 1929, 1938, and 1951 (for selected countries), and 1980-2017 for 70 countries

The Conference Board has 2021 data for 41 countries (Americas, Europe, wealthy Asia) in table 9, under “Labor Productivity and Per Capita Income Levels and the Effects of Working Hours and Labor Utilization, 2021”

And the International Labor Organization’s working-hour database

The U.S. Geological Survey’s mineral commodity statistics, covering steel, aluminum, and 130 other substantives from abrasives, aggregates, and aluminum to yttrium and zirconium, with salt, pumice through steel, aluminum, rare earth elements, cement, gold, iridium/osmium/platinum, gemstones, tin, and more.

Korea:
WP’s Andrew Jeong (subs. req.) on work-hour law in Korea

The Labor and Employment Ministry isn’t saying much (at least on its English-language page)

And PPI’s Lisa Ly looks at Squid Game, K-pop, and the “Hallyu Wave” economy

Elsewhere:
Germany’s Federal Ministry of Labor and Social Affairs regulates the shortest working year in the world

Singapore’s Ministry of Manpower (under the maternal-sounding “mom.gov.sg”) handles the wealthy world’s longest working year

Cambodia’s Labor Ministry

… and Cambodia’s Better Factories program, an ILO-launched system operating since 1999, offers independent inspection for hours, union rights, sexual harassment, and other labor rights standards for garment workers in 557 factories

The U.S.’ Department of Labor on work-hours, overtime, holidays and vacation, and more

And for those with some extra time:
Juliet Schor’s The Overworked American: The Unexpected Decline of Leisure (1993) wonders why, somewhere in the late 1970s, American workers stopped demanding more time off


ABOUT ED

Ed Gresser is Vice President and Director for Trade and Global Markets at PPI.

Ed returns to PPI after working for the think tank from 2001-2011. He most recently served as the Assistant U.S. Trade Representative for Trade Policy and Economics at the Office of the United States Trade Representative (USTR). In this position, he led USTR’s economic research unit from 2015-2021, and chaired the 21-agency Trade Policy Staff Committee.

Ed began his career on Capitol Hill before serving USTR as Policy Advisor to USTR Charlene Barshefsky from 1998 to 2001. He then led PPI’s Trade and Global Markets Project from 2001 to 2011. After PPI, he co-founded and directed the independent think tank Progressive Economy until rejoining USTR in 2015. In 2013, the Washington International Trade Association presented him with its Lighthouse Award, awarded annually to an individual or group for significant contributions to trade policy.

Ed is the author of Freedom from Want: American Liberalism and the Global Economy (2007).  He has published in a variety of journals and newspapers, and his research has been cited by leading academics and international organizations including the WTO, World Bank, and International Monetary Fund. He is a graduate of Stanford University and holds a Master’s Degree in International Affairs from Columbia Universities and a certificate from the Averell Harriman Institute for Advanced Study of the Soviet Union.

Read the full email and sign up for the Trade Fact of the Week

PPI’s Trade Fact of the Week: U.S. steel and aluminum output have changed little since 2017

FACT: U.S. steel and aluminum output have changed little since 2017.

THE NUMBERS: Steel production in the United States –

2000                                   102 million tons
2001-2010 average            95 million tons       
2011-2017 average             84 million tons
2017 total                           81.6 million tons
2018-2022 average            83 million tons
2022 total                           82 million tons (first estimate)


WHAT THEY MEAN:

A passage from the Commerce Department’s January 2018 “Section 232” report on the national security implications of steel trade argues for a tariff or global quota, on the grounds that this would (a) reduce imports, (b) thus allow U.S. mills to run at 80% capacity instead of the 74% measured in 2017, and so finally (c) secure a U.S. national security need for long-term sources of locally cast metal.  Note in particular the leap of faith in the third sentence: “If a reduction in imports can be combined with an increase in domestic steel demand, as can be reasonably expected …”:

“By reducing import penetration rates to approximately 21 percent, U.S. industry would be able to operate at 80 percent of their capacity utilization. Achieving this level of capacity utilization based on the projected 2017 import levels will require reducing imports from 36 million metric tons to about 23 million metric tons. If a reduction in imports can be combined with an increase in domestic steel demand, as can be reasonably expected [with] rising economic growth rates combined with the increased military spending and infrastructure proposals that the Trump Administration has planned, then U.S. steel mills can be expected to reach a capacity utilization level of 80 percent or greater. This increase in U.S. capacity utilization will enable U.S. steel mills to increase operations significantly in the short-term and improve the financial viability of the industry over the long-term.”

The Department eventually recommended a 25% tariff on most imported steel, and a similar 10% tariff on most imported aluminum, and received these in March 2018. The tariffs are mostly still in place (along with intense controversies between the U.S. and its allies, and at the WTO), though modified by Biden administration agreements with the U.K., EU, and Japan for duty-free imports up to a particular annual quota level.

How do the results look five years later, when compared with the report’s 2018 predictions? Useful figures come from the U.S. Geological Survey, which each year produces concise 2-page reports on mining, smelting, proven reserves, shares of world production, and other stats for 138 metals and minerals, from abrasives and aggregates to yttrium and zirconium, with salt, talc, tin, crushed rocks, gemstones, gold, rare earth elements, platinum group metals, steel, and aluminum in between. This year’s steel section, out January 31, reports the following:

(1) Output: U.S. raw steel production, at 82 million tons in 2022, was about the same as the 81.6 million tons in pre-tariff 2017, after ticking up to 87.8 million tons in 2019 and then dropped during and since the COVID pandemic. The total is more or less the same as the average output over the last decade or in the five pre-232 years.

(2) Capacity utilization: The Federal Reserve’s “FRED” database reports U.S. steel capacity utilization at 72.6% in December 2022, slightly below the 74.0% reported in December 2017. Full-year average figures were 73.5% in 2017 and 74.7% in 2022.

(3) Domestic demand: USGS’ calculates U.S. ‘apparent consumption’ of steel at 96 million tons in 2022, down a bit from 99 million tons in 2017. The 2022 figure is essentially equal to the 2007-2017 average of 95.5 million tons per year (and far below the 104 million-ton average from 1996-2006).

By these measures, the U.S. steel industry looks about the same in 2022 as it did in 2017. Thus the Commerce Department’s prediction that growth plus public policy would create “an increase in domestic demand” for steel, and long-term higher capacity utilization despite the higher prices tariffs would create, didn’t pan out. Two other measures, though, do show some changes:

(4) Trade: U.S. imports of steel were 30 million tons in 2022, well below the 42.4 million tons reported for 2017 and slightly below the 32 million-ton average from 2008 to 2017. U.S. steel exports are also down, though, from 9.6 million tons in 2017 to 8.0 million tons. In effect, since the tariffs U.S. producers have gained some market share within the United States, but lost a bit worldwide.

(5) Employment: USGS finds blast furnaces and steel mill employment down from 80,600 in 2017 to 75,000 in 2022, and foundry employment from 65,000 to 50,000. (More recent Bureau of Labor Statistics shows smaller declines, from 82,000 to 80,000 in mills and from 117,000 to 108,000 in foundries.) Either way, this isn’t a great industrial measure, since lower employment with identical output can easily reflect investment in technologies and higher productivity.

The aluminum story seems pretty similar. USGS’ aluminum survey reports 741,000 tons of primary aluminum output in 2017, rising to 1.09 million tons in 2019 and then falling back to 860,000 tons in 2022. As with steel, 2022 aluminum imports and exports were both below their 2017 levels, with imports down from 6.2 million tons in 2017 to 5.9 million tons in 2022, and exports from 1.3 million tons to 1.0 million tons. Their figure for aluminum import market share has oscillated more violently than that for steel, having risen from 33% in 2014 to 59% in pre-tariff 2017, falling to 38% in 2020 during the COVID pandemic and 41% in 2021, and then jumping back up to 54% in 2022.

In sum, imports of both metals did in fact drop after the tariffs; but the Commerce Department’s anticipation of higher output and higher capacity utilization rates didn’t materialize, and its expectation that tariffs would be consistent with rising domestic use of these metals looks a bit optimistic.


FURTHER READING:

The “Section 232” site for the Commerce Department’s Bureau of Industry and Security, with links to the 2018 reports on steel and aluminum.

… or direct to the 2018 steel report.

… and direct to the 2018 aluminum report.

FRED (“Federal Reserve Economic Data”) has steel capacity utilization trends back to 1970.

The U.S. Geological Survey’s mineral commodity statistics, covering 132 substantives from abrasives, aggregates, and aluminum to yttrium and zirconium, with salt, pumice through steel, aluminum, rare earth elements, cement, gold, iridium/osmium/platinum, gemstones, tin, and more in between.


ABOUT ED

Ed Gresser is Vice President and Director for Trade and Global Markets at PPI.

Ed returns to PPI after working for the think tank from 2001-2011. He most recently served as the Assistant U.S. Trade Representative for Trade Policy and Economics at the Office of the United States Trade Representative (USTR). In this position, he led USTR’s economic research unit from 2015-2021, and chaired the 21-agency Trade Policy Staff Committee.

Ed began his career on Capitol Hill before serving USTR as Policy Advisor to USTR Charlene Barshefsky from 1998 to 2001. He then led PPI’s Trade and Global Markets Project from 2001 to 2011. After PPI, he co-founded and directed the independent think tank Progressive Economy until rejoining USTR in 2015. In 2013, the Washington International Trade Association presented him with its Lighthouse Award, awarded annually to an individual or group for significant contributions to trade policy.

Ed is the author of Freedom from Want: American Liberalism and the Global Economy (2007).  He has published in a variety of journals and newspapers, and his research has been cited by leading academics and international organizations including the WTO, World Bank, and International Monetary Fund. He is a graduate of Stanford University and holds a Master’s Degree in International Affairs from Columbia Universities and a certificate from the Averell Harriman Institute for Advanced Study of the Soviet Union.

Read the full email and sign up for the Trade Fact of the Week

PPI’s Trade Fact of the Week: The U.S. manufacturing trade deficit has nearly doubled since 2016

FACT: The U.S. manufacturing trade deficit has nearly doubled since 2016.

THE NUMBERS: U.S. manufacturing trade deficits, nominal dollars –

2022          $1.20 trillion
2020         $0.90 trillion       
2016          $0.65 trillion
2000         $0.32 trillion


WHAT THEY MEAN:

How does the Trump-era agenda hold up six years later, when matched against its officials’ trade-balanced centered critiques of their predecessors and goals for their own program?

Each February, the U.S. Trade Representative Office puts out a report entitled “The President’s Trade Agenda,” which sets out Administration goals for the coming year. The 2017 edition cited a U.S. global trade balance statistic as proof that earlier administrations got things wrong:

“In 2000, the U.S. trade deficit in manufactured goods was $317 billion.  Last year [i.e. 2016] it was $648 billion – an increase of 100 percent.”

The next edition, in 2018, used “bilateral” trade balance with Mexico — i.e. country-to-country, subtracting the value of U.S. exports to Mexico from the value of imports from Mexico  — to claim failure for the North American Free Trade Agreement and set a goal for the renegotiated “USMCA”:

“[O]ur goods trade balance with Mexico, until 1994 characterized by reciprocal trade flows, almost immediately soured after NAFTA implementation, with a deficit of over $15 billion in 1995, and over $71 billion by 2017. … USTR has set as its primary objective for these renegotiations – to improve the U.S. trade balance and reduce the trade deficit with the NAFTA countries.”

How does this hold up six years later? Before turning to the bleakly comical answers, an econ. note and a couple of stat. correctives:

(1) Standard Econ 101 equations show that a country’s trade balance always matches the difference between its savings and its investment. Since the mid-1970s, Americans have been investing more than we save; ergo, trade deficits. The orthodox view is that while very high trade deficits can arouse alarm as indicators of unsustainable booms, the appropriate response is fiscal contraction and long-term measures to raise savings rates (and contrariwise, expansion and higher consumer purchasing in surplus countries).  One corollary of this is that trade policy measures like tariffs or FTAs won’t much affect overall balances, and shouldn’t really be judged on a balance basis.  A second is that a program like the Trump administration’s — business tax cuts which will (barring some offsetting rise in family or corporate savings) lower the national savings rate and possibly raise investment, plus higher government spending which will (barring some offsetting collapse of private-sector investment) raise national investment rates will naturally create a higher trade deficit. (Or lower surplus for countries in surplus.) The Trump administration’s evident hypothesis was that this basic equation is in error, and a combination of tariffs and negotiated purchasing commitments, rules of origin, efforts of will, and so forth, would force the plus and minus signs to change.

(2) Statistically, the best way to compare balances across time (and especially over decades) is to look at “trade balance relative to GDP,” rather than “nominal” dollar totals which don’t account for inflation or the scale of trade relative to the economy.  By this measure, the U.S. trade deficit has averaged 2.7% of GDP since 1982, with lows of 0.5% in 1991 and 1992 and highs of 5.7% in 2005 and 2006. The 2016 level was 2.7% of GDP, exactly the 40-year average and a bit below the 3.7% of GDP of 2000 and the 3.0% of GDP in 1987.

(3) Less consequentially, U.S. goods trade with Mexico might be termed “characterized by balanced trade” across the entire 1970-1990 stretch of time, but oscillated with growth trends and energy prices from a surplus (from a U.S. perspective) in the 1970s, to deficits from 1982 through 1990, and then briefly surplus during the Mexican boom/U.S. recession in 1991-1993.

These points duly noted, here are the 2022 figures analogous to those in the 2017 and 2018 President’s Trade Agenda reports:

Overall and manufacturing balances: The largest measurement of trade balance is the (exports of goods + services) – (imports of goods and services). At 2.7% of GDP ($480 billion) in 2016, this reached 3.0% of GDP ($845 billion) in 2021, and 3.8% of GDP ($948 billion) in 2022. The manufacturing deficit was $892 billion in 2020, $1.06 trillion in 2021, and $1.20 trillion in 2022. Thus it nearly doubled the $648 billion nominal-dollar figure cited as evidence of debacle in 2017.

Bilateral balances: The U.S.-Mexico goods trade balance with Mexico, two years into the USMCA, was -$120 billion in 2022, nearly double the 2017 figure used to illustrate the need to renegotiate the NAFTA. The balance with Canada, a $16 billion deficit in 2017, was $80 billion in deficit as of 2022.  USMCA may well have some advantages over the NAFTA — new digital material, labor, and environmental coverage, and so on – but with respect to balance the Trump negotiators look to have over-reached.  Even the China goods deficit, at $383 billion in 2022, was well above the pre-“301” tariff of $347 billion of 2017.

In sum, not quite what the policies’ authors predicted, and a bit of vindication for the economists who (a) thought use of trade balance as a success-meter was a mistake in general, and (b) based on policy and growth trends, predicted an outcome a lot like the one that actually happened.

* As above, this should be adjusted for inflation and so doesn’t quite double the 2016 figure.


FURTHER READING:

The Trump administration’s 2017 Executive Order on “Omnibus Report on Significant Trade Deficits” asked the U.S. Trade Representative Office and the Commerce Department to write up a report on trade balances with most major U.S. trading partners.  This was never released:

Data:

The Census Bureau’s U.S. monthly trade data

… and imports, exports, and bilateral balances for the U.S. with individual countries, back to the mid-1980s

… and for the big picture, U.S. worldwide annual exports, imports, and balances from 1960-2022 on one convenient page

As noted above, a better way to put trade flows and balances in context is relative to GDP. A quick run-down of imports, exports, and balances in 2016 and 2022, with 2000 and peak-deficit year 2006 added for context.

What Happened?

Why the upward turn since 2016?  Tax policy is the logical suspect.  Three of four big upward ratchets in U.S. trade deficits since the 1970s followed tax-cut bills: one in 1981, another in 2001, and the third in 2017. Bills of this sort typically bring somewhat higher government deficits (“dissavings”), which mean an overall drop in national savings unless offset by higher family or business saving. All else equal, by virtue of the “savings-investment = trade balance” identity, trade deficits rise.

The main balance effects of the Trump-era tariffs are likely (a) shifting some of the overall U.S. deficit from China to Vietnam, Mexico, and some other mid-income countries, and (b) also probably, though less certainly, concentrating the deficit more in manufacturing than had been the case before 2017.  Trump-era tariffs on steel, aluminum, and Chinese goods fall heavily on industrial inputs — metals, auto parts, electrical converters, etc. — and require U.S. manufacturers and farmers to absorb extra costs. The likely result is some marginal loss of competitiveness for exporters trying to sell to foreign buyers and for firms competing against imports at home, pushing a larger share of the overall U.S. deficit into manufacturing, reducing the erstwhile agricultural surplus, and accelerating the shift of energy from deficit to surplus.

The Two Reports

The 2017 President’s Trade Agenda.

… and the 2018 followup (with an extraordinary claim that the 2017 tax bill “has the potential to reduce the U.S. trade deficit by reducing artificial profit shifting”).


ABOUT ED

Ed Gresser is Vice President and Director for Trade and Global Markets at PPI.

Ed returns to PPI after working for the think tank from 2001-2011. He most recently served as the Assistant U.S. Trade Representative for Trade Policy and Economics at the Office of the United States Trade Representative (USTR). In this position, he led USTR’s economic research unit from 2015-2021, and chaired the 21-agency Trade Policy Staff Committee.

Ed began his career on Capitol Hill before serving USTR as Policy Advisor to USTR Charlene Barshefsky from 1998 to 2001. He then led PPI’s Trade and Global Markets Project from 2001 to 2011. After PPI, he co-founded and directed the independent think tank Progressive Economy until rejoining USTR in 2015. In 2013, the Washington International Trade Association presented him with its Lighthouse Award, awarded annually to an individual or group for significant contributions to trade policy.

Ed is the author of Freedom from Want: American Liberalism and the Global Economy (2007).  He has published in a variety of journals and newspapers, and his research has been cited by leading academics and international organizations including the WTO, World Bank, and International Monetary Fund. He is a graduate of Stanford University and holds a Master’s Degree in International Affairs from Columbia Universities and a certificate from the Averell Harriman Institute for Advanced Study of the Soviet Union.

Read the full email and sign up for the Trade Fact of the Week

PPI’s Trade Fact of the Week: Currency trading is the largest market ever

FACT: Currency trading is the largest market ever.

THE NUMBERS: Annual currency trading –

2022                     $2,739 trillion
2020                    $2,402 trillion
2013                      $1,956 trillion
2010                     $1,460 trillion
2001                       $452 trillion
1992                        $265 trillion
1970                            $6 trillion

WHAT THEY MEAN:

Two human things are measured in quadrillions. One is energy — about 640 quadrillion annually burnt “BTUs” heat the world’s homes, propel its ships and planes, run its server banks, and water its gardens. The other is money. The Bank of International Settlements’ most recent Triennial Survey (out last December) says that governments, businesses, banks, tourists, and computerized trading programs exchanged $7.5 trillion in currency daily, or $2.739 quadrillion over the year. With all the zeroes, this is “$2,739,000,000,000,000.” Some particulars:

Scale and rate of growth: Annual currency turnover was a modest $6 trillion exchanged mostly for purposes of tourism, debt repayments, and import/export trade (as had been standard practice since the invention of money in the Lydia kingdom in present-day Turkey) just before the abandonment of the gold-based “Bretton Woods” system in 1971. The contemporary ‘floating exchange’ which replaced Bretton Woods, after an interval of some confusion, launched precisely fifty years ago, on March 1, 1973, and has since become the largest market of any sort in human history. Annual currency trading reached $500 trillion in the early 2000s; hit the $1 quadrillion mark in 2008, and reached $2 quadrillion — mainly for hedging and futures markets rather than more traditional purposes — in 2017 or 2018. Assuming no gigantic upheaval in global finance, current trends suggest $4 quadrillion by 2030.

Currencies: U.S. dollars figured in 88.6% of all world currency exchanges in 2022. This is a bit less than the 89.9% rate of 2001, but more than the 84.9% of 2010. The dollar’s use in currency exchange has been pretty stable over the past 20 years, as has that of the euro and yen. (Euro: 32% of transactions in 2001, 30% in 2022; yen: 15% and 17%). Speculation about the Chinese yuan’s rising role remains, well, speculative: Used in 0.5% of exchanges in 2007, the yuan now appears in 1.6% of transactions in 2022 — rising, but about equal to use of the Mexican peso and well below the Aussie dollar.

Trading sites: Having lost its role as reserve-currency issuer in the 1930s, the U.K. found a new one as the central forex trading site and holds it still. City of London banks and firms handle 38% of world currency trades, or about $1 quadrillion worth each year.  New York ranks second with 19%; Singapore, Hong Kong, Tokyo, and Switzerland follow at about 9%, 7%, 4%, and 3% respectively. BiS speculates that Brexit may have slightly reduced the British share of currency trade, with some shift to the United States and Singapore.

To put this in context, blithely ignoring differences between exchanges, value-added output, asset wealth, and so on: $2.7 quadrillion per year is (a) 6 times the estimated $450 trillion value of total world privately held wealth in the forms of real estate, stocks, money, physical possessions, and other assets; (b) 26 times the $104 trillion world GDP of 2022; (c) 100 times the $25 trillion in 2022 goods and services exports, and (c) 400 times the $7 trillion in actually existing physical coins and bills. As to whether this gigantic roar of hedging and futures-trading very significantly raises real-world growth rates or improves global economic efficiency: research appears insufficient.


FURTHER READING:

BIS’ 2022 Triennial Survey on the $2.7 quadrillion annual/$7.5 trillion daily foreign exchange market

In practical terms, over the last six years the currency markets have worked to raise the value of the dollar vis-à-vis other currencies. Some IMF staff thoughts on the implications

And a similar view from currency scholar Jeffrey Frankel

While Barry Eichengreen looks at the geography of currency trading, and the advantage digital technologies and fiber-optic cables may have given to the City of London

Some reference points: 

A comparative table: Forex vs. wealth, vs. stocks, vs. GDP, vs. trade, etc.* All figures are for 2022:

Annual currency trading:                                                 $2.739 quadrillion

Total privately held world wealth:                                      $464 trillion

Global public & private debt:                                              $235 trillion

World GDP:                                                                           $104 trillion

Total world stock market capitalization                               $93 trillion

Total world stock trading                                                       $61 trillion

Total world goods/services exports:                                    $28 trillion

U.S. GDP                                                                                  $25 trillion

NYSE market capitalization:                                                  $22 trillion

U.S. “M1”**                                                                              $20 trillion

All world tax revenue for governments                                $14 trillion

World currency reserves                                                        $13 trillion

All the money (physical coins & bills) in the world             ~$7 trillion

U.S. currency printed annually                                             $0.3 trillion

*  BIS for currency trading; Credit Suisse for world wealth; IMF for world GDP, world debt, and world currency reserves; Federal Reserve for currency in circulation and U.S. annual currency printing; World Bank for world stock trading and tax revenue, NYSE for market cap.
** M1 includes all U.S. currency, money held in bank accounts and CDs, etc. See here.

How much is “all the money in the world”?

Private wealth: Credit Suisse estimates world household wealth in the form of homes, stock portfolios, condos, bank accounts, land, and so on — at $464 trillion for 2022. This is a bit more than double the $221 trillion of 2012, in nominal terms. No estimates are available for government assets (navies, buildings, national parks, etc.), but “all the money in the world” by this definition might be near $1,000,000,000,000,000.

Government reserves: Governments’ “wealth” may be unknown, but in terms of actual ‘money’ they now hold about $12.8 trillion in reserves. As with currency trading (but not quite as much, and not quite so certainly) most of their holdings are, metaphorically, a big pile of dollars.  Dollars make up $6.44 trillion of the $10.77 trillion the IMF identifies by currency type — 60% of the total, slightly below 62% for 2012 and noticeably less than the 71% in 2000. Euros account for 20%, and the yen and sterling 5% each. The IMF’s financial reserve data.

Circulating money: The Federal Reserve reports that about $2.3 trillion in actual U.S. paper and metal coins is currently in wallets, bank vaults, cash registers, safes, mason jars, and so on.

Some players:

The U.K.’s Financial Conduct Authority regulates the City of London, the world’s largest currency-exchange center.

The U.S. Treasury Department’s semi-annual currency trading reports on currency values and potential manipulations.

And the Treasury Department monitors dollar exchange rates.

And some history:

Currency was the invention of an anonymous fellow early in the 7th century B.C., most likely in the Kingdom of Lydia in modern-day Turkey, home to semi-legendary King Croesus — and quickly copied by neighboring Greece and Persia. A look at the first coins, with a mini-bio of Croesus and some lumpy-looking early Lydian efforts (made of electrum, a mix of gold and silver) stamped with pictures of lions.

The “money-changers” of the Gospels were a consequence of these innovations six centuries later. For a small fee, they swapped Roman, Greek, and Persian coins carried by out-of-town pilgrims for half-shekel coins minted in Jerusalem and Tyre, with exchange rates depending on the quantities of precious metal contained in the coins, enabling pilgrims to pay the modest tax needed to finance Temple operations, and pay for food, shelter, and shopping during their stay. The account in Matthew.

And the U.S. Mint today.


ABOUT ED

Ed Gresser is Vice President and Director for Trade and Global Markets at PPI.

Ed returns to PPI after working for the think tank from 2001-2011. He most recently served as the Assistant U.S. Trade Representative for Trade Policy and Economics at the Office of the United States Trade Representative (USTR). In this position, he led USTR’s economic research unit from 2015-2021, and chaired the 21-agency Trade Policy Staff Committee.

Ed began his career on Capitol Hill before serving USTR as Policy Advisor to USTR Charlene Barshefsky from 1998 to 2001. He then led PPI’s Trade and Global Markets Project from 2001 to 2011. After PPI, he co-founded and directed the independent think tank Progressive Economy until rejoining USTR in 2015. In 2013, the Washington International Trade Association presented him with its Lighthouse Award, awarded annually to an individual or group for significant contributions to trade policy.

Ed is the author of Freedom from Want: American Liberalism and the Global Economy (2007).  He has published in a variety of journals and newspapers, and his research has been cited by leading academics and international organizations including the WTO, World Bank, and International Monetary Fund. He is a graduate of Stanford University and holds a Master’s Degree in International Affairs from Columbia Universities and a certificate from the Averell Harriman Institute for Advanced Study of the Soviet Union.

Read the full email and sign up for the Trade Fact of the Week

PPI’s Trade Fact of the Week: The U.S. Generalized System of Preferences program has been expired for more than two years

FACT: The U.S. Generalized System of Preferences program has been expired for more than two years.

THE NUMBERS: Sample GSP imports from Pacific Island countries, 2020* –

1,835 tons of oilcake from Papua New Guinea
540 tons of Fijian ginger (candied and sushi-grade)
312 tons of Solomon Islands canned tuna
292 tons of Tonga yams
133 tons of Samoan taro root from Samoa
3 tons of Fijian incense

* Last year GSP benefits were in effect


WHAT THEY MEAN:

A case study in one approach to U.S. government policymaking: Here is PPI Vice President Ed Gresser, testifying on Pacific Islands policy yesterday at the U.S. International Trade Commission (ITC):

“A next-generation approach to GSP, or more broadly to trade preferences, could set goals including: help Pacific Island countries diversify their economies and attract investment in labor-intensive industries through more extensive or better use of preferences; support regional economic integration, intra-Pacific Island trade flows and joint trade policy development; encourage sustainable forestry, mining, and fisheries; work closely with U.S. allies such as Australia and New Zealand; and address logistical costs and marketing opportunities as well as tariff policy.”

By way of background: (1) The Biden administration’s “Pacific Strategy” document, released after the U.S.-Pacific Islands summit last September, notes that the U.S. devoted less than sufficient attention to this part of the world in recent decades and promises a battery of climate and sustainable fisheries programs, newly opened embassies in Tonga and the Solomon Islands, aid and technical support, and new trade and financial policy ideas. (2) Following up on this a week later, U.S. Trade Representative Ambassador Katherine Tai asked the ITC for an in-depth look at “potential impediments to and opportunities for increased trade flows between the United States and the Pacific Islands, with an emphasis on barriers Pacific Islands may face exporting to the United States,” and in particular, whether the 49-year-old Generalized System of Preferences (“GSP” for short) could provide more help or whether some other approach might be preferable. The ITC then (3) solicits comments and holds a public hearing, and will report back to her this fall.

Four months into this, PPI’s contribution to this focuses on GSP, a tariff waiver program Gresser oversaw as a government official from 2015 to 2021. Dating to 1974, GSP is the largest and oldest U.S. “trade preference” program, removing tariffs on about 3,500 of the U.S.’ 11,000 “tariff lines” for 119 eligible low- and middle-income countries and territories. These include 13 Pacific Island states, in the range from large and low-income Papua New Guinea through small and middle-class Fiji, to very small islands such as Tonga, Samoa, Cook Islands, and Tuvalu. The idea is that the tariff waivers can help such countries offset the scale and speed larger producers offer, and so encourage their economic and trade diversification and development. Participating countries need to meet 15 eligibility criteria, on cooperation against terrorism, labor standards, intellectual property, expropriation, reasonable access to markets for U.S. exporters, and other issues.

The largest GSP imports are things like jewelry, electrical equipment, luggage, and other mid-range manufactures from middle-income countries such as Lebanon, Georgia, Thailand, or the Philippines; the Pacific Island states, though, mainly use it for farm products and food. The normal tariff rate for ginger, for example, is 2.4%, and the American groceries and restaurants buying the stuff have six significant overseas suppliers: Thailand at the top, along with China, Australia, South Korea, and Indonesia. Despite a much smaller population and logistical disadvantages, Fiji ranked third in the world as a ginger supplier to the U.S. in 2020. Other examples include waivers of tariffs set at 2.3% and 6.4% for the Samoan and Tongan taro and yams, 0.45 cents/ kilo for the Papuan oilcake, and (in a special benefit available only to “least-developed” countries) 12.5% for the Solomon Islands canned tuna.

Ambassador Tai’s question is whether this system can serve the very small, and geographically distant, Pacific Island countries better than it now does. Gresser’s testimony offers five ideas, plus a sixth option of an alternative system (noted below). Ideas #2 to #5:

(2) Avoid adding too many new eligibility criteria to the system, but do add an environmental clause (must be done by Congress);
(3) Allow Pacific islands to ‘cumulate’ inputs to meet the “rules of origin” that define what it means to be ‘made in’ a GSP country (can be done by the USTR personally);
(4) More frequent visits and webinars from U.S. government personnel to explain the benefits island producers can use (an interagency option); and
(5) Provide complementary assistance, working with the existing Australia/New Zealand “PACER+” (“Pacific Agreement on Closer Economic Relations Plus”) programs to improve island logistics efficiency and reduce their high communications and financial transfer costs.  (USTR, State Department, Treasury, USAID, MCC).
(6) Develop a regional preference program comparable to those created for sub-Saharan Africa in 2000 and the Caribbean Basin (in various stages) from 1983 through 2007. This is more challenging as it would require legislation, Congressional debates, and so on. On the other hand, it has the potential for more impact, as it could give Pacific Island states some tariff waivers currently unavailable in GSP (for example clothing and canned tuna), and also be a “convening” device for more regular top-tier meetings and events.

Recommendation #1 from Gresser, however, sticks out as extremely simple, more important than options #2 to #5, and frustratingly not yet done. This is that GSP is not now providing any benefits to the Pacific Islands (or other low- and middle-income countries) at all, since the law authorizing the tariff waivers lapsed at the end of 2020 and (despite a possibly overly-large set of ideas for improving and complicating it) has been out of commission for over two years. This leaves the U.S. alone among major economies in not having such a program, not only for the Pacific Island countries but also Pakistan, Lebanon, Ecuador, Armenia, Georgia, ASEAN members Thailand, the Philippines, Indonesia, Cambodia, and so on. During this lapse, for example, while Fiji has held its third-place position as a ginger supplier since 2020, its share of U.S. imports has fallen from 29% to 21% while those of Australia, Thailand, and China have bumped up; likewise, the Tongan and Samoan taro root exports appear to have fallen by about half. So: U.S. government development of new and more effective policies sometimes involves complex questions and requires detail work, but also sometimes involves quite simple and important first steps.


FURTHER READING:

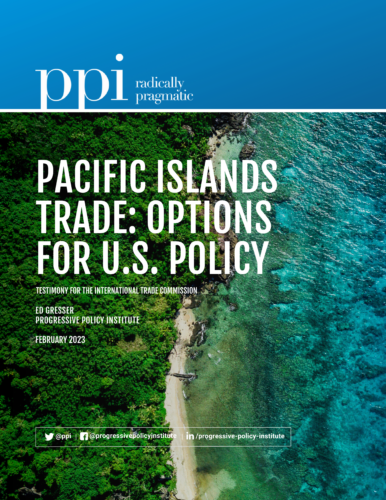
PPI’s Gresser at the ITC on Pacific Island trade and the GSP system.

And a 2022 look at the GSP system — benefits and eligibility rules, successes and limits, next steps — with some concern about over-enthusiasm for adding new eligibility rules in the 2021/22 Congressional proposals for revisions and reforms.

Case study in policy development:

The Biden Administration’s September Pacific Partnership Strategy document.

ITC outlines its study.

… or direct to Ambassador Tai’s request letter.

More perspectives:

The Pacific Islands Forum.

And the Australia/New Zealand/Pacific Islands PACER Plus agreement. 

More on GSP, with some comparisons:

The U.S. Trade Representative’s GSP Guidebook explains GSP program goals, product coverage, eligibility rules, and country participation.

The Obama administration (2016) evaluates U.S. trade preference programs (including GSP and also the African Growth and Opportunity Act and the Caribbean Basin Economic Recovery Act) and their records on poverty alleviation.

And some international comparisons:   

Japan’s Ministry of Foreign Affairs on the Japanese GSP. 

The European Union’s more complex program involving three tiers of beneficiaries, more expansive but less frequently invoked eligibility rules, and a somewhat different list of eligible products.

Australia’s “ASTP” (Australian System of Trade Preferences).

And China’s “least-developed country” tariff waiver system.


ABOUT ED

Ed Gresser is Vice President and Director for Trade and Global Markets at PPI.

Ed returns to PPI after working for the think tank from 2001-2011. He most recently served as the Assistant U.S. Trade Representative for Trade Policy and Economics at the Office of the United States Trade Representative (USTR). In this position, he led USTR’s economic research unit from 2015-2021, and chaired the 21-agency Trade Policy Staff Committee.

Ed began his career on Capitol Hill before serving USTR as Policy Advisor to USTR Charlene Barshefsky from 1998 to 2001. He then led PPI’s Trade and Global Markets Project from 2001 to 2011. After PPI, he co-founded and directed the independent think tank Progressive Economy until rejoining USTR in 2015. In 2013, the Washington International Trade Association presented him with its Lighthouse Award, awarded annually to an individual or group for significant contributions to trade policy.

Ed is the author of Freedom from Want: American Liberalism and the Global Economy (2007).  He has published in a variety of journals and newspapers, and his research has been cited by leading academics and international organizations including the WTO, World Bank, and International Monetary Fund. He is a graduate of Stanford University and holds a Master’s Degree in International Affairs from Columbia Universities and a certificate from the Averell Harriman Institute for Advanced Study of the Soviet Union.

Read the full email and sign up for the Trade Fact of the Week

PPI’s Ed Gresser Provides Testimony to International Trade Commission on U.S.-Pacific Island Trade Opportunities

Today, the Progressive Policy Institute (PPI) released a new report as part of PPI’s Ed Gressers testimony to the International Trade Commission’s (ITC) hearing on United States-Pacific Trade. Mr. Gresser spoke in support of the U.S. Trade Representative Katherine Tai’s request letter to the ITC on the Pacific Islands.

“I strongly endorse the Biden administration’s effort to rethink and upgrade U.S. policy in this region,” writes Ed Gresser in the report. “The administration’s decision to rethink Pacific Islands policy and develop more ambitious goals for these relationships is appropriate and timely. The United States has very substantial economic, human, and political assets in this part of the world, and can use them more effectively than we have in the past several decades, in the interest of both the United States and the Pacific Island countries.”

Gresser asks Congress to consider a 5-step process:

  1. Renew the Generalized System of Preferences system soon
  2. Add an environmental eligibility criterion
  3. Allow Pacific Island Forum member to “cumulate” one another’s inputs
  4. Develop a program of regular visits to the region
  5. Work closely with allies to upgrade the U.S. government’s capacity-building and technical assistance programs


He also suggests a more ambitious and difficult alternative which would require legislation, in the creation of a “regional” preference program for the Pacific Island countries similar to the Caribbean Basin Initiative and African Growth and Opportunity Act.

Read the full report and testimony here.


Ed Gresser is Vice President and Director for Trade and Global Markets at PPI. Ed returns to PPI after working for the think tank from 2001-2011. He most recently served as the Assistant U.S. Trade Representative for Trade Policy and Economics at the Office of the United States Trade Representative (USTR). Ed began his career on Capitol Hill before serving USTR as Policy Advisor to USTR Charlene Barshefsky from 1998 to 2001. He then led PPI’s Trade and Global Markets Project from 2001 to 2011. After PPI, he rejoined USTR in 2015. In 2013, the Washington International Trade Association presented him with its Lighthouse Award, awarded annually to an individual or group for significant contributions to trade policy.

The Progressive Policy Institute (PPI) is a catalyst for policy innovation and political reform based in Washington, D.C. Its mission is to create radically pragmatic ideas for moving America beyond ideological and partisan deadlock. Learn more about PPI by visiting progressivepolicy.org.

Follow PPI on Twitter: @ppi

Find an expert at PPI.

###

Media Contact: Aaron White; awhite@ppionline.org

Pacific Islands Trade: Options for U.S. Policy

A NOTE TO READERS

PPI Vice President Ed Gresser submitted this testimony to the International Trade Commission at its public hearing on “U.S.-Pacific Islands Trade and Investment: Opportunities and Impediments” on February 14, 2023. The ITC held this hearing as part of a “Section 332” investigation project requested by U.S. Trade Representative Ambassador Katherine Tai as part of the implementation of the Pacific Strategy released by the Biden Administration at the U.S.-Pacific Islands summit in September 2022.

Chairman Johanson and Commissioners:

Thank you very much for this opportunity to offer thoughts as the U.S. International Trade Commission considers America’s trade and investment relationship with the Pacific Island countries.

By way of introduction, I am Vice President of the Progressive Policy Institute (PPI), a 501(c)(3) nonprofit think tank, established in 1989 and publishing on a wide range of public policy topics. In this position, I oversee our research and publications on trade and global economy matters. I came to PPI in October 2021, after six years of service as Assistant U.S. Trade Representative for Trade Policy and Economics.

Among the Trade Policy and Economics Office’s responsibilities is administration of the Generalized System of Preferences. During my term at USTR, in October 2018, I made a GSP- focused visit to Papua New Guinea and Fiji to discuss the program with these two countries’ government, policy, and business communities, and also with representatives of the 18-member Pacific Islands Forum at the group’s headquarters in Suva. I believe I and Lauren Gamache, an ITC expert on detail to USTR at the time, were the first USTR officers to visit the region at least since the 1980s (with the exception of APEC-related travel to PNG), and perhaps much longer. My testimony will draw on this visit and subsequent research and discussions, focusing principally on the third topic Ambassador Katherine Tai raises in her request letter: Pacific Island beneficiary country use of GSP, and ways in which GSP might more effectively serve their development goals and U.S. policy.


INTRODUCTION

As a point of departure, I strongly endorse the Biden administration’s effort to rethink and upgrade U.S. policy in this region. The administration’s “Pacific Partnership Strategy,” released at the U.S.-Pacific Islands Country Summit meeting in September 2022, lays out goals, including:

“Partnering with the Pacific Islands to drive global action to combat climate change … maintaining free, open, and peaceful waterways in the Pacific in which the rights to the freedom of navigation and overflight are recognized and respected, people are prioritized, trade flows are unimpeded, and the environment is protected. … [and] ensuring that growing geopolitical competition does not undermine the sovereignty and security of the Pacific Islands, of the United States, or of our allies and partners.”

I believe these goals mesh well with those of Pacific Island governments. I was struck, for example, by how many of my interlocutors took the opportunity during conversations focused on trade and tariff issues to stress their concern about climate change and overfishing, the strong and emotional commitment many stated for liberal democratic political systems, and their close study of U.S. trends in these areas. And I feel that as the Biden administration and Congress consider future policies, the United States has many political and financial assets in these areas. For example:

  • Geographically, the Pacific Island countries may seem far away, but are near neighbors to Hawaii, American Samoa, Guam, and the Northern Marianas Islands, and U.S. policy can therefore have a disproportionate impact;
  • Economically, we are roughly at par with New Zealand and Australia as their largest export market and largest source of remittance flows; and
  • In people-to-people terms, 1.4 million Americans trace their families to Pacific islands and have accordingly significant economic and intellectual influence on many Pacific Island countries.


The Biden administration and Congress, through ideas like Representative Ed Case’s “BLUE Pacific Act,” is looking for ways to use these assets more effectively. I believe GSP, assuming Congress renews the program, can help with this task. First of all, more than half of all Pacific Island countries are GSP beneficiaries. Ambassador Katherine Tai’s September 29, 2022, request letter to the ITC on the Pacific Islands lists 22 countries and territories of concern. Thirteen of these are GSP beneficiary countries: the Cook Islands, Fiji, Kiribati, Niue, Papua New Guinea, Pitcairn, Samoa, the Solomon Islands, Tokelau, Tonga, Tuvalu, Vanuatu, and Wallis and Futuna. The Pacific Islands region thus includes over 10% of all 119 current GSP beneficiary countries, though since their sizes are small, GSP imports from this group are rather low, varying between $10 million and $20 million over the last decade. Thus, they typically make up about 2% to 5% of the roughly $500 million in U.S. imports from Pacific Island countries and 0.1% of the $20 billion in annual total GSP imports.

GSP can be more effective in supporting the Pacific Islands countries in trade and economic diversification than it has been to date. And given that the scale of U.S.-Pacific Island trade is extremely small, even a significant increase would have minimal impact on the U.S. economy or on other countries exporting to the United States. However, it should not be “oversold,” and should be part of a larger program that also includes support for trade facilitation and logistical efficiency, lower-cost financial flows, and digital linkages in the region and with the United States. This is because while a tariff preference program on its own can create useful pricing advantages for small-country producers, it also has limits, and these are especially clear in the Pacific Island region:

(a) A tariff preference is only useful for products where tariff rates are above zero. Most Pacific Island country exports are natural resources and fishery products, which are already mostly duty-free under MFN tariffs in the United States, and tropical agriculture goods where tariffs are low.

(b) A tariff preference is most effective in high-tariff products, and many high-tariff products (e.g. clothing and canned tuna) are excluded from the U.S. GSP system as import-sensitive.

(c) Experience with targeted preference programs such as the Caribbean Basin Initiative and African Growth and Opportunity Act show that tariff benefits have only limited ability to offset geographical disadvantages and high transport costs.

So GSP or an alternative regional preference program will be most effective if accompanied by support for improved logistics, training in marketing of products in areas of Pacific Island comparative advantage, reduction of U.S.-Pacific Island and intra-Pacific communications and financial costs, and other measures.


BACKGROUND: PACIFIC ISLANDS GEOGRAPHY AND TRADE

Geographically, the South Pacific’s roughly 3,000 islands spread over an expanse of water as large as Asia, Europe, and North America combined. They combine to form 14 independent countries, three French overseas territories, one U.S. state, three U.S. insular territories, and three autonomous territories associated with Australia and New Zealand. Together they are home to about 11.5 million people, including about 9 million in Papua New Guinea, one million in Hawaii, and 1.5 million in the other 15 countries and territories combined. Their populations are very small (apart from Papua New Guinea), in a range from 10,000 to 900,000. And with the exception of Fiji, their economies are simple ones resting on small-scale agriculture, fisheries, tourism, and, in a few cases, logging and mining.

To review their trade profiles briefly:


OVERALL TRADE SUMMARY

First, while the Pacific Island countries’ trade volumes are low in comparison to those of larger countries, the islands are relatively trade-dependent. The World Bank’s estimate of their “trade share of GDP” has ranged from 80% to 100% over the past decade, a figure about double the 50% for all developing countries and four times the U.S.’ 25% level. This reflects in part their need to import most (and in some cases all) of their fuel, machinery, and marine technologies, but Pacific Island country exports are also quite large, typically around 40% of GDP.

Second, their exports are concentrated (with the exception of Fiji’s) in fishery products and natural resource goods. Major exports include canned and fresh tuna, tropical timber, mining products such as gold and copper, coconut, and primary agricultural goods ranging from chocolate and vanilla to taro, sweet potatoes, and cassava.

Third, their trade costs are high and their “connectivity” is low. A recent UNCTAD/World Bank/Pacific Islands Forum report (2021) shows the region is less advanced than others in implementing WTO Trade Facilitation Agreement measures such as the early release of shipments, special treatment for perishable goods, and electronic payment of customs duties and fees.

With these overall points as the background status quo, the U.S. is a major market for most Pacific Island countries, purchasing about a quarter of their total exports. We are not, however, an overwhelmingly large market, as is the case for the Caribbean islands. Other significant Pacific Island country markets include Australia and New Zealand, Japan, China, several ASEAN countries (typically purchasing fresh fish for processing), and intra-island trade.

The Census Bureau reports about $400 to $500 million a year in imports from the Pacific Islands, as against a range of $550 million to $1.25 billion in U.S. exports to these countries over the past five years. The largest share of U.S. Pacific Island country imports is in fisheries and agriculture, with fisheries accounting for $100 million in 2021, and agriculture a slightly lower $93 million. Agricultural import trends reveal some clear comparative advantages for Pacific Island producers. For example, Fiji ranks 5th, Samoa 11th, and Tonga 15th as sources of taro; Fiji is 9th and Tonga 12th as sources of cassava; Samoa ranks 9th as a supplier of coconut oil; Papua New Guinea and French Polynesia are suppliers of natural vanilla and Papua New Guinea of high-quality coffee and cocoa beans. Drinking water from Fiji is also a large import, at $40 million. Manufactured goods are a relatively small share of Pacific Island imports, as only Fiji has a significant manufacturing sector.

An important point to note here, as Appendix 1 illustrates in statistical form, is that roughly 80% of America’s Pacific Island country imports are duty-free under MFN tariff rates. This includes most fresh and chilled fish, water, coffee, and other natural resources. Thus, GSP is not relevant to some important Pacific Island nation products, and a program intended to improve the islands’ overall export fortunes should consider ways to improve the competitiveness of MFN-zero goods, as well as look at preference options.

COUNTRY SUMMARIES

Economically and for trade policy purposes, it might be useful to divide the islands into three groups, each sharing some general characteristics:

Group 1: Fiji
Fiji is unique in the region as a middle-income, complex economy with a container port as well as air cargo capacity, light manufacturing in processed foods and garments, and a relatively large and diverse export economy. It is also a center of policymaking and intellectual debate, as the site of the Pacific Islands Forum and the main campus of the University of the South Pacific.

According to the IMF’s “Direction of Trade Statistics” database, Fiji typically exports just under $1 billion per year, with the U.S. buying 20% to 25% of the total. The leading U.S. import is drinking water, widely sold under the “Fiji Water” brand. Australia and New Zealand are together a comparably large market for Fijian goods, as are the other Pacific islands.

Fiji is a successful GSP exporter in processed foods and some farm products, especially above-quota cane sugar (1.46 cents/kg), fresh and chilled taro (2.3% MFN tariff), candied and sushi-quality ginger (2.4% MFN tariff), bakery products (4.5% MFN tariff), and a canned fish product (6.0%). GSP imports typically are $10 million and $20 million per year, or about 5% to 10% of Fiji’s exports to the United States. The plant east of Suva which accounts for much of Fiji’s GSP ginger exports employs several hundred Fijians and at the time of my visit was using Oregon-distilled vinegar and Florida-made food manufacturing machinery to produce candied and sushi-quality ginger for American and Australian customers.

Fiji also has a large fisheries industry, including a fish processing plant. Several Fijian officials inquired as to whether canned tuna, for which U.S. MFN tariffs range as high as 35%, could be made GSP-eligible. It is already eligible for least-developed countries, but has traditionally been politically sensitive when proposed for eligibility for all beneficiary countries, given the importance of a tuna cannery to employment on American Samoa. It may also be that simply adding canned tuna to GSP without some attempt to reserve the benefits for Pacific Island countries might yield little, as larger producers such as Thailand and the Philippines would be eligible as well and might be lower-cost and preferred sources.

Group 2: Samoa, Tonga, Niue, Cook Islands, Tokelau, French Polynesia

These are small island archipelagoes, often heavily reliant on fishery and vulnerable to storms and overfishing by foreign fleets. The U.S. is a large export market for this group, whose $250 million in exports to the world in 2021 included $64 million to the United States. Other markets include Australia, New Zealand, and Japan. Several of these countries are successful GSP users. Tongan exports to the U.S. typically range between $1 million and $10 million, with up to 30% covered by GSP, led by taro (2.3% MFN tariff), yams (6.4%), frozen and chilled cassava (7.9% and 4.5%), and sweet potato (6.0%). GSP likewise applies to $2.9 million of Samoa’s $9.1 million in exports to the U.S., including fruit juice (0.5 cents/liter), taro (2.3%), and several processed foods under GSP.
French Polynesia is not a GSP beneficiary country.

Group 3: Papua New Guinea, Solomon Islands, New Caledonia, Vanuatu

These countries have extensive land area and undeveloped economies — the Solomon Islands are a Least Developed Country, and Vanuatu and Papua New Guinea are slightly above the LDC line — centered on large, generally foreign-owned mining and timber resource industries.

Papua New Guinea is unusual among Pacific Island countries for its large population, roughly 9 million. By World Bank estimates, PNG is the most “rural” country in the world, with 87% of the population living in villages, and has very limited internal road and air connectivity. Papuan exports total about $7 billion per year, concentrated in mining and timber for Asian markets (accounting for about 30% of Papuan GDP). The U.S. is a relatively small market for Papuan goods, with U.S. imports concentrated in MFN-zero products such as coffee, cocoa beans, vanilla, shrimp, and artwork. One product — oilcake, a coconut residue, with an MFN tariff of 0.45 cents/kg — frequently arrives in the U.S. under GSP, I believe for scientific purposes, with a value of about $0.3 million per year.

Vanuatu and the Solomon Islands have significant fishery industries, and the Solomon Islands have a large timber industry meant for Asian markets, accounting for about 25% of GDP. The Solomon Islands, as the region’s only Least-Developed Beneficiary Country, is the only Pacific Island state able to export duty-free canned tuna (in variety subject to a 12.5% MFN tariff) under the GSP program. Vanuatu has not exported under GSP in recent years, and New Caledonia is ineligible for GSP based on per capita income.

Group 4: Kiribati, Nauru, Tuvalu, Cook Islands, Niue, Tokelau

These are very small atoll states, with extremely low populations ranging from roughly 600 for Niue to about 40,000 for Kiribati. They have simple economies, often producing fish for local consumption and sometimes coconut products. Nauru is ineligible for GSP based on per capita income levels, and Tokelau is recorded as exporting a small quantity of miscellaneous goods under GSP. Their worldwide exports combined for $270 million in 2019, with the U.S. a very modest market at about $3.5 million.

Group 5: Marshall Islands, Palau, and the Federated States of Micronesia

These are “compact” states, assigned to the United States by the U.N. as Trust Territories after the Second World War and gaining their independence in the 1980s and 1990s. They are covered by a specially designed duty-free program, including duty-free privileges for canned tuna, and are not enrolled in GSP.

Final Point on Small-Scale Trade

Finally, though this is hard to measure, Pacific Island countries may be relatively more reliant on very small-scale trade flows than most countries.

Tongan writer Epeli Hau’ofa suggested this in a 1990s essay entitled Our Sea of Islands, in which he describes the large economic role emigrant workers in Australia, New Zealand, and the United States play in island economies:

“[A]t seaports and airports throughout the Central Pacific, consignments of goods from homes abroad are unloaded as those of the homelands are loaded. Construction materials, agricultural machinery, motor vehicles, other heavy goods, and a myriad other things are sent from relatives abroad, while handicrafts, tropical fruits and root crops, dried marine creatures, kava, and other delectables are dispatched from the homelands. Although this flow of goods is generally not included in official statistics, much of the welfare of ordinary people of Oceania depends on an informal movement along ancient routes drawn in bloodlines invisible to the enforcers of the laws of confinement and regulated mobility.” 


TOWARD POLICY

How can U.S. policy generally, and GSP significantly, help the countries draw more economic and development benefit from trade? We should begin with some realism and avoid over-promising. The Pacific Island countries’ small population makes economic integration and diversification difficult, the large distances between them and the relatively high cost of transport and communications make economic integration and value-added exporting more challenging than is the case for (for example) the Caribbean, and most Pacific Island exports are already duty-free under MFN tariff rates.

However, trade preferences such as GSP can help in combination with capacity-building programs. The Biden administration has several options at different levels of ambition, ranging from more regular communication of GSP benefits to Pacific Island businesses and governments, to communication plus capacity-building in logistics, trade facilitation, and financial flows, to a regional program covering all Pacific Island country imports including those considered “import-sensitive.” Obviously, some of these are more ambitious and would require more political capital. But equally as obvious, the level of U.S. imports from the Pacific Islands is extremely low, and the real-world chance of any industrial disruption (or a significant import diversion away from other sources) emerging from even a large increase in Pacific Island imports would be minimal.

A next-generation approach to GSP or more broadly to trade preferences could set goals including:

  • Help Pacific Island countries diversify their economies and attract investment in labor-intensive industries through more extensive or better use of preferences;
  • Support regional economic integration, intra-Pacific Island trade flows and joint trade policy development;
  • Encourage sustainable forestry, mining, and fisheries;
  • Work closely with U.S. allies such as Australia and New Zealand;
  • Work on logistical costs and marketing opportunities as well as tariff policy.


With these goals in mind, I recommend five steps in the near-term, and the consideration of a sixth. The near-term options are (1) renew the GSP system soon; (2) add an environmental eligibility criterion during this renewal; (3) allow Pacific Island Forum members to “cumulate” one another’s inputs to qualify products for duty-free treatment under the GSP rule of origin; (4) develop a program of regular visits to the region to help local businesses and governments understand their potential GSP benefits; (5) work closely with Australia, New Zealand, Japan, and other allies in upgrading the U.S. government’s capacity-building and technical assistance programs in trade facilitation; sustainable fisheries, mining and forestry; financial exchanges including remittance costs. The more ambitious (6) would be to create a regional preference program drawing on experience from the Caribbean Basin initiative, which provides duty-free access for sensitive products including canned tuna and apparel, and the African Growth and Opportunity Act, which has similar broad benefits and also serves as a convening device through annual meetings with African Trade Ministers and other officials.

1. Renew GSP System

First, I hope Congress will renew the GSP system soon. In principle, some new approaches to policy can help make GSP more effective than it has been in the past. But GSP benefits expired as of January 1, 2021, and have not been reauthorized. In practice, therefore, GSP is offering no support for Pacific Island or other developing-country trade. The first step in any new approach to this region is the renewal of the program benefits.

2. Add an Environmental Criterion

Second, as part of this renewal, I would recommend adding an environmental criterion to GSP’s current list of 15 mandatory and discretionary eligibility criteria. I personally feel that the major GSP reauthorization bills in the last Congress proposed too many new criteria, and probably too strict revisions of some already in the GSP statute. This made me concerned that systematic and equitable enforcement of the criteria would become difficult, leading either to somewhat arbitrary openings of reviews, or even to an unintended wholesale expulsion of beneficiary countries from the system. I do, however, believe an environmental criterion, related to sustainable timber and mining, maritime environmental issues, and sustainable fisheries, would serve both a general good and Pacific Island nation policy goals.

Island governments and the people they represent have a high concern for the protection of fisheries and marine resources, but with very small governments their ability to impose these policies is modest. Likewise, the large timber and mining exports of some countries, amounting to 25% of GDP or more, can lead to deforestation if not managed properly and can also create incentives for corruption. A criterion can help encourage governments to give these issues priority and provide some leverage in the event that we see problems. But we should also be aware that often their resources are very small, not only in terms of finances but in terms of the number of trained lawyers, scientists, police officials, and other policy implementers a country of 100,000 people can bring to any policy problem. Therefore, the aim of eligibility criteria in the environment (or other areas) should be to encourage governments to adopt good policies and make good-faith efforts to enforce them, rather than to require enforcement levels often beyond their reach. An environmental criterion should also be complemented by capacity-building programs for Coast Guard training, fisheries management, and sustainable timber and mining industries. The Millennium Challenge Corporation is in fact working on a Compact to support the Solomon Islands on this issue.

3. Regional Cumulation

Third, assuming GSP is renewed, I recommend that the U.S. Trade Representative authorize participants in
U.S.-Pacific Island Trade and Investment Framework Agreement meetings to “cumulate” the value of inputs bought from one another to meet GSP rules of origin. This would allow any Pacific Island GSP beneficiary country to use inputs from others and count the value of these inputs towards GSP’s 35% value-added rule of origin. For example, the Solomon Islands fish cannery could export tuna caught in Vanuatuan waters under GSP, and Fiji’s bakeries could use taro root grown in Tonga.

This would at least to a modest extent encourage regional integration, a major goal of the Pacific Islands forum. Cumulation is already in place for sub-Saharan African countries enrolled in the African Growth and Opportunity Act, and members of the Caribbean Community in CBTPA and CBERA. My understanding is that this can be done through an administrative action by the U.S. Trade Representative, and I strongly recommend that she take this action for Pacific Island countries.

4. Build Awareness of U.S. Market Opportunities

Fourth, increase the frequency of visits by U.S. government economic and trade officials to ensure that island government officials and businesses understand the opportunities GSP benefits can create. As noted earlier, my own visit to Fiji was the first to any Pacific Island country other than APEC member Papua New Guinea by a USTR official in at least 40 years and perhaps in the agency’s history. Presentations on GSP issues drew extensive interest and attendance in both Suva and Port Moresby from officials, scholars, businesses, and representatives of other island governments. Since then, USTR has concluded Trade and Investment Framework Agreements with Fiji and Papua New Guinea, which have created a forum for regular government-to-government discussions on a range of topics, including GSP but also issues related to fisheries management, bilateral trade issues, WTO cooperation on fishery subsidies and electronic commerce, and other issues. It may also be valuable to include training in marketing for Pacific Island country agricultural producers and businesses, both to help them reach overseas workers and other expatriates and to take more advantage of the apparent comparative advantage they have in taro, cassava, yams, and high-value chocolate and vanilla.

5. Trade Facilitation and Remittance Costs

Fifth, recognize that most GSP tariff margins are relatively modest, ranging in the Pacific Island cases from 2.3% to 7.9%. With Pacific Island logistics and communication costs high, these preferences provide only a limited advantage. Attention to tariff matters, therefore, while valuable, should be accompanied by technical assistance that can lower the cost of trade. Here major issues would be improving maritime and air transport capacity, reducing the cost of financial remittances and telecommunications, and other measures that can help ease the Pacific Islands’ cost disadvantages in general and perhaps especially for small-scale trade among family members conducted through packages, express delivery, and similar means. In the same way, the Administration spoke in the Pacific Strategy report of considering ways to lower the cost of remittances from overseas workers to families, which would raise purchasing power and make these links less costly.

In this area, the Administration should participate in and help to build upon the extensive work done by Australia and New Zealand in supporting regional integration and trade links. PACER-Plus, for example, includes significant Australian and New Zealand support for trade infrastructure, fisheries management, and other important policy questions, and it will be far better for the United States to provide support and complementary programs than to duplicate existing work.

6. Consider a Regional Preference Program

Finally, over the medium term, the administration and Congress should consider creating a regional trade preference program for the Pacific Islands. This would be a step comparable to the Caribbean Basin Initiative, which was launched in the mid-1980s as a development program for Central America and is now the centerpiece of U.S. trade relations with the Caribbean Island countries, or the African Growth and Opportunity Act in the case of sub-Saharan Africa, though it would affect a much lower level of imports than either of these programs. Such a program could include regular trade and economic discussions at the Trade Minister or Deputy Minister level, and authorize benefits for Pacific islands in products considered more sensitive such as canned tuna and apparel. This would obviously require Congressional legislation and some considerable political investment (including an investment in time and staff work by U.S. government officials), but could also bring a significantly greater return than an upgrade of GSP alone, both in terms of helping the Pacific Island countries succeed in trade and in developing a stronger basis for larger relationships.


CONCLUSION

In sum, I believe the administration’s decision to rethink Pacific Islands policy and develop more ambitious goals for these relationships is appropriate and timely. The United States has very substantial economic, human, and political assets in this part of the world, and can use them more effectively than we have in the past several decades, in the interest of both the United States and the Pacific Island countries.

Trade policy has a useful role to play in this, both through some redesign of U.S. trade preference programs, technical assistance and capacity-building, and more frequent and substantive contacts with Pacific Island governments and the Pacific Islands Forum as a group. I support Ambassador Tai’s interest in finding ways to achieve this, and hope my testimony provides useful material as the Commission considers the request.


 

READ AND DOWNLOAD THE FULL REPORT

PPI’s Trade Fact of the Week: U.S. underwear tariffs are unfair to women 💔😡

FACT: U.S. underwear tariffs are unfair to women.

THE NUMBERS: Average U.S. tariff rates,* 2022 –

Women’s underwear      15.5%

All underwear                 14.7%

Men’s underwear            11.5%

Steel                                5.7%

All goods                        3.0%


* “Trade-weighted,” combining tariffs collected on all imports, including those under MFN tariff rates, Chinese products subject to “301” tariffs, and FTA/preference products exempted from tariffs.


WHAT THEY MEAN:

Worst Valentine’s Day surprise ever: The U.S. tariff system taxes women’s underwear more heavily than men’s. Facts follow:

1. Steel vs. Underwear: First, tariffs are fundamentally a form of taxation, and tariffs on underwear are high. A Google search this morning finds “about 144,000” uses of the phrase “steel tariffs” and “about three” (3) of the phrase “underwear tariffs.” But despite the domestic and international controversy over steel tariffs, clothing tariffs in general and underwear tariffs specifically are lots higher. In 2021, automakers, building contractors, and other metal buyers ferried 28 million tons of steel in from abroad for $44 billion, and paid the Customs Service $2.5 billion in tariffs. Thus the “average” tariff on steel came to about 5%. Buyers of clothing, meanwhile, bought 5.5 million tons of clothes for $109 billion and paid $16 billion on it, for an average of 14.5%. Underwear makes up about a tenth of clothing imports — 519,000 tons or 3.4 billion articles, at $10.1 billion last year — and brought in $1.54 billion in tariff revenue. The average underwear tariff, therefore, was 14.7%* or about three times the rate on steel.

2. Tariff Rates: Second, the U.S. tariff system taxes women’s underwear at higher rates than men’s. To dip briefly into Customs-and-trade-policy jargon, underwear tariffs are published in Chapter 61 of the Harmonized Tariff Schedule** (“Knitted or Crocheted”), headings 6107 and 6108, and in Chapter 62 (“Other than Knitted or Crocheted”) headings 6207, 6208, and 6212. Together these five sections spread out over 17 pages and include 68 separate tariff “lines,” from line “61071100,” for men’s cotton underpants and briefs, to line “62129000,” a catchall for unclassifiable and possibly exotic things. The rates in these 68 lines range from 0.9% to 23.5%, diverging mainly along lines of class and gender. Among the products with clearly comparable female and male items, (a) aristocratic silks are lightly taxed, at 2.1% for women’s panties and 0.9% for male boxers and briefs; (b) the analogous working-class polyesters are heavily taxed, at 14.9% for men and 16.0% for women; and (c) middle-class cottons are, well, in the middle, at 7.6% for women and 7.4% for men. The highest rates fall on women’s products in heading 6212 with no obvious masculine counterpart: brassieres in a range from 4.8% (silk) to 16.9% (cotton or polyester), girdles 20%, and corsets 23.5%.

3. Costs: Third, tariffs on underwear, like consumer goods tariffs generally, are eventually paid by shoppers. Since Americans buy more women’s underwear than men’s, and since it is more heavily taxed, Customs raises more money from the women’s stuff. About three quarters of the $1.54 billion in underwear tariffs last year — $1.23 billion on $7.90 billion in imports, for an average rate of 15.5% — came from women’s underwear. Men’s brought in $306 million on $2.65 billion, for an 11.5% average. Peering a bit more closely, the $1.23 billion in lingerie tariffs came from 3.28 billion separate articles — i.e., about 37 cents per piece. The $306 million on men’s products came from 1.28 billion separate articles, or about 24 cents each. Markups, domestic transport costs, sales taxes, and so forth appear to have roughly tripled the prices of clothing*** from border to cash register last year, with tariffs amplified a bit at each stage. While precise figures would vary with the price of the item, on average the tariff system appears to add about $1.10 to the cost of each women’s underwear item, and 75 cents to men’s.

4. Comparisons: In international context, the U.S.’ underwear tariff rates as an overall average are pretty typical. But the U.S. system is (a) very unusual in taxing luxuries more lightly than mass-market goods, and (b) possibly unique in taxing women’s underwear more heavily than men’s. Most tariff systems have flat rates applying to all underwear: 5% in Australia, 10% in New Zealand, 18% in Canada, 20% in Colombia, also 20% in Jamaica, 25% (with an anti-poor twist, see below) in India, 30% in Thailand, an eyebrow-raising high 45% in South Africa, and so on. The Japanese and EU tariff systems in fact have a modest pro-female tilt, as they impose lower rates — zero in the Japanese case, 6.5% in the EU — on products in the 6212 heading, such as brassieres and corsets, as against flat rates of 9% and 12% for the rest.

As to the U.S., shifting from the jargon of customs and trade to that of policy analysis and evaluation: Seriously?! Boo! Do better! 😡 😡 😡

Nonetheless, we still wish readers a happy and romantic Valentine’s Day.

* Up from 12.0% in 2017. This increase to some extent reflects the “301” tariffs on Chinese-stitched brassieres, briefs, etc. imposed in 2019, but other factors are at work as well. Both China and zero-tariff Central America have also lost market share, while MFN suppliers in Bangladesh, Vietnam, Cambodia, Indonesia, and India have gained relative to both.

** Some other clothing items show up in Chapters 42 and 48 — respectively leather and rubber products — but underwear of these types have no specific tariff line, so left out of the analysis above.

*** Clothing spending by consumers was about $400 billion last year; import value at the border $110 billion; 98% of clothing is imported.

FURTHER READING:

The U.S. International Trade Commission maintains the U.S. Harmonized Tariff Schedule. Check Chapter 61, sections 6107 and 6108, and Chapter 62, sections 6207, 6208, and 6212 for underwear.

And the ITC’s Dataweb requires a bit of HTS expertise but appears unique in the world in allowing ordinary citizens to get not only tariff rates but very detailed information on U.S. exports, U.S. imports, and tariff collection, by product and country.

Background:

Is the anti-female tilt of underwear tariffs typical of the American tariff system, or a weird anomaly? Overall, the “class” bias, in which silks and cashmeres are taxed lightly while cottons are taxed heavily and polyester and acrylics most of all, is the norm for U.S. consumer goods tariffs. The “gender” bias, in which women’s underwear attracts higher tariffs than analogous men’s goods, seems less systematic though still the rule. Asked to study these questions in 2018, ITC economists concluded the following:

“… [T]ariffs act as a flat consumption tax. Since a flat consumption tax is a regressive tax on income, tariffs fall disproportionately on the poor. Across genders, we find large differences in tariff burden. Focusing on apparel products, which were responsible for about 75% of the total tariff burden on U.S. households, we find that the majority, 66%, of the tariff burden was from women’s apparel products. In 2015, the tariff burden for U.S. households on women’s apparel was $2.77 billion more than on men’s clothing. … . This gender gap has grown about 11% in real terms between 2006 and 2016. We find that two facts are responsible for this gender gap: women spend more on apparel than men and women’s apparel faces higher tariffs than men’s.”

ITC’s look at gender and class bias in the tariff system.

PPI’s Ed Gresser on U.S. consumer goods tariffs as taxation.

And Miranda Hatch in the BYU Law Review on the tariff system and gender bias.

Around the world:

The European Union tariff system has a 12% tariff on all briefs, panties, and boxers whether cotton, silk, or polyester, and whether designated “men’s and boy’s” or “women’s and girl’s,” and a lower 6.5% on brassieres and corsets.

Japan’s is 9% on comparable things and duty-free on brassieres and corsets.

Australia is at 5% all the way through.

India has an anti-poor tilt (many items get “25% or Rs25, whichever is higher,” in practice meaning >25% rates for anything costing less than $1.25 per item, so in practice cheap goods important to low-income families will be taxed more heavily than expensive luxuries), but no divergence in men’s and women’s rates.

Canada is 18% all the way through.

And Jamaica 20%.

And some trade-and-gender links:

WTO’s Informal Working Group on Trade and Gender.

… and a nine-expert panel (“Does Trade Liberalization Have Gender’s Back?”) from last December’s.

ABOUT ED

Ed Gresser is Vice President and Director for Trade and Global Markets at PPI.

Ed returns to PPI after working for the think tank from 2001-2011. He most recently served as the Assistant U.S. Trade Representative for Trade Policy and Economics at the Office of the United States Trade Representative (USTR). In this position, he led USTR’s economic research unit from 2015-2021, and chaired the 21-agency Trade Policy Staff Committee.

Ed began his career on Capitol Hill before serving USTR as Policy Advisor to USTR Charlene Barshefsky from 1998 to 2001. He then led PPI’s Trade and Global Markets Project from 2001 to 2011. After PPI, he co-founded and directed the independent think tank Progressive Economy until rejoining USTR in 2015. In 2013, the Washington International Trade Association presented him with its Lighthouse Award, awarded annually to an individual or group for significant contributions to trade policy.

Ed is the author of Freedom from Want: American Liberalism and the Global Economy (2007).  He has published in a variety of journals and newspapers, and his research has been cited by leading academics and international organizations including the WTO, World Bank, and International Monetary Fund. He is a graduate of Stanford University and holds a Master’s Degree in International Affairs from Columbia Universities and a certificate from the Averell Harriman Institute for Advanced Study of the Soviet Union.

Read the full email and sign up for the Trade Fact of the Week

PPI on the SOTU: Trade

The U.S. needs a new driver of growth as COVID-era fiscal stimulus is set to be replaced by deficit-cutting, and the consumer boom of 2021 and early 2022 fading. Exports should fill this need, but over the past six years, the United States has lost market share abroad and exporting companies at home. Between 2016 and 2021, the U.S.’ share of world exports fell:


  • From 8.6% to 7.3% in manufacturing
  • From 10.4% to 9.4% in agriculture, and
  • From 15.2% to 12.9% in commercial services


Meanwhile, the count of U.S. exporting businesses dropped from 290,600 to 277,500.

We hope President Biden will take the State of the Union opportunity to launch an ambitious program to rebuild America’s export economy in the aftermath of the Trump administration’s retreat. This includes a return to efforts to reduce tariffs and other barriers to U.S. exports, strong support for the Ex-Im Bank’s export financing mission, and export promotion programs. American allies such as Japan, the U.K., and others have expressed hopes for closer trade and investment links to the United States, and officials such as Treasury Secretary Yellen have sketched out the outline of a “friendshoring” program that can achieve it, and there’s no better place to launch this than the SOTU.

This post is part of a series from PPI’s policy experts ahead of President Biden’s State of the Union address. Read more here

PPI’s Trade Fact of the Week: The U.S. has 13,200 fewer small/medium business exporters since 2016

FACT: The U.S. has 13,200 fewer small/medium business exporters since 2016.

THE NUMBERS: U.S. export share of GDP –

2022    11.6%

2016    11.9%

2013    13.6%


WHAT THEY MEAN:

A worried look at the American export economy this afternoon, taking as a point of departure the Bureau of Economic Analysis’ first full-year 2022 estimates for American GDP:

(1) Export share of U.S. GDP is down: BEA’s “first estimate” of GDP finds $2.98 trillion in American exports last year, in a $25.5 trillion economy. The export figure combines $2.06 trillion in “goods” (cars, oil, wheat, semiconductors, planes, beef, etc.) with $0.92 trillion in “services” (software downloads, fees for architecture and telemedicine, tourism student tuition, international air cargo earnings, etc.), and made up 11.6% of U.S. GDP. The total, though above the COVID low of 10.2%, remains noticeably below not only the mid-2010s peak (13.6% in 2012, 2013, and 2014) but the 2007-2018 average of 12.6%.

(2) U.S. share of world exports is also down: The World Trade Organization and IMF have not yet published tallies of worldwide exports for 2022. But comparing their figures for 2021 with those of 2016, the WTO’s World Trade Statistical Review report shows that in 2016, the U.S.’ share of the year’s $16.0 trillion in world goods exports was 9.1%, and the U.S.’ share of the $4.8 trillion in commercial services exports was 15.2%. In 2021, the comparable figures were 7.9% of $22.3 trillion in goods and 12.9% of $6.0 trillion in services. Sifting a little more finely, from 2016 to 2021 the American share of world manufacturing exports fell from 8.6% to 7.3%, and of agricultural exports from 10.4% to 9.4%. Or by region, the IMF’s “Direction of Trade Statistics” database reports that in 2016 American factories, farms, and mines supplied 8% of exports to Asia, 33% of exports to Latin America, and 5.3% of exports to sub-Saharan Africa, while (b) in 2021, the figures were 7%, 31%, and 5.1%.

(3) Most recent U.S. export growth in natural resources: Looking more closely at the things Americans were selling, the eleven months of Census Bureau trade data available for 2022 show that nearly half of all U.S. export growth since 2016 — about $290 billion of $610 billion, unless the December figures reveal some unexpected and drastic shift in direction — is in crude oil, natural gas, and refined petroleum. This has reordered the top tier of American exports. Where in 2016 the top five U.S. exports* were airplanes, refined oil, and automobiles, followed by auto parts and integrated circuits; and in 2022 the top five were refined petroleum products, crude oil, and natural gas — together accounting for about $380 billion of the $2.07 trillion in goods exports — with planes and cars now ranked respectively fourth and fifth.

(4) Fewer exporting businesses: And perhaps reflecting this greater concentration of exports in energy, the U.S. export community has shrunk from a mid-2010s peak of 305,000 exporting companies to 290,600 by 2016, and (again with some rebound from a Covid low in 2020), to a preliminary count of 277,500 in 2021.

What to make of this?

Dramatic terms like “inflection point” or “crisis” feel premature. The GDP share of exports is not far below the pre-pandemic level. With growth in 2021 and 2022 heavily driven by federal fiscal stimulus and the post-crisis consumer boom, some erstwhile U.S. exporters may simply have decided to concentrate on local customers for a while. And despite un-robust export figures in the second half of 2022, American manufacturers hired pretty enthusiastically and farmers got reasonably good income. Perhaps, with fiscal stimulus fading and consumers now pulling back, companies will return to exporting and the trade stats will improve in 2023.

On the other hand, perhaps not. If there isn’t yet a case for “drama” and “crisis,” one for “concern” and “guarded pessimism” seems reasonable. In this reading of the trends, policy is taking a toll. On one hand, the tariff increases in 2018 and 2019 mainly fell on industrial inputs, and so to some extent raised costs for U.S. factories and ag producers as well as eliciting foreign retaliations against U.S. exports. On the other, the trade policy environment, especially in Asia, is turning against U.S.-based farms and factories as intra-Asian tariffs fall and technical standards become more compatible through the implementation of the two big regional trade agreements CPTPP and RCEP. All grounds, at least, to look back at the trends of the last five years, and ahead to the next years, with concern.

* At HTS-4 level. Using NAICS-4 the top-five count is slightly different: aerospace, petroleum and coal products, automobiles, pharmaceuticals, and auto parts in 2016; oil and gas, petroleum and coal products, aerospace, pharmaceuticals, and basic chemicals in 2021.


Further Readings

The Bureau of Economic Analysis’ GDP database, with (among lots else) export and import totals and shares of GDP.

Census “FT-900” series has the basic monthly trade figures, complete through November with the December (and thus full-year 2022) release next Tuesday.

… and the accompanying “Historical Series” with a convenient one-page summary of annual imports, exports, and balances from 1960 through 2021, also (hopefully) to be updated for 2022 on Tuesday.

… and also from Census, the “Profile of Importing and Exporting Companies” releases a count of exporters and importers by size, with state-by-state figures, SMEs, 25 countries, sectors, etc.

World perspective:

The WTO’s World Trade Statistical Review series.

And the IMF’s Direction of Trade Statistics.

And in Asia:

ASEAN announces entry into force for the Regional Comprehensive Economic Partnership, 2021.

P.M. Fumio Kishida reviews Japan’s Asian strategy, with thoughts on the U.S. alliance, nuclear weapons, China relationship, CPTPP, and the potential economic role of the U.S.

ABOUT ED

Ed Gresser is Vice President and Director for Trade and Global Markets at PPI.

Ed returns to PPI after working for the think tank from 2001-2011. He most recently served as the Assistant U.S. Trade Representative for Trade Policy and Economics at the Office of the United States Trade Representative (USTR). In this position, he led USTR’s economic research unit from 2015-2021, and chaired the 21-agency Trade Policy Staff Committee.

Ed began his career on Capitol Hill before serving USTR as Policy Advisor to USTR Charlene Barshefsky from 1998 to 2001. He then led PPI’s Trade and Global Markets Project from 2001 to 2011. After PPI, he co-founded and directed the independent think tank Progressive Economy until rejoining USTR in 2015. In 2013, the Washington International Trade Association presented him with its Lighthouse Award, awarded annually to an individual or group for significant contributions to trade policy.

Ed is the author of Freedom from Want: American Liberalism and the Global Economy (2007).  He has published in a variety of journals and newspapers, and his research has been cited by leading academics and international organizations including the WTO, World Bank, and International Monetary Fund. He is a graduate of Stanford University and holds a Master’s Degree in International Affairs from Columbia Universities and a certificate from the Averell Harriman Institute for Advanced Study of the Soviet Union.

Read the full email and sign up for the Trade Fact of the Week

PPI’s Trade Fact of the Week: Scandinavia has the world’s highest union-membership rates

FACT: Scandinavia has the world’s highest union-membership rates.

THE NUMBERS: Labor union membership as a share of the workforce for OECD countries –

2020    15.8%

2010     17.8%

2000    20.9%


WHAT THEY MEAN:

PPI President Will Marshall, writing in 2007 for the online journal Democratic Strategist, imagines some new directions for American labor unions after 25 years of falling membership:

“[New-model unions] could help workers acquire valuable marketable skills and create “virtual hiring halls” to match them to employers. They could also provide services like portable pensions and health insurance, which would smooth workers’ transitions from job to job. And they could experiment with novel concepts like wage or mortgage insurance, which aim at keeping families’ living standards from collapsing when workers lose their jobs. … Modern labor associations could help workers bargain with their employers for a better work-family balance — for flextime, paid leave, telecommuting and part-time jobs with decent benefits. They could operate, in short, like a back-to-the-future update on the old craft unions, which were defenders of quality workmanship as well as workers’ interests.” 

Appealing though this vision may have been (and still might be), no such large-scale transition took place. Instead the trends of the ensuing 15 years looked about the same as those of the previous quarter-century. The Bureau of Labor Statistics’ first systematic survey of union membership in 1983* had reported 11.9 million private-sector workers enrolled in unions, which was 19% of that year’s 92 million private-sector workers. A decade later, in 1993, BLS found 9.6 million union members among 85.5 million private sector workers (11.2%). The 2003 release then reported 8.5 million or 8.2% of 102.6 million; the 2010 and 2015 releases, a sharp financial crisis drop to 7.1 million of 103 million workers (6.9%) and then a recovery to 7.6 million of 113.1 million (6.7%) by 2015.  The COVID pandemic brought another drop, to 7.03 million of 115.8 million private-sector workers (6.1%) in 2021. And last Thursday’s release brought the figures to 2022, with a modest rebound in total enrollment to 7.2 million private-sector union members, or 6.0% of their 120.4 million private-sector worker total. This is the lowest share noted in the BLS release archives and possibly (though not certainly, since data collection methods have changed) the lowest since the 1890s. Looking at “industrial sectors” rather than economy-wide totals, alternatively, since 1983 unionization rates have fallen from 28% to 7.8% in manufacturing, from 40% to 14.5% in transport, and from 41% to 8% in telecommunications.

How does this experience look in an international context? Is the U.S. different, or do American trends resemble those elsewhere? In one sense, labor laws differ widely and overall U.S. union membership rates are below the figures the OECD reports for most European countries. Trends over time, though, look pretty similar. The OECD’s statistics, which cover 37 upper- and middle-income country members, show an overall drop in union membership from 20.9% of workers (combining government and private-sector workers) in 2000 to 15.8% as of 2020.  I.e., a decline slightly slower than the one the BLS reports in the United States, but not a fundamentally different trend. Among individual countries, OECD figures show unionization rates dropping from 24.6% to 16.3% in Germany from 2000 to 2021; from 24.9% to 13.7% in Australia; 23.5% to 13.4% in Poland; 21.5% to 16.8% in Japan; 29.8% to 23.5% in the U.K.; and from 16.5% to 12.5% in Spain.  OECD’s Latin American members are a bit of an exception, with sharply different trends by country:  stable at about 11% in Chile, up from 14% to 20% in Costa Rica, down from 16.5% to 12.4% in Mexico and also down from 12.5% to 9.5% in Colombia.

The similarity across countries suggests that BLS’ annual U.S. releases are picking up something general about work in upper- and middle-income countries. Perhaps, as Marshall was suggesting 16 years ago, this reflects a broad shift away from long careers in single companies and seniority-based promotion, and consequently an erosion of the appeal of traditional collective bargaining-based unionization among workers.

The big exception is in Europe’s far north. Scandinavian unionization rates, though also dropping a bit since 2000, are vastly above those in other countries. Unions continue to enroll more than 60% of workers in Denmark, Sweden, and Finland, are barely lower at 59% in Norway, and are a startling 91% in Iceland. The difference may reflect different approaches. Though Scandinavian unions are obviously concerned with contracts and retirement benefits, they appear to give more weight than unions elsewhere to career service and support policies such as skill development programs, financial support during periods of unemployment, and job placement services enabling workers to move to find new or higher-paying jobs. To some extent this approach recalls Marshall’s ideas 16 years back, suggesting that while they may not have taken root back then, they likely still carry value.

* One partial exception, linked below, is a 1985 report with some figures drawn 1980 survey (14 million union members among 71.4 million private-sector workers, or 20% of the total, though this probably isn’t strictly comparable to the post-1983 reports), and still higher figures from earlier decades though these are definitely not directly comparable.

** Trends in public employee unions are quite different: steady growth from 5.7 million in 1983 to a peak of nearly 8 million in 2012, followed by a drop back to 7.1 million as of 2022.

Further Readings

The Bureau of Labor Statistics’ annual report on union membership, trends in different industries, wage rates for members and non-members, age and sex, etc, in 2022.

And PPI’s Will Marshall on a new model and possible path forward for unions in 2007.

More Data:

BLS for some reason hasn’t posted its 1980s releases, but does have the data from 1992 forward. BLS’ unionization archives.

… and the 1985 BLS report noted above with some early-1980s figures and comparisons as far back as 1945.

Also, a database maintained by Trinity College & Georgia State academics reprints data back to 1973 (though the 1973-1982 figures come from a different survey and aren’t strictly comparable to those of 1983 and afterward).

Points of Comparison:

OECD tracks its 37 members.

The International Labor Organization has a table of recent union membership rates in 129 countries. Iceland is on top with 91% of about 195,000 Icelandic workers, and Venezuela at the bottom with 0.2%. Data collection probably isn’t consistent across countries though, so the figures likely aren’t totally comparable.

And the International Trade Union Congress, an international association of 163 union federations representing 200 million workers in 163 countries.

Points of Comparison (2):

The Canadian experience at first seems a sharp contrast to that of the United States, with unionization rates stable at about 29% or 28% of workers since 2000. The apparent stability conceals a very sharp public/private divergence though, with 70% of Canadian government workers in unions as against a falling 13% of private-sector workers.

World’s most successful union federation? The 14 members of Sweden’s Landsorganisationen i Sverige, despite their federation’s dismaying domain name (www.lo.se), enroll 1.5 million of Sweden’s 5.1 million workers.

Korea’s Trade Union Confederation.

The Australian Council of Trade Unions.

Costa Rica’s Confederación de Trabajadores Rerum Novarum.

ABOUT ED

Ed Gresser is Vice President and Director for Trade and Global Markets at PPI.

Ed returns to PPI after working for the think tank from 2001-2011. He most recently served as the Assistant U.S. Trade Representative for Trade Policy and Economics at the Office of the United States Trade Representative (USTR). In this position, he led USTR’s economic research unit from 2015-2021, and chaired the 21-agency Trade Policy Staff Committee.

Ed began his career on Capitol Hill before serving USTR as Policy Advisor to USTR Charlene Barshefsky from 1998 to 2001. He then led PPI’s Trade and Global Markets Project from 2001 to 2011. After PPI, he co-founded and directed the independent think tank Progressive Economy until rejoining USTR in 2015. In 2013, the Washington International Trade Association presented him with its Lighthouse Award, awarded annually to an individual or group for significant contributions to trade policy.

Ed is the author of Freedom from Want: American Liberalism and the Global Economy (2007).  He has published in a variety of journals and newspapers, and his research has been cited by leading academics and international organizations including the WTO, World Bank, and International Monetary Fund. He is a graduate of Stanford University and holds a Master’s Degree in International Affairs from Columbia Universities and a certificate from the Averell Harriman Institute for Advanced Study of the Soviet Union.

Read the full email and sign up for the Trade Fact of the Week

PPI’s Trade Fact of the Week: The number of extremely poor people has fallen by two-thirds since 1990

FACT: The number of extremely poor people has fallen by two-thirds since 1990.

THE NUMBERS: Number of people in extreme poverty* in Pakistan –

2018     10.5 million (5% of the population)

2010     16.8 million (9% of the population)

2000    48.6 million (33% of the population)

1990     70.1 million (65% of the population)

* At or beneath the “extreme poverty” line is defined by the World Bank, at $2.15 per day, PPP basis, in constant 2017 dollars. World Bank estimates; 2018 is the most recent available year.


WHAT THEY MEAN:

Looking back at the post-Cold War/globalization era, what should we see first? Four obvious nominees: the launch of the internet and the creation of the digital world; the China boom; the acceleration of climate change and biodiversity loss; an extended and historically anomalous time of peace among great powers? Here’s a fifth and less visible candidate: the best period in human history for the very poor.

The World Bank’s definition of “absolute” or “extreme” poverty is life at “$2.15 per person per day in constant 2017 dollars as measured in purchasing-power parities.” This is not necessarily “income,” but consumption of a minimal level of food, clothing, and shelter in very poor countries. To illustrate: estimates of annual per capita income in Burundi, currently thought to be the world’s poorest country, range from $700 to $865. This is $1.92 to $2.37 per day, essentially the $2.15 level. A Bank database calculates the cost of a minimally “energy-sufficient” diet at $1.10 per day, about half the typical daily spending of a rural Burundian. A “nutrient-adequate” diet, at $2.93 per day, would be out of reach.

Just after the breach of the Berlin Wall in 1990, about 2 billion of the world’s 5.3 billion people lived this sort of life. A bit more than half, 1.055 billion by the Bank’s estimate, lived in East and Southeast Asia. Another 563 million were close by in South Asia, among them 70 million of Pakistan’s then 115 million people. Sub-Saharan Africa counted 271 million, Latin America and the Caribbean 73 million, just past-Soviet Eastern Europe and Central Asia 15 million, and the Middle East and North Africa 14 million. Over the next three decades:

1990-2000: In the decade of democracy promotion, trade liberalization, and the early Internet, the count of extremely poor people fell by about 200 million as world population grew by 800 million. This left 1.8 billion extremely poor, or 29% of the world’s 6.1 billion people.

2000-2010: As the China boom and its gravitational effects in Southeast Asia, South America, and Africa took hold, another 650 billion moved above the line. Extreme poverty counts fell by two-thirds in East Asia and Southeast Asia, and by half in Latin America, the Middle East, Eastern Europe and Central Asia, to end at 16.9% of world population in the midst of the financial crisis of 2010.

2010-2019: In the decade just passed, extreme poverty fell by another 350 million, nearly vanishing in East and Southeast Asia — down 98% from the 1.06 billion of 1990 to 24 million — and showing the largest absolute-number drop in South Asia (from 430 million to 157 million; as Pakistan’s population topped 230 million, the number of extremely poor Pakistanis fell to 10.5 million). = The global total just before the COVID-19 pandemic was 649 million, or 8.4% of a worldwide 7.8 billion people.

To 2023: The COVID pandemic interrupted this steady downward curve, but perhaps only temporarily. The Bank’s early estimate is that 70 million people fell back into extreme poverty in 2020, but that by last year the total was nearly back to the levels of 2019. With estimates for 2020-22 still tentative, the numbers look like this:

2022     ~655 million of 8.0 billion?

2020     ~714 million of 7.9 billion?

2019      649 million of 7.8 billion

2010      1127 million of 7.0 billion

2000     1782 million of 6.1 billion

1990      1995 million of 5.3 billion

To move above an extreme-poverty line, of course, is to escape destitution and chronic hunger, but to remain poor. But poverty at higher income levels has also fallen, if a bit more slowly — from 56% of the world’s people living on $3.65 per day or less in 1990, for example, to 23% as of 2019%; turning back to Pakistan, 91% lived below this level in 1990, and 40% now. This suggests not only a worldwide reduction in extreme deprivation and chronic malnutrition, but a broader shift toward lower-middle-class life. Social indicators bolster this impression, with world infant mortality down by two-thirds since 1990, girls’ literacy in low-income countries up by half, from 48% to 69%; and life expectancy up 7 years worldwide and 13 years in low-income countries.

Searching for a verdict on the post-Cold War world, then, the creation of the digital world, the growth of Chinese power and industry, environmental stresses, and the era’s then-unappreciated and now-vanishing geopolitical calm remain strong candidates. But the escape of a third of the world’s people from destitution easily stands with them.


Further Readings

Worldwide data and analysis: 

The World Bank’s center for poverty data.

Our World in Data has poverty totals and rates by country from 1967 through 2021.

And the World Bank’s review of poverty in Burundi, 2022.

Two questions:

Why? Explanations for the decline of poverty — extended peace, lower trade barriers and more open markets for poor-country goods, dissemination of new medicines and technologies, better basic education and public health policies — seem mostly complementary rather than contradictory or “enough in itself.” A nominee for “most important,” though, comes from economist Charles Kenny, whose prescient Getting Better: Why Development is Succeeding and How We Can Improve the World Even More (2012) noticed the fall in poverty early and views the core issue as growing intellectual consensus in developing-country governments on good and relatively low-cost policies:

“Poor countries and poor people aren’t stuck in the nightmare of ever-growing and unsupportable population, living on bare subsistence. Instead, those countries with the lowest quality of life are making the fastest progress in improving it — across a range of measures including health, education, and civil and political liberties. The progress is the result of the global spread of technologies and ideas – technologies like vaccination, and ideas like ‘you should send your daughter to school.’”

Read Kenny’s Getting Better.

And can this continue? Some factors suggest it should. Extreme poverty now is concentrated in three ways: (a) in remote rural areas as opposed to cities, where flows of young people to cities and improved infrastructure can help; (b) in sub-Saharan Africa, and the rate of extreme poverty has fallen from 53% to 35% since 1990, though rapid population growth has kept the total number high, and growth and policy trends seem likewise mostly positive, and (c) in conflict zones as opposed to peaceful regions. Others are less promising: a world landscape of high great-power tension, weaker commitment by major economies to openness and integration, and rising economic costs of climate change for poor countries may not be so severe as to reverse the positive trends of 1990-2019, but is likely less friendly to the poor.

Views from Pakistan:

The Pakistan Institute of Development Economics in Islamabad reviews trends over the past two decades (urban vs. rural, by province, children, income vs. nutrition, etc.).

Hina Shaikh at the International Growth Centre looks at next steps.

And a World Bank snapshot.

The role of trade? Three perspectives:

Carolyn Freund and Sanchez-Paramo on trade, poverty, and pro-poor reform, drawn from close analysis of trade impacts in Bangladesh, Sri Lanka, Brazil, Mexico, and South Africa.

PPI’s Ed Gresser last year on renewal of the Generalized System of Preferences, the main U.S. trade preference program for low- and middle-income countries (quick summary: renew and update the GSP, but don’t overdo new eligibility rules).

And the potential of intra-African trade integration to accelerate current growth in per capita income in low-income African countries.

ABOUT ED

Ed Gresser is Vice President and Director for Trade and Global Markets at PPI.

Ed returns to PPI after working for the think tank from 2001-2011. He most recently served as the Assistant U.S. Trade Representative for Trade Policy and Economics at the Office of the United States Trade Representative (USTR). In this position, he led USTR’s economic research unit from 2015-2021, and chaired the 21-agency Trade Policy Staff Committee.

Ed began his career on Capitol Hill before serving USTR as Policy Advisor to USTR Charlene Barshefsky from 1998 to 2001. He then led PPI’s Trade and Global Markets Project from 2001 to 2011. After PPI, he co-founded and directed the independent think tank Progressive Economy until rejoining USTR in 2015. In 2013, the Washington International Trade Association presented him with its Lighthouse Award, awarded annually to an individual or group for significant contributions to trade policy.

Ed is the author of Freedom from Want: American Liberalism and the Global Economy (2007).  He has published in a variety of journals and newspapers, and his research has been cited by leading academics and international organizations including the WTO, World Bank, and International Monetary Fund. He is a graduate of Stanford University and holds a Master’s Degree in International Affairs from Columbia Universities and a certificate from the Averell Harriman Institute for Advanced Study of the Soviet Union.

Read the full email and sign up for the Trade Fact of the Week