Trade Policy, Equity, and the Working Poor

EXECUTIVE SUMMARY

The U.S. MFN tariff system is a regressive element of the U.S. tax system, with disproportionate effects on low-income families (in particular, single-parent families), and also on African American and Hispanic families relative to families of other races and ethnicities. This emerges from four points:

(1) U.S. MFN tariffs raise revenue principally from home necessities such as clothes, shoes, and a few other consumer goods. These make up only a small share of imports but provide more than half of MFN tariff revenue.

(2) This fact makes the MFN tariff system a regressive form of taxation, since low-income families, single-parent families, and African American and Hispanic families spend more of their family budgets on these products than the U.S. average.

(3) U.S. MFN tariffs on these and several other categories of consumer goods are systematically skewed, taxing cheap goods heavily and luxury goods lightly, making the MFN tariff system discriminatory as well as regressive.

(4) Tariffs on consumer goods appear ineffective as protectors of employment or production.

These four points create a logical path toward pro-poor reform. By “sunsetting” or otherwise eliminating many tariff lines which support no U.S. employment, Congress can make U.S. trade policy and taxation fairer. This would ease financial burdens in a small but real way for American low-income and minority workers and their families, helping to raise their living standards without intensifying competitive pressure.

* * * * *

Ambassador Katherine Tai and the Office of the U.S. Trade Representative deserve great credit for seeking greater insight on the “distributional effects of goods and services trade and trade policy on U.S. workers by skill, wage and salary level, gender, race/ethnicity, age, and income level, especially as they affect underrepresented and underserved communities.” This is an important topic, deserving in-depth and regular examination. The Commission’s investigation of the matter, I hope, will cover several different dimensions of policy:


  • The nature of the permanent U.S. trade policy systems, such as the MFN tariff schedule, trade remedy laws, and agricultural subsidies and quotas, and the effect these have on America’s underrepresented and underserved communities in terms of both employment and living standards.
  • The intended and unintended effects of policy decisions which alter these underlying systems — for example, conclusion of major trade liberalizing agreements and introduction of “301” and “232” tariffs — on Americans who lack the information and perhaps the advocates to communicate their interests to executive-branch negotiators and Members of Congress.
  • The effects of the ongoing evolution of the logistics, telecommunications, and internet economies, all of which steadily reduce the transactional costs of trade, likely often rendering permanent trade regimes less effective while sometimes amplifying and sometimes muting the effects of policy change.


All these phenomena are likely to have complex and often cross-cutting effects. Sometimes they will reinforce one another. For example, tariff reductions and the growth of the global shipping container fleet both make trade cheaper. At other times they may contradict one another. Analysis of their effects on underserved and unrepresented Americans on the job and in management of family budges is therefore likely to require great sophistication and may often lead to equivocal results.

For example, the Trump administration’s imposition of tariffs on metals under Section 232 of U.S. trade law should provide some advantages to steel and aluminum producers within the United States as they compete with foreign suppliers. Potentially, therefore, this step could provide support to communities in which metals producers are important to the local economy. On the other hand, the same “232” tariffs should simultaneously disadvantage metals users, such as automakers, machinery manufacturers, and food manufacturers, as they strive to export or to compete against imported goods, and consequently disadvantage their communities. Retaliations against U.S. exporters provoked by these tariffs, often targeting agricultural exporters and thus the rural communities dependent on farming, adds another layer of intellectual and ethical complexity to these questions.

Likewise, the long-term effects of change in the logistics and communications industries — a growing container-ship fleet, larger and more efficient air cargo networks, deployment of more capable transcontinental fiber-optic cables and communications satellites, and U.S. investment in physical and telecommunications infrastructure — may often be as powerful as policy decisions by government. These lower the cost of both goods and services trade, and also make international sourcing more attractive by speeding up the movement of physical goods and information.  Over time this is likely to make tariffs and some other trade barriers generally less effective.  It may also reduce the real-world impact of changing these systems, whether through trade liberalizing agreements or presidentially imposed tariffs.

But some trade policies have less complicated effects. I argue in this paper that the MFN tariff system is such a case. On one hand, though this system is a small part of American tax policy, it is a uniquely regressive part since it raises most of its revenue from taxation of low-priced home necessities — in particular, clothes, shoes, luggage and handbags, home linens and carpets, tableware, and silverware. On the other hand, tariffs on these products offer few offsetting benefits in terms of protecting employment and production, and in many cases appear to offer no such benefits at all. Thus, the MFN tariff system is likely to be harming American workers and families in underrepresented and underserved communities by raising prices on home necessities, without creating an offsetting benefit in job opportunities.

To explain this, the paper makes four points, as follows:

(1) The MFN tariff system is mainly a way to tax home necessities;

(2) U.S. consumer goods tariffs are systematically skewed to tax cheap goods heavily and luxury goods lightly;

(3) Low-income families, single-parent families, and African American and Hispanic families spend more of their family budgets on these products than the U.S. average; and

(4) Tariffs on consumer goods do not appear to be effective at protecting employment or production.

I. MFN TARIFF REVENUE COMES MAINLY FROM HOME NECESSITIES

First, the MFN tariff system — meaning the “Column 1” tariffs listed in the Harmonized Tariff Schedule (HTS), and excluding tariffs imposed through the Trump Administration’s “232” and “301” actions, or through anti-dumping and other trade remedy laws — is mainly a way to tax home necessities.

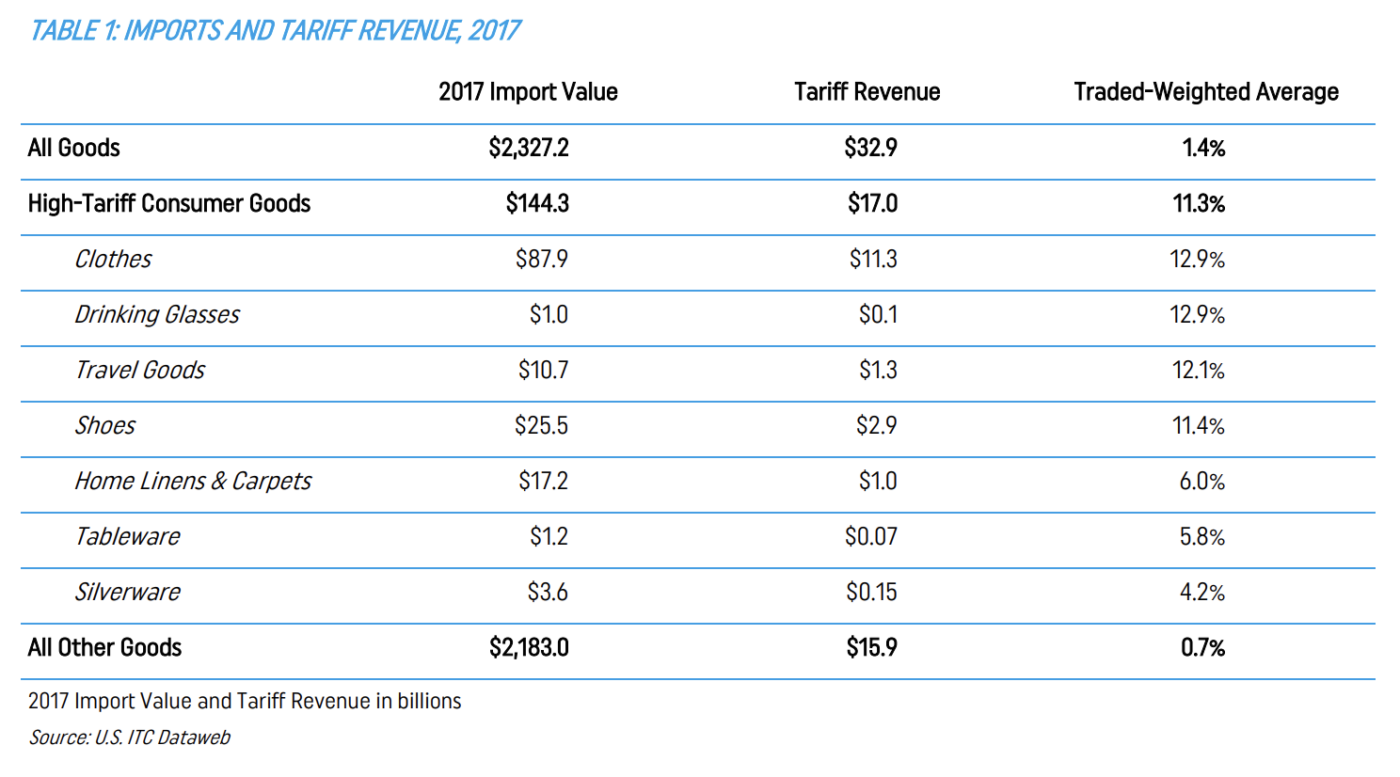
The “calculated duties” published by the ITC through its on-line “Dataweb” service (dataweb.usitc.gov) show this clearly. As Table 1 below shows, in 2017 — the last full year before imposition of the Trump administration’s “232” and “301” tariffs — about half of the $32.9 billion in U.S. tariff revenue came from a small collection of home goods. Specifically, these are clothes, shoes, home linens and carpets, travel goods, silverware, plates and drinking glasses. These products were about 6% of imports, but raised about 55% of all tariff revenue.

These products raise such a disproportionate amount of tariff revenue because (a) they receive unusually high MFN tariff rates; and (b) despite the intense scrutiny U.S. Free Trade Agreements and preference programs receive in public trade policy debate, most are imported under MFN tariffs.

The Trump administration’s “232” and “301” tariffs are a useful way to put these facts in perspective. The “232” actions in 2018 imposed tariffs of 25% on worldwide imports of many steel products and 10% on many aluminum products. The “301” actions in 2018 and 2019 imposed tariffs of 25%, 10%, and 7.5% on many Chinese goods. Observers in the United States and abroad viewed these as very large increases in tariffs — rightly so, since they fell mainly on industrial inputs bought by manufacturers, construction firms, and so on, on which tariffs are normally quite low. For example, the MFN tariff on auto parts (HTS heading 8708) is 2.5%. The MFN tariff on aluminum plates and sheets (HTS heading 7605) are usually 3%; that on pressure-reducing valves (HTS 8481) is 2%; and that on computer accessories (HTS 8471) is zero. Thus the “232” and “301” tariffs appeared to be a draconian step, and can reasonably considered as such.

In the home consumer goods world, however, MFN tariffs of 7%, 10%, 25%, and higher would not be a draconian exception; rather they are the norm. On average, as Table 1 illustrates, they have (trade-weighted) tariff rates of about 11.3% — a figure 15 times than the pre-232/301 rate on all other goods.

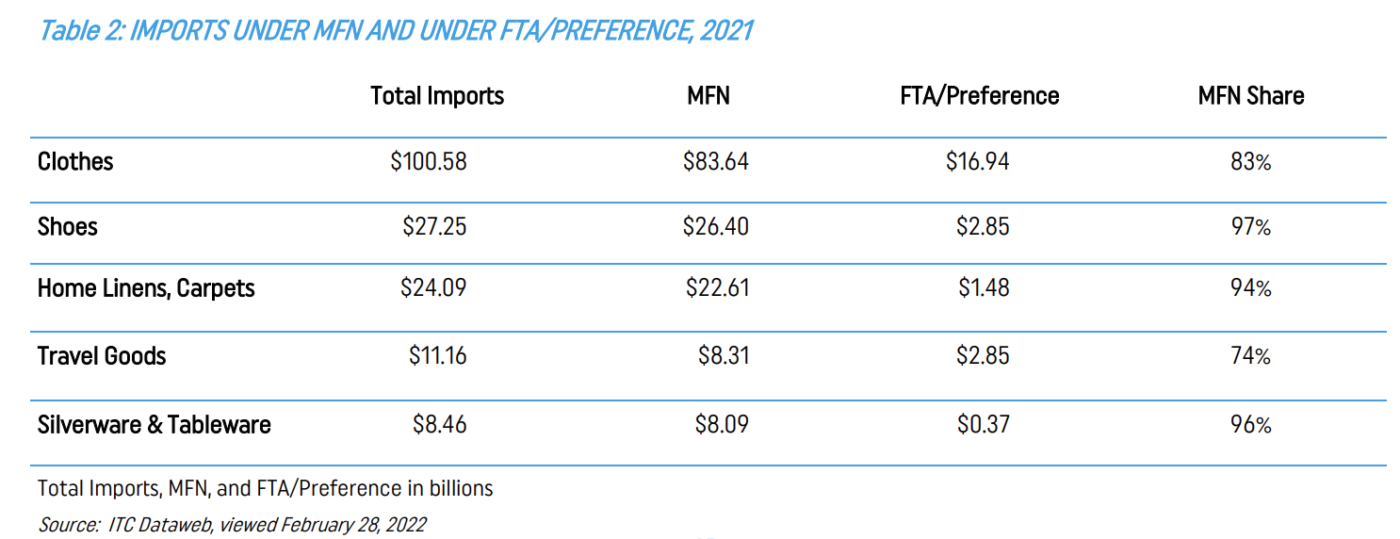
It may be asserted that the MFN tariff rates are headlines that are less important than they seem, given the large role Free Trade Agreements and developing-country trade preference systems play in U.S. trade debates. In practice, it is true that FTAs and preferences diverted some home goods imports away from high-tariff MFN producers. The main examples are diversions of some clothing to Western Hemisphere and (to a lesser extent) African producers, and of “travel goods” to several Southeast Asian GSP beneficiary countries. But as Table 2 points out, these effects are only modest in clothing and travel goods, and negligible in other home goods. In all these product categories, the large majority of imports arrive under MFN tariffs, with buyers paying MFN tariff rates and passing on the costs to customers.

Thus, as of 2017 a small set of home consumer goods made up $144 billion of the U.S.’ $2.33 trillion in imports — 6% of the total, in other words — but raised well over half of all U.S. tariff revenue.

II. SINGLE-PARENT FAMILIES, AND AFRICAN AMERICAN AND HISPANIC FAMILIES, SPEND MORE OF THEIR INCOME ON HOME NECESSITIES

Second, the fact that U.S. MFN tariffs are mainly on home necessities makes the MFN tariff system a regressive element of the tax system.

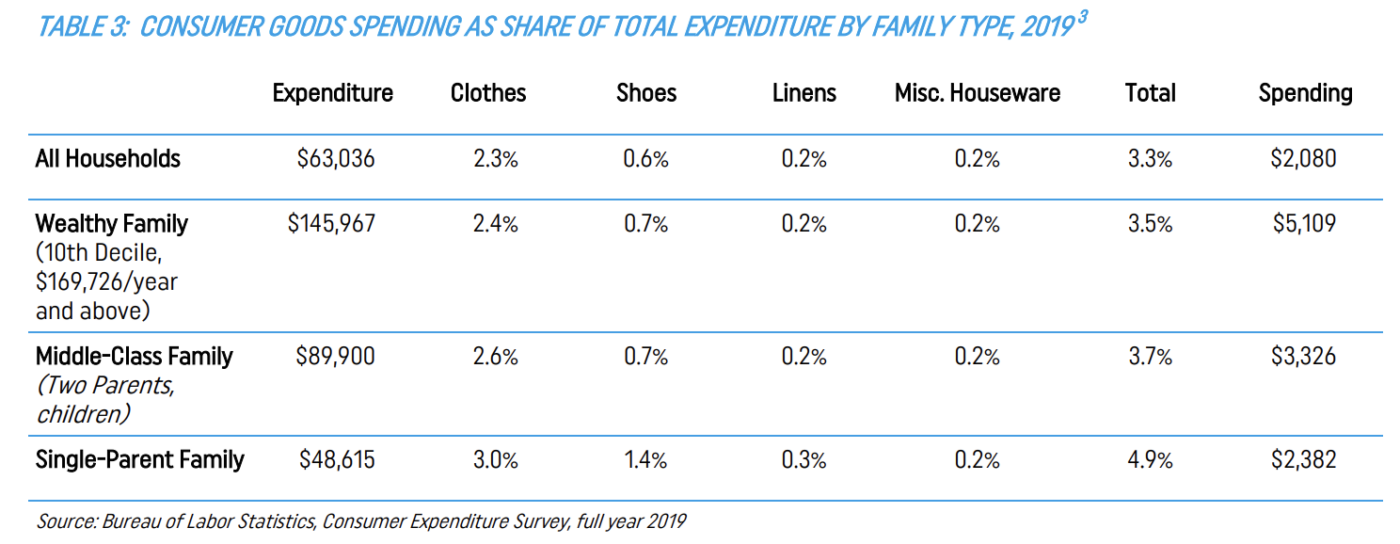
Data from the Bureau of Labor Statistics’ Consumer Expenditure Survey (CEX) show that poor families spend more of their income on home necessities — counting clothes, shoes, home linens and floor coverings, along with “small appliances and other household goods” — than middle-class families or wealthy families. Likewise, African American and Hispanic families spend more of their income on these goods than the national average.

The CEX “Composition of Consumer Unit” expenditure table includes spending patterns for all households, two-parent families with and without children, and single-parent families with and without children. CEX’s “Deciles of Income” table allows us to compare these family types’ expenditures with those of wealthy families with incomes of $175,000 per year and higher. The predictable pattern is that single-parent families have the lowest incomes among the CEX family types and spend the largest share of their incomes on home necessities. Table 3 below illustrates this with CEX’ household expenditure data for 2019.

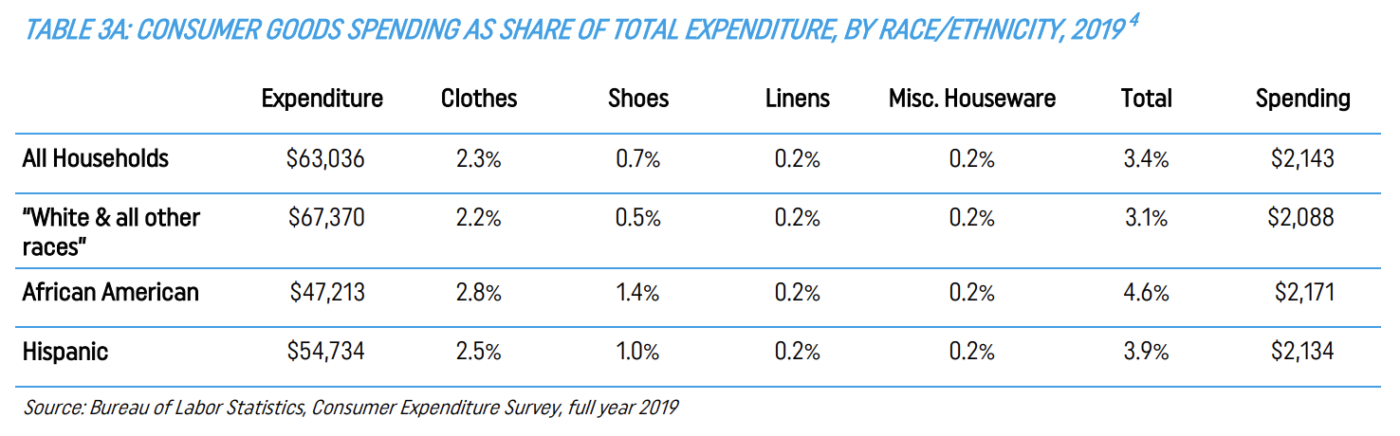
Likewise, as Table 3a shows, spending on necessities requires more of the family budget for African American and Hispanic families than for the national average, or for BLS’ “White and All Other Races” category.

These tables’ implication is clear. Low-income families, and African American and Hispanic families, devote more of their budgets to home necessities, and the MFN tariff system raises most of its revenue from these products. Therefore, the tariff system is bound to be “regressive” in taxing poor families more heavily than middle-class families, and wealthy families lightest of all. Likewise, it will have disproportionate effects (even if not huge ones) by race and ethnicity. These principles are widely recognized in debates over state sales taxes and federal excise taxes, though in modern history the opacity of the tariff system, and the rarity of investigation into its nature by Congress or economists, has obscured this system’s regressive nature.

III. U.S. MFN TARIFFS ON HOME NECESSITIES ARE LOW ON LUXURIES BUT HIGH ON MASS-MARKET GOODS

However, comparing average MFN rates and families’ spending patterns is insufficient. This is because the MFN tariffs on home goods are not uniform rates applied to all varieties of (say) shoes, clothes, or spoons as is often the rule in Europe, Japan, and other major trading partners. In the U.S. MFN system, by contrast, MFN tariffs on home goods are systematically and rather radically skewed against poorer people, since cheap mass-market products receive especially high rates on cheap mass-market products and analogous luxury goods very low ones.

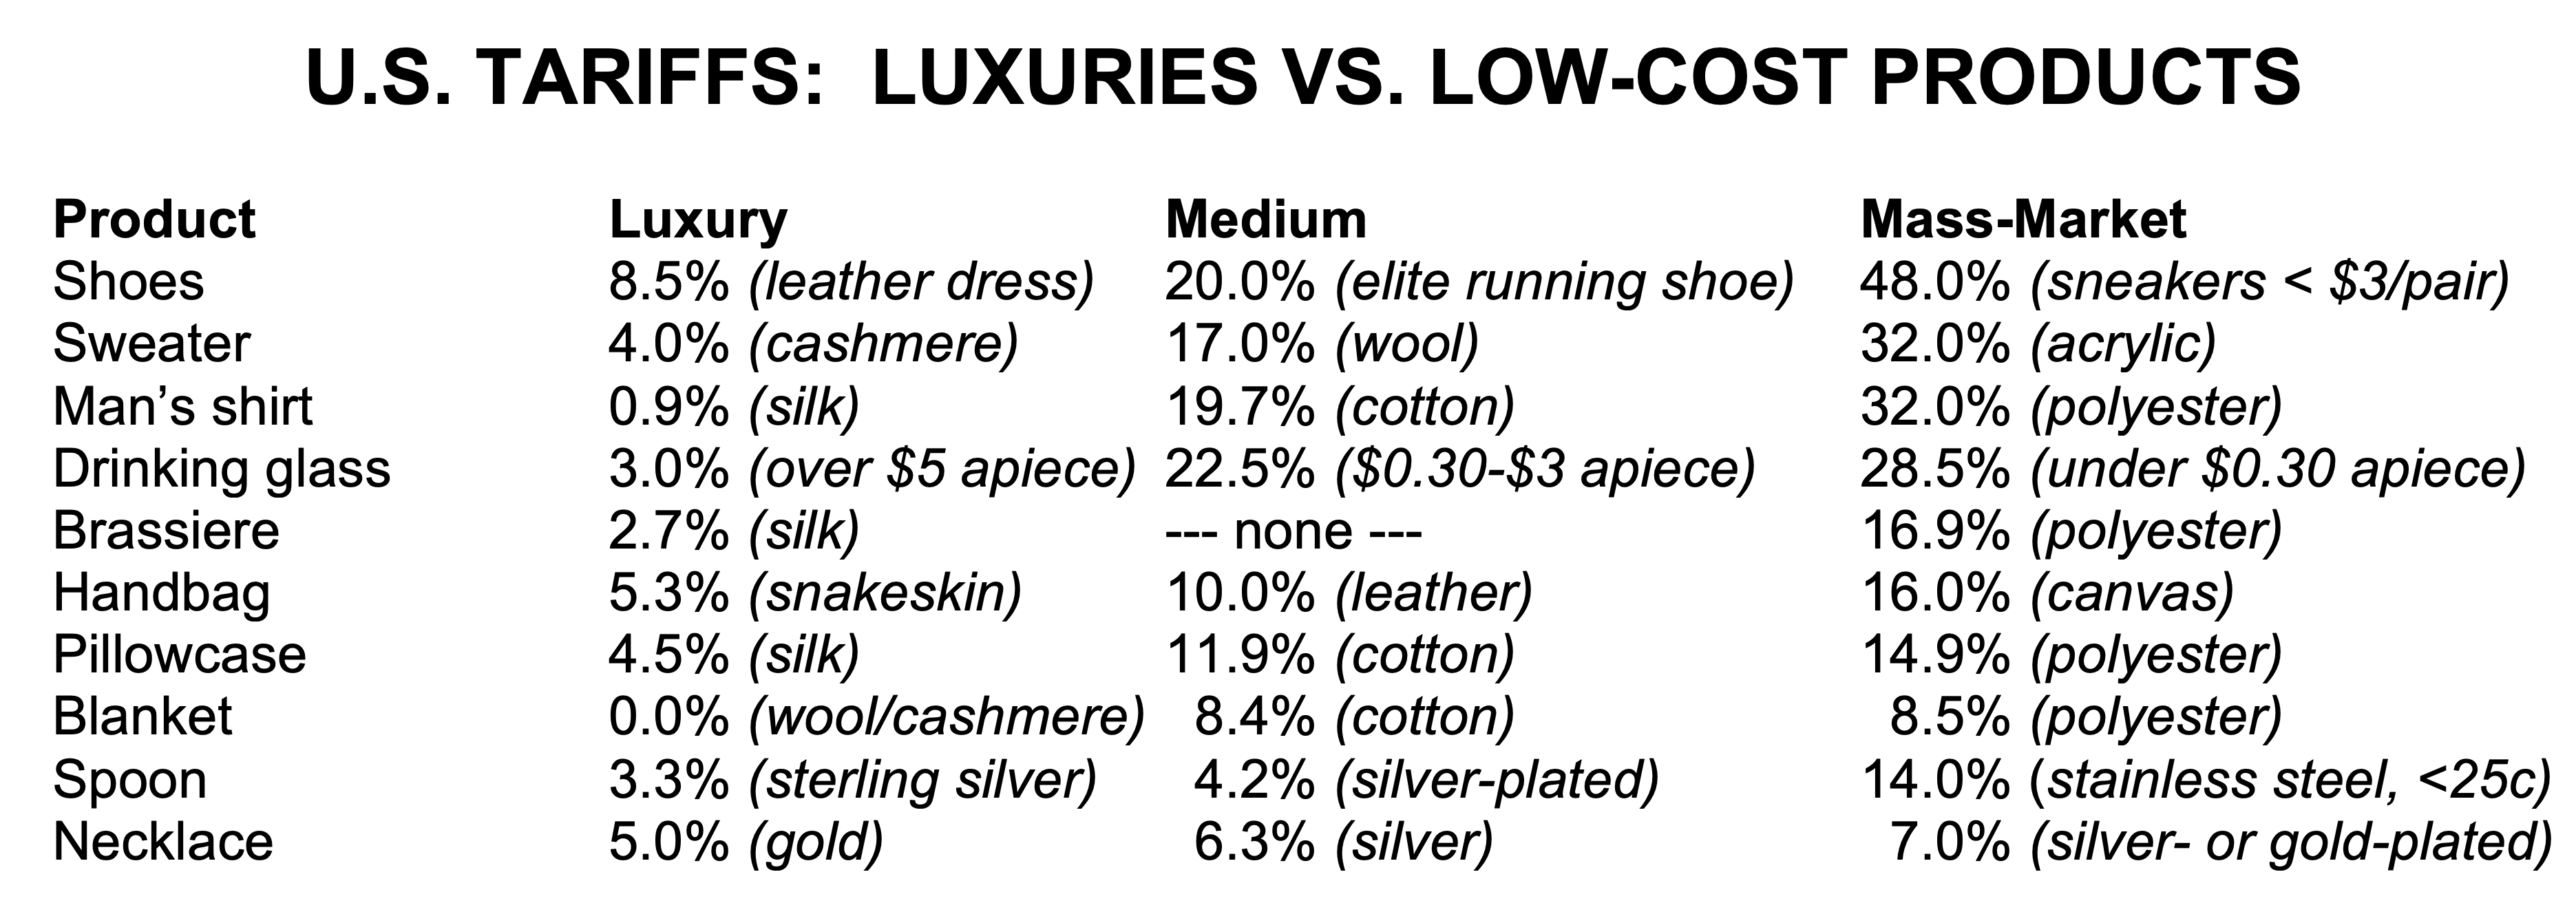
The Harmonized Tariff Schedule (HTS) devotes about 1,000 tariff lines to these products. These lines span a remarkably broad spectrum of rates, many far from the 11.3% trade-weighted average. Table 4 below is an illustrative list of 31 actual MFN tariff rates applied to twelve types of products, grouped in “luxury,” “medium,” and “mass-market” categories. At the luxury end, we find rates of 0.0% on silver-plated forks, 0.9% on men’s silk shirts, 4.0% for cashmere sweaters, and 8.5% on leather dress shoes. At the other end are rates of 14% on stainless steel spoons, 32% on men’s polyester shirts, and 48% (the highest U.S. tariff imposed on any manufactured good) on low-priced sneakers.

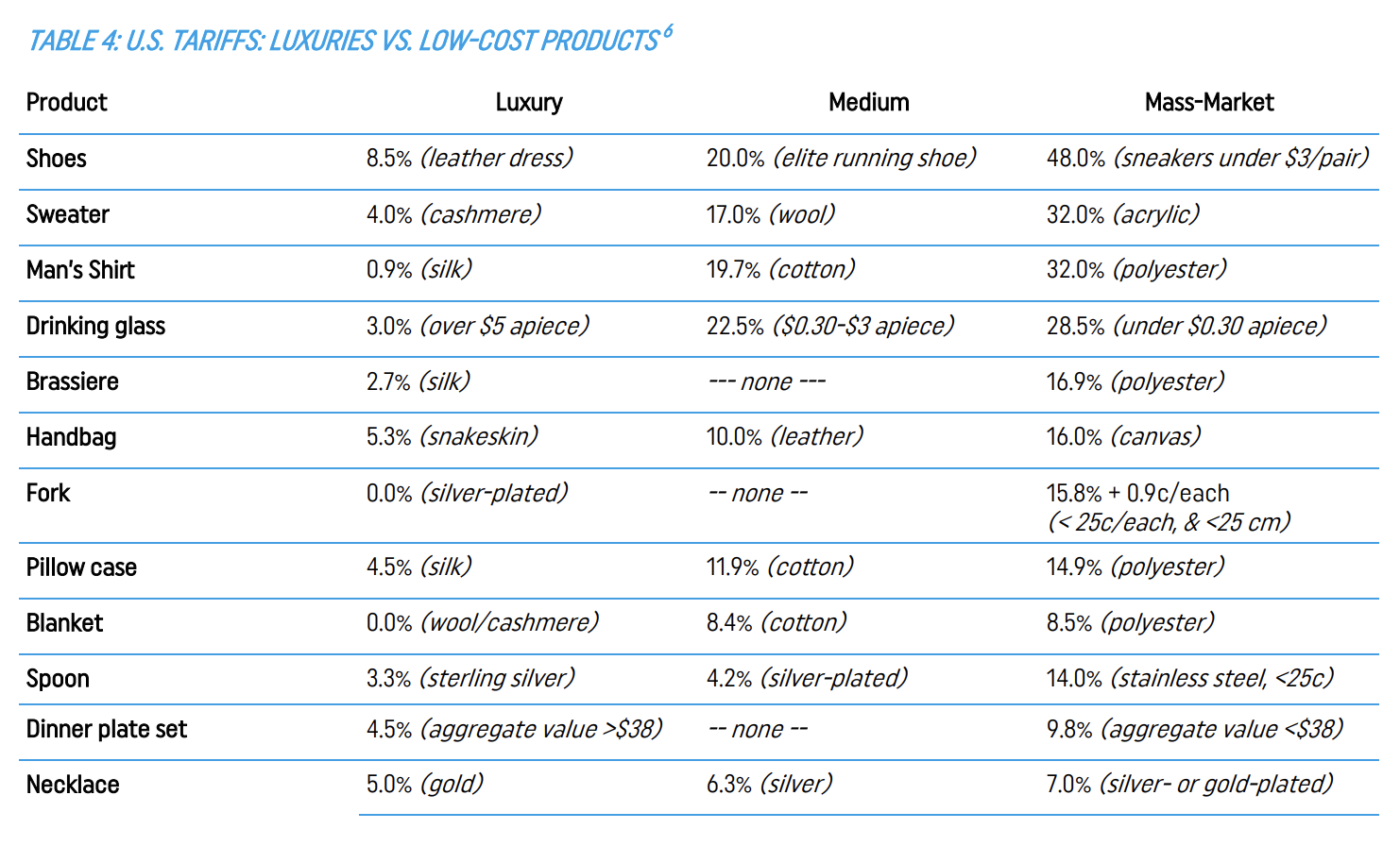
These examples illustrate the fact that virtually everywhere in the consumer goods chapters and headings of the Harmonized Tariff Schedule, tariff rates are systematically higher for products mainly bought by poorer people, and systematically lower for analogous luxury products mainly bought by rich people. For example, buyers of cheap stainless steel spoons are (without knowing it) taxed heavily and buyers of sterling silver spoons lightly — in this case, with the tariff rate specifying that low-priced steel spoons specifically receive the highest rates. A hotel maid in polyester underwear must (without knowing it) pays an 16.9% tax, while a wealthy vacationer occupying the balcony she cleans pays 2.7%. This skew makes it reasonable to view the MFN tariff system on home goods not only as regressive, but actually discriminatory against the poor.

IV. TARIFFS ON HOME NECESSITIES APPEAR INEFFECTIVE IN SUPPORTING EMPLOYMENT AND PRODUCTION

Fourth and finally, few tariffs on home necessities appear to be effective protectors of production and employment.

MFN tariff rates for these goods have remained stable for decades. Shoe tariffs, for example, were exempted from Uruguay Round tariff cuts. Most clothing tariffs likewise remained the same, though clothing trade more broadly was substantially liberalized by elimination of the quota systems in effect from the 1970s through 2004. But as these policies remained in place, formerly poor agricultural countries became large producers of consumer goods; European and Asian (and American) port efficiency improved; the global container shipping fleet expanded from about 1 million TEU to 25 million TEU; and innovation in maritime logistics, air cargo, and telecommunications steadily drove down transactional costs. This meant that the power of a stable consumer goods tariff to affect trade flows lessened each year.

Thus, while the MFN tariffs on consumer goods have always been regressive, over time many of them have lost their power to “protect” jobs and production. In such cases, tariffs lose their dual role as trade policy and tax policy, and become essentially excise taxes.

In shoes and clothes, for example, the “import shares” of the U.S. market are exceptionally high at 98% and 97% respectively, despite the high tariffs on these products. Actual shoe employment has fallen by a likely 95% since the mid-1970s to about 6,900 as of 2022. In clothing the same phenomenon appears, as employment has dropped from roughly 1 million in the 1970s to 95,000 in March 2022. In “jewelry and silverware,” a category that obviously goes well beyond tableware, employment has dropped from 70,000 in 1990 to 21,500 in 2022, and a New York company making expensive high-end silverware is advertising itself as the only American firm currently making these goods. On the other hand, employment trends in “textile furnishings” are less dramatic, with job totals clearly down — 130,000 in 1990, 46,000 at the end of 2021 — but the decline much less sharp than in clothes, shoes, silverware, or travel goods. This suggests either the U.S. industry remains competitive and employment declines mainly reflect productivity gains, that tariffs have been more effective in home linens than in other industries, or both at the same time.

This evolution appears to have gone especially far, and in fact to have been completed, in some of the products carrying the very highest tariffs. For example, it appears that none of the cheap sneakers with 48% MFN tariffs or sometimes even higher complex tariffs have been made in the U.S. for decades. Likewise, if the New York silverware company’s presentation is up to date, no U.S. firm is making the cheap spoons with 14.0% tariffs or the “15.8% + 0.9c/apiece” forks.

V. OBSERVATIONS AND CONCLUSIONS

What, if anything, should be done about this? As a starting point, Ambassador Tai and the Office of the U.S. Trade Representative deserve applause for asking a core question about the purposes and effects of trade policy in requesting this International Trade Commission to conduct this study.

One purpose should be to support the living standards of vulnerable Americans, both in their lives as workers and in their lives as managers of especially limited family budgets. Others should include promoting U.S. growth and economic efficiency, providing opportunity for exporting farmers, manufacturers, and services providers, and ensuring that American workers and business operators are treated fairly in global markets.

These goals will not always complement one another. A particular trade policy choice may be good for the nation, but in some degree bad for vulnerable communities, and/or good for some vulnerable communities but harmful to others. In such cases, Congress and administration officials would be making intellectually and ethically complex decisions about defining national interest, and finding complementary ways to support those workers who might be disadvantaged.

On the other hand, sometimes policy choices are relatively simple and easy. If long-established policies are (a) generally regressive and often actually discriminatory against the poor, and (b) have lost their original purpose of protecting employment and production, then they should be scrapped.

One way to approach this would be a “sunset” provision, in which all HTS tariff lines would receive periodic review to see whether they relate to U.S. employment and production. Tariff lines which protect no U.S. employment or production appears would be abolished, unless their advocates could show an important indirect support for U.S. industry and workers via FTAs or some other avenue. Such an approach would not affect employment or production, and would have disproportionate — though obviously not enormous — benefits for single parent families, African American and Hispanic families, and the poor generally.

Policy choices, however, are never likely to materialize without the research and data that illuminate a problem and point the way to solutions. The ITC’s study, accompanied by its hearings and symposium, are a unique opportunity to provide that research and data, and bring it to the attention of Congress, executive branch officials, academics, and the public.


READ THE FULL REPORT


ABOUT THE AUTHOR

Edward Gresser is Vice President and Director for Trade and Global Markets of the Progressive Policy Institute, a 501(c)(3) nonprofit headquartered in Washington, D.C. Before joining PPI in October 2021, he served as Assistant U.S. Trade Representative for Trade and Global Markets, and concurrently as Chair of the U.S. government’s interagency Trade Policy Staff Committee.

PPI’s Trade Fact of the Week: Most globalized language: English

FACT:

Most globalized language: English


THE NUMBERS: 

Continents and regions contributing words to the English language: Africa, Asia, Australia, Europe, South America, North America, Arabia, South Pacific, Caribbean.

WHAT THEY MEAN:

Coca-cola, bubble gum, bikinis, digital media tycoons, hamburgers, frozen mocha, and blue jeans: Do we live in a boringly homogenized New-York-and-California-ish world?  Not really. These are not American or even “English” words, but (barring “bubble,” “digital media,” and “blue”) imports from baroque Europe, the Incan empire, the South Pacific, pre-colonial Africa, 19th-century German immigrant communities, Tokugawa Japan and classical Arabia:

  • The trademark name Coca-Cola combines the Quechua word for the coca plant and the Malinke name for a West African nut once used to flavor the drink.
  • Gum seems to be a survivor of the ancient Egyptian language, brought into English via Greek.  It bested a logical competitor — the Aztec word “tzictli” or “chicle,” referring to the actual gum base — which holds out mainly in the candy trademark “Chiclets.”
  • Bikini is the name of the unfortunate coral atoll in the Marshall Islands used to test nuclear bombs in 1946. (“Coral” is Greek and “atoll” comes from Divehi, a language spoken in the Maldives Islands southwest of India.)
  • Tycoon is the Japanese title — itself based on a Chinese phrase meaning “great prince” — of a high Edo-era official. Commodore Perry brought it back from Tokyo in the 1850s, and young White House staffers using it as a nickname for President Lincoln stuck it firmly in English.
  • Hamburger, obvious north German origin.
  • Mocha is the Yemeni port from which coffee (an Arabic word) was first exported in the 12th century.

What about blue jeans? The Academie Francaise resentfully accepts “blue-jean” as a “mot d’origine anglo-americaine” now permanently implanted in the French language.  Mais non! The term “jeans” is French, originally Marseille dockside slang for denim-wearing Italian sailors from Genoa (“genes” in French) and brought to English sometime in the 16th century. “Denim” is French, too, literally meaning fabric “from Nimes.”

FURTHER READING

The Academie Francaise on “blue jeans.”

Vogue/France has a better take, here.

The sad story of the original Bikini.

Al-Arabiya explains mocha.

Earlier: A quick trawl through some modern English-language vocab and their origins, yields small word-pictures of old civilizations and modern neighbors. Some examples:

Ancient Egyptian: gum, oasis, ibis, basalt, ebony, ivory, pharaoh
Japan then: haiku, samurai, zen, geisha, tycoon
Japan now: manga, anime, karoshi, salaryman, sushi, karaoke
Persia then: chess, apricot, magic, jasmine, julep, caravan, tambourine
Iran now: chador, ayatollah, fatwa
Aztecs: chili, chocolate, coyote, mescal, tomato, guacamole
Vikings: berserk, fjord, iceberg, reindeer, saga, ski, Viking, walrus
Malay: bamboo, gong, paddy, java, orangutan, amok, gecko, bantam

BBC’s “Vocabularist” notes that “pyramid” was originally a Greek word, meaning a kind of layer-pastry, like baklava. The actual Egyptians apparently called a pyramid a “mer.”

And two language/linguistics sources

How many words are there, actually? Some blathering and hand-waving from the Oxford English Dictionary editors, who term this good question “a distraction”:

“The question ‘How many words are there in the English language?’ cannot be answered by recourse to a dictionary.”

What?! They’re supposed to know! It’s their job! OED editors try to climb out of self-dug hole.

OED’s most recent update, for March 2022, has “nearly 700” newly classified words: first gentleman, burner phone, gender-critical, trigger warning, ydraw (died out in the 1400s), decarbonize, etc. A look at the March updates.

And how many languages? The Summer Institute of Linguistics, originally an evangelical group dedicated to Bible translations, lists 7,151 known languages around the world, from A-Pucikwar (sadly vanished, Andaman Islands, no known relationship to others, said to use only the numbers “one,” “two,” plus some variants of “more”) to Zuni (9,500 speakers, New Mexico) by country and language family.

ABOUT ED

Ed Gresser is Vice President and Director for Trade and Global Markets at PPI.

Ed returns to PPI after working for the think tank from 2001-2011. He most recently served as the Assistant U.S. Trade Representative for Trade Policy and Economics at the Office of the United States Trade Representative (USTR). In this position, he led USTR’s economic research unit from 2015-2021, and chaired the 21-agency Trade Policy Staff Committee.

Ed began his career on Capitol Hill before serving USTR as Policy Advisor to USTR Charlene Barshefsky from 1998 to 2001. He then led PPI’s Trade and Global Markets Project from 2001 to 2011. After PPI, he co-founded and directed the independent think tank ProgressiveEconomy until rejoining USTR in 2015. In 2013, the Washington International Trade Association presented him with its Lighthouse Award, awarded annually to an individual or group for significant contributions to trade policy.

Ed is the author of Freedom from Want: American Liberalism and the Global Economy (2007).  He has published in a variety of journals and newspapers, and his research has been cited by leading academics and international organizations including the WTO, World Bank, and International Monetary Fund. He is a graduate of Stanford University and holds a Master’s Degree in International Affairs from Columbia Universities and a certificate from the Averell Harriman Institute for Advanced Study of the Soviet Union.

Read the full email and sign up for the Trade Fact of the Week

PPI’s Trade Fact of the Week: Every American earthworm north of the Mason-Dixon Line is an alien invader

FACT:

Every American earthworm north of the Mason-Dixon Line is an alien invader.


THE NUMBERS: 

Number of identified North American species:*     ~160,000
Number of “invasive species” in North America:        ~6,500

* Not counting nematodes, microorganisms, or flatworms.


WHAT THEY MEAN:

The gardener loves him/her*; the northern forestry manager fears him/her. A worried observation from the Minnesota Department of Natural Resources:

“All of the terrestrial earthworms in Minnesota are non-native, invasive species from Europe and Asia.  …  [A]t least seven species are invading our hardwood forests and causing the loss of tree seedlings, wildflowers, and ferns.”

A hundred native North American worm varieties happily navigate the red and black earth of the American south, and a few more cling on in the Pacific Northwest. In Canada, New England, Pennsylvania, and the upper Midwest, though, the last Ice Age froze off the local worms above a latitude roughly matching that of the Mason-Dixon Line.** The 15 or so worm species common in these parts now are all descendants of European worms brought in after the Mayflower landing. As such, they are “invasive species,” spreading north and west at a pace of about 50 feet per year, and forestry science views them as dangerous pests. Eating off the forest “duff layer” of dead leaves and organic matter as they go, the Euro-worms trigger a long and depressing chain of events: soil compaction, loss of small forest plants and tree seedlings, decline of native orchids and wildflowers, reduction of habitat for small animals, slower forest regeneration, increased vulnerability to pests, ultimately “a grave threat to the biodiversity and long-term stability of hardwood forest ecosystems.”

Dollying up and back for a robin’s-eye view of the matter, the 15 worms are one group of many invaders. Excluding microbes, flatworms and nematodes — not because they don’t matter, but they’re hard to count — North America is home to about 165,000 species of animals, fungi, and plants. Ignoring the traditional kingdom/phylum/order courtesies, they are arranged as follows:

Ignoring the traditional kingdom/phylum/order courtesies, they are arranged as follows: 90,000 insects; 45,000 fungi; 17,000 plants; 8,000 arachnids; 4,261 vertebrates (including 2,400 fish, 900 birds,442 mammals, 382 reptiles, and 261 amphibians); 1,600 crustaceans; 1,300 coelenterates (e.g. jellyfish, corals, and sea anemones), 755 mollusks, and 115 worms.

About 6,500 of these species by the U.S. Geological Survey’s estimate are newcomers, termed “invasive,” as they arrived after 1492. Celebrated examples include the Japanese kudzu vine in the Southeast, the Black Sea’s zebra mussel in the Great Lakes, the Southeast Asian snakehead fish in the Potomac and Chesapeake, the British starling everywhere but Canada, the Burmese pythons multiplying in the Everglades, the Argentine ants crawling up the California coast, and the very recent arrivals of “murder hornets” and Joro spider from Japan and Korea. Together they are said to cause roughly $20 billion in annual damage to the U.S. economy; the United States Geological Survey (USGS) believes that the “current annual environmental, economic, and health-related costs of invasive species exceed those of all other natural disasters combined.”

What, if anything, can be done about this? “Prevention” options are ideal, including laws banning deliberate introduction of alien species; inspection, sterilization, and quarantine rules at seaports and air terminals; and regulations requiring ships arriving from overseas to dump ballast water in mid-ocean and exchange it for sterile water as to prevent further introductions of shallow-water mollusks, worms, and crustaceans to new habitats.  Attempts to extirpate the invaders after arrival, though, are at best partial defenses and sometimes hopeless; the U.S. Geological Survey sadly says that “the odds of eradicating an introduced population of reptiles once it has spread across a large area are very low,” and the worms are another example, as they advance, a foot or two every month, further into the northern woods.

* Per the National Wildlife Federation, “Earthworms are hermaphrodites, meaning an individual worm has both male and female reproductive organs.”
** Drawn by two 18th-century surveyors, Charles Mason and Jerry Dixon, to mark Pennsylvania’s border with Maryland and West Virginia.


FURTHER READING

The U.S. Government invasive species gateway.

In Hawaii, 282 of 1,100 native species are threatened or endangered. Hawaii’s Invasive Species Council cam be found here.

A global invasive species database, including a list of the top 100 invasive-species threats worldwide.

For an international comparison, New Zealand’s quarantine system.

At sea: The International Maritime Bureau explains the International Ballast Convention, an agreement meant to prevent transcontinental movements of shallow-water clams, shrimp, mussels, fish, and other animals via ballast-water, which entered into force in 2017.

Damages: A French survey tries to estimate the cost of invasive species worldwide, reviewing 1,900 local estimates to arrive at a guess at $1.3 trillion worldwide since 1970; annual costs have steadily escalated to about $167 billion per year as of 2017. The most costly invasions are those of malarial mosquitoes, rats, cats, fire ants, and termites.

And some invaders, with estimated dates of entry

Spiders (2013): A University of Georgia release on the Joro spider, full of gleefully mock-reassuring innuendo (they are “relatively harmless to people,” and “their fangs are often not large enough to break human skin”).

Worms (~1600): Detail from the University of Minnesota on worms and the northern forest:

The non-native worms consume the duff (leaf litter) layer of forest floors as they eat their way across the continent’s forests from thousands of points of introduction, initially by European settlers and more recently by their use as live fishing bait. The worms alter the physical and chemical properties of soils, changing the pH, nutrient and water cycles, and disrupting symbiotic relationships between soil fungi and roots (mycorrhizas).  The earthworms also amplify the negative effects of droughts, warming climate, and deer grazing on native plants, [UMinn Research Associate Lee] Frelich said.  “Many native plant species, such as trillium and native orchids, cannot thrive under these changed circumstances.”  Conversely, the worms literally prepare the soil for non-native plants from Europe, which are co-evolved with the earthworms on their home continent, including buckthorn, garlic mustard, Japanese barberry [ed. – obviously not a ”European” plant, but still an invader], tatarian honeysuckle, and hedge nettle.

The U. of Minn. reports on earthworm risk and damage to northern forests.

Birds (1890): The starling was introduced by Gilded Age New Yorker Eugene Schieffelin, a pharmaceutical magnate and Bronx Zoo donor, who brought a flock of about 120 birds from England in 1890 as part of a scheme to introduce all of the 64 bird species found in the plays of William Shakespeare to Central Park.  Most of his skylarks, thrushes, and so forth died off.  Starlings thrived, to the detriment of local bluebirds and woodpeckers; Schieffelin’s original cageful has grown to 200 million across North America. Smithsonian Magazine explains here.

Snakes (1942 for the brown tree snake in Guam, ~1980 for the Burmese python in the Everglades): The brown tree snake, native to the Solomon Islands, was accidentally introduced to Guam during World War II, apparently in the wheel wells of military aircraft. Within fifty years it had wiped out 10 of Guam’s 13 native birds, 2 of its 3 mammals, and 6 of its 12 lizards. USGS comment:

The impacts of these introduced species, and particularly the brown Treesnake, are so severe that they have been compared to and found to have more lasting effects on the ecological diversity of an island ecosystem than did the naval bombardment and leveling of forests that occurred on Guam during World War II. 

Burmese pythons are a more recent migrant, first found in the Everglades in the mid-1980s, and now number “in the tens of thousands.” The U.S. Geological Survey notes that Florida is home to 53 invasive reptiles, and says “the odds of eradicating an introduced population of reptiles once it has spread across a large area are very low.”

The USGS on invasive reptiles.

A more optimistic take from National Geographic, as the pythons find a foe in the egg-eating native bobcat.


ABOUT ED

Ed Gresser is Vice President and Director for Trade and Global Markets at PPI.

Ed returns to PPI after working for the think tank from 2001-2011. He most recently served as the Assistant U.S. Trade Representative for Trade Policy and Economics at the Office of the United States Trade Representative (USTR). In this position, he led USTR’s economic research unit from 2015-2021, and chaired the 21-agency Trade Policy Staff Committee.

Ed began his career on Capitol Hill before serving USTR as Policy Advisor to USTR Charlene Barshefsky from 1998 to 2001. He then led PPI’s Trade and Global Markets Project from 2001 to 2011. After PPI, he co-founded and directed the independent think tank ProgressiveEconomy until rejoining USTR in 2015. In 2013, the Washington International Trade Association presented him with its Lighthouse Award, awarded annually to an individual or group for significant contributions to trade policy.

Ed is the author of Freedom from Want: American Liberalism and the Global Economy (2007).  He has published in a variety of journals and newspapers, and his research has been cited by leading academics and international organizations including the WTO, World Bank, and International Monetary Fund. He is a graduate of Stanford University and holds a Master’s Degree in International Affairs from Columbia Universities and a certificate from the Averell Harriman Institute for Advanced Study of the Soviet Union.

Read the full email and sign up for the Trade Fact of the Week

Gresser for the Wall Street Journal: I’ll Tax Your Feet

By Ed Gresser

If you get irate over income or property taxes, don’t look down at your feet. You’ll feel worse if you do, because the costs that go into many Americans’ shoes contain the country’s most unfair taxes.

The American tariff system rarely draws attention. The Trump-era tariffs on metals and Chinese goods were unusual. They were hotly debated, drew foreign retaliation, and raised prices on many consumer goods and industrial inputs.

Those who investigate the permanent tariff system find a few predictable things: Tariffs are an inefficient form of tax that enable price increases without increasing supply or affecting demand, and they are a relatively small revenue source for the U.S. at about $85 billion in 2021. But they also find something both startling and grating: Tariffs are easily the most regressive of all U.S. taxes, forcing the poor to pay more than anyone else.

This is because permanent U.S. tariffs mostly tax a few basic household goods. Clothes, shoes, silverware, dinner plates and drinking glasses account for about 6% of imports, but (excluding the Trump tariffs) raise about half of all tariff revenue. This is because tariff rates on these products, which have hardly changed since the 1960s, average about 11%—compared with the 0.7% average for other goods.

Read the full piece in the Wall Street Journal

PPI’s Trade Fact of the Week: By country count, the African Continental Free Trade Area (launched 2021) is the world’s largest FTA

FACT:

By country count, the African Continental Free Trade Area (launched 2021) is the world’s largest FTA.


THE NUMBERS: 

African exports*, 2021 –

To world:                    $500 billion
To Asia:                       $158 billion
To western Europe:    $160 billion
Intra-African:                $88 billion
To U.S. & Canada         $30 billion

* International Monetary Fund, Direction of Trade Statistics 2021


WHAT THEY MEAN: 

Reflecting on the maritime past of East Africa and the Indian Ocean littoral in his Dhow Cultures of the Indian Ocean (2010), Tanzanian historian Abdul Sheriff offers an emotional appreciation of open societies and of trade as a way to share goods, ideas, and values across cultures:

“Commerce necessarily demands exchange of goods and ideas among peoples of different ecologies, cultures and religions … [T]he movement of people, the routes they follow, and the relationships they forge create unities in human history.  … Mercantile communities are necessarily open societies … [whose] cosmopolitan culture is made up of elements of diverse provenance, and while this does not automatically add up to a harmonious blend, it is remarkably tolerant toward other religions, cultures, and behaviors.”

The contemporary “African Continental Free Trade Area” (AfCFTA) is in concept an effort to create such a unity, and in practical terms an attempt to at least partially solve some persistent challenges to African growth and development: Why does so little trade go on within Africa, in comparison to Europe, Asia, or the Western Hemisphere? (South African think-tank TRALAC estimates that 17% of Africa’s trade is “intra-regional”, as opposed to over 60% for Europe and Asia, and about 46% for the Western Hemisphere.). And, relatedly, how can Africa reduce its reliance on exports of primary resources to Europe, Asia, and North America, and raise its ability to produce and sell manufactures, services, and farm products?

Launched in 2018 and signed in 2020, AfCFTA now applies in 41 of 55* countries in Africa, with a combined population of 1.1 billion. These figures make it the largest free trade agreement, by country membership in the world (assuming one doesn’t consider the 164-member WTO as such a group), and second to Asia’s Regional Comprehensive Economic Partnership as the largest by population. Its elimination of a planned-for/hoped-for 97% of tariffs on intra-African trade began a year ago; participants continue to talk about approaches to services, intellectual property rules, trade facilitation and “non-tariff barriers” such as customs transparency, technical standards notification, and other challenges that are often more costly than tariffs.

While many such questions remain open, an enthusiastic World Bank study projects an extra $450 billion in continental income by 2035, with 30 million people escaping poverty, Africa’s export trade shifting a bit away from energy and metal ores to manufactured goods, and African wages rising by about 10%. Side effects include raising U.S. exports to Africa by about $12 billion in manufacturing and $2 billion in agriculture (as African growth rates and incomes rise and allow for more imports), and $10 billion in services such as education, health, and logistics; rising competitiveness vis-à-vis other regions would push up African exports to the U.S. by about $16 billion.

Economic modeling and implementation challenges aside, AfCFTA is both a detailed program for Africa’s economic future and a remarkable commitment to swim against a bleak 2020s intellectual tide, in which visions of open societies are under great pressure, governments trust each other less than in the past, and publics perhaps more likely to believe that one country’s success may require another’s loss. As such it seems not only a visionary idea, but a good example for a world that needs one just now.

* State Department count is 54 countries, including 49 in sub-Saharan Africa and 5 in North Africa. The AfCFTA’s 55 include the disputed Western Sahara.

FURTHER READING


Ghanaian President Nana Akufo-Addo at the AfCFTA Secretariat opening in 2020.

South Africa’s TRALAC (Trade Law Centre) tracks AfCFTA implementation and policy debates.

… and has a startling graphic on the cost non-tariff barriers impose on intra-African trade.

UNCTAD has a supporting website offering opportunities to report and publicize non-tariff barriers in Africa.

statistical take from the World Bank.

And African Development Bank Chief Economist Kevin Urama on AfCFTA outlook and potential implementation challenges, 2020.


U.S. Policy

U.S. Trade Representative Katherine Tai reviews the U.S.-Africa relationship, and applauds AfCFTA, the 2021 AGOA* Ministerial.

* “AGOA” referring to the “African Growth and Opportunity Act,” a program launched in 2000 which waives tariffs on nearly all goods from participating African countries (subject to a set of eligibility criteria), accompanied by a regular series of Summits, Ministerial meetings, business/civil society dialogues, and technical assistance programs. 

And still current though a bit further back, the Obama administration’s 2016 “Beyond AGOA” report — the last major U.S. policy document on the U.S.-Africa economic relationship — points to urban demographics, falling poverty rates, and accelerating technological connectivity as core trends suggesting an African economic boom in the later 2020s and the 2030s. Statistics since 2016 underline the report’s take on the data:

  • The “sub-Saharan” continental economy has grown from $1.5 trillion to $2.1 trillion.
  • Africa’s urban population has grown by about 80 million (from 392 million to 470 million), and will approach a billion in the next decade
  • Africa’s internet-using population has likely doubled, from about 200 million to 400 million, accompanied by a six-fold increase in available bandwidth.
The report suggests a need for a more differentiated U.S. approach to Africa, in which tariff waivers are accompanied by reciprocal agreements, and a deeper African engagement in the WTO, with particular attention to tariff bindings, trade facilitation, transparency and notification rules such as those regarding technical standards. The “Beyond AGOA” report can be found here.


And two big picture looks at Africa’s cosmopolitan past: 

Tanzanian scholar Abdul Sheriff’s Dhow Cultures of the Indian Ocean on East Africa, Persia, India, and Indonesia in the global economy to 1500 (with cameos from the Roman Empire,“Star Raft” navigator Zheng He, and Portuguese explorer/buccaneer Vasco da Gama), with reflections on the nature of maritime and mercantile societies.

And Francois Xavier-Fauvelle’s The Golden Rhinoceros: Histories of the African Middle Ages has a series of snapshots — drawn from Nubian state correspondence, a coral house on Kenya’ Indian Ocean coast, a Saharan salt mine, an Arab account of the Malian court, the small gold statue of a rhinoceros from Great Zimbabwe — on long-ago government, trade and diplomacy in the Sahel, Ethiopia, and the East African coast.

ABOUT ED

Ed Gresser is Vice President and Director for Trade and Global Markets at PPI.

Ed returns to PPI after working for the think tank from 2001-2011. He most recently served as the Assistant U.S. Trade Representative for Trade Policy and Economics at the Office of the United States Trade Representative (USTR). In this position, he led USTR’s economic research unit from 2015-2021, and chaired the 21-agency Trade Policy Staff Committee.

Ed began his career on Capitol Hill before serving USTR as Policy Advisor to USTR Charlene Barshefsky from 1998 to 2001. He then led PPI’s Trade and Global Markets Project from 2001 to 2011. After PPI, he co-founded and directed the independent think tank ProgressiveEconomy until rejoining USTR in 2015. In 2013, the Washington International Trade Association presented him with its Lighthouse Award, awarded annually to an individual or group for significant contributions to trade policy.

Ed is the author of Freedom from Want: American Liberalism and the Global Economy (2007).  He has published in a variety of journals and newspapers, and his research has been cited by leading academics and international organizations including the WTO, World Bank, and International Monetary Fund. He is a graduate of Stanford University and holds a Master’s Degree in International Affairs from Columbia Universities and a certificate from the Averell Harriman Institute for Advanced Study of the Soviet Union.

Read the full email and sign up for the Trade Fact of the Week

PPI’s Trade Fact of the Week: The U.S. tariff system is biased against poor families

FACT:

The U.S. tariff system is biased against poor families.


THE NUMBERS: 

U.S. MFN tariff rates:

On silver-plated forks:       0.0%

On stainless steel forks     15.8% + 0.9c each
values under 25 cents:


WHAT THEY MEAN: 

As Americans prepare 1040 forms and tax payments this week, some observations on the U.S.’ oldest and most regressive tax:

In principle, tariffs are simple. An American auto dealership pays the Customs Bureau the 2.5% tax on a German car and includes it in the sales price. But in practice, tariffs can be very complicated. Even setting aside the system’s many add-ons and holes,* the basic U.S. “Most Favored Nation” tariff schedule is a mini-tax code all to itself, arranged in 11,111 different “lines” from horses at the beginning (line 01012100) through salt, cars, butter, planes, powdered zinc, playing cards, computers and more, to antiques between 100 and 250 years old at the end (line 97069000), each with its own tax rate.

Information on this system’s operation is scarce. Congress appears to have held its most recent hearing on tariff policy in 1974. It has been even longer since the Treasury Department reported on the distributional and other economic effects of tariffs. And the only regular review of the tariff system’s impact on employment, production, and living standards — the U.S. International Trade Commission’s admirable if limited “Economic Effects of Significant Import Restraints” report — last came out in 2017.  But enough information is available to make three main points: (1) the tariff system is a small part of federal revenue; (2) it mainly taxes consumer necessities like clothes and shoes; and (3) it is, by far, the most regressive U.S. tax.  Some detail on each of these points, plus an additional fourth observation unrelated to taxation:

1. Tariffs provide about 2% of federal revenue. According to the Congressional Budget Office’s November estimates, the U.S. Treasury took in $4.06 trillion in Fiscal Year 2021 (i.e., Sept. 30, 2020 through Sept. 30, 2021). The Treasury used six major taxes to raise this money, topped by the $2.04 trillion income tax, the $1.31 trillion payroll tax, and the $0.37 trillion corporate tax. Tariffs placed fourth at $81 billion (for the Fiscal Year; the calendar year 2021 total was $85 billion), about equally divided between the administrative and provisional Trump-era tariffs on Chinese goods and metals, and the permanent “MFN” tariff system established by law. Rounding out the six taxes, excise taxes on fuels, alcohol, and tobacco placed fifth at $75 billion, and inheritance taxes sixth at $25 billion.

2. The U.S. tariff system is mainly a way to tax clothes, shoes, and a few other consumer necessities, and is therefore a “regressive” tax. The Trump-era tariffs hit manufacturers and construction firms hardest. (More on this in a few weeks.) The permanent tariff system is quite different, mainly taxing retailers and families by putting its highest rates on clothes, shoes, and a few other home goods such as silverware, plates and cups, and drinking glasses. Tariff rates on this set of goods average about 11.3%, roughly 16 times the 0.7% average for everything else. Thus in 2017, the last year before the Trump tariffs, these products accounted for about 6% of America’s goods imports ($144 billion of a $2.37 trillion total), but raised about 55% of tariff revenue ($17 billion of $33 billion). Any tax focused on clothes, shoes, and other home needs is “regressive” — that is, it hits low-income families harder than middle-class or rich families — since the poor must devote more of their income to these necessities.

3. Because consumer goods tariffs are high for cheap goods, and low for luxuries, they single out the poor to pay more. Worldwide, most tariff systems tax these goods more heavily than industrial products and natural resources. Thus the U.S. system is not unusual in being a regressive tax; but it is nearly alone in taxing cheap mass-market goods much more heavily than the exactly analogous luxury products bought by the wealthy. For example, Australian tariffs on shoes are almost all either 5% or zero, and do not set higher rates on cheap shoes than on expensive ones. American shoe tariffs by contrast are 8.5% for dress leathers, 20% for elite basketball and track shoes, and 48% for cheap sneakers imported at $3.00 and below. The fork example above is much the same:  buyers of sterling silver pay no tax at all, while buyers of cheap stainless steel pay about 20% (counting the 0.9 cent per fork flat fee as well as the 15% “ad valorem” tariff).

This skew is systematic, appearing in almost all tariffed consumer goods. A quick PPI table gives twelve typical examples:

Explanatory note: These home goods — clothes, shoes, home linens, luggage and handbags, jewelry, and tableware — account for a relatively small proportion of imports, totaling $123 billion in 2017, or 5% of the U.S.’ $2.3 trillion in merchandise imports. Nonetheless, these products account for $17 billion of the $32.4 billion in 2017 tariff revenue. Thus average tariff rates applied to these products are about 15%, 20 times higher the 0.8% average for other goods. About $25 billion worth of these products arrived duty-free under FTAs and trade preference programs, while $100 billion came under the MFN tariff s above.  

For the sake of simplicity, we have not included the actual tariff line numbers in the table above. They are available at the U.S. International Trade Commission’s tariff site. If you have a specific request, please email us. 

4. Tariffs do not appear effective as job or production protectors. Finally, though not a tax issue as such, the consumer goods tariffs appear not to have powerful effects on employment and production. For example, 98% of shoes are imported and no cheap sneakers have been made here since the 1970s; likewise 97% of clothes are imported, and most arrive under the normal tariff system rather than FTAs or preferences. Silverware is made in the United States, but in the high-priced luxury low-tariff category rather than the cheap high-tariff category.

Perhaps we can do better, and treat low-income Americans more fairly, than this.

* Add-ons: anti-dumping and countervailing duty penalties on particular goods, Trump-era “301” and “232” tariffs on metals and Chinese goods. Holes:  waivers of tariffs for particular countries through FTAs and preferences.

FURTHER READING


The U.S.’ “Harmonized Tariff Schedule”

Obama administration Council of Economic Advisers luminaries Jason Furman, Jay Shambaugh, and Kadee Russ on the tariff system as an “arbitrary and regressive tax.”

The U.S. International Trade Commission’s “Economic Effects of Significant Import Restraints,” the last edition was authorized in 2016 and released in 2017.

In this Form 1040 season, tariff reform and PPI’s big-picture tax reform

PPI’s July 2019 tax proposal envisions scrapping Trump-era tariffs and the regressive-but-ineffectual parts of the MFN tariff system.  This is part of a larger reform program designed to create a “simpler, fairer, and more pro-growth tax system that raises adequate revenue”.  The program includes 14 specific reforms that reduce taxes on income from labor while increasing them on unearned sources of income for the wealthy; rein in the biggest tax expenditures; encourage reduction or elimination of other wasteful and distortionary elements of the tax code; and improve collection.  Examples include replacing the relatively regressive payroll tax with a value-added tax; revising the estate and gift tax system; adding a marijuana excise tax, and more. See pp. 44-56.

And for reference, the basic data from CBO

The Congressional Budget Office’s latest outlay-and-revenue summary.

And the six main taxes in Fiscal Year 2021:

Total federal revenue         $3,842 billion
Personal income taxes        $1,705 billion
Payroll taxes                        $1,296 billion
Corporate income taxes       $268 billion
Tariffs                                       $81 billion
Excise taxes                             $75 billion
Estate & gift taxes                   $28 billion
Misc. other fees and fines        $32 billion


ABOUT ED

Ed Gresser is Vice President and Director for Trade and Global Markets at PPI.

Ed returns to PPI after working for the think tank from 2001-2011. He most recently served as the Assistant U.S. Trade Representative for Trade Policy and Economics at the Office of the United States Trade Representative (USTR). In this position, he led USTR’s economic research unit from 2015-2021, and chaired the 21-agency Trade Policy Staff Committee.

Ed began his career on Capitol Hill before serving USTR as Policy Advisor to USTR Charlene Barshefsky from 1998 to 2001. He then led PPI’s Trade and Global Markets Project from 2001 to 2011. After PPI, he co-founded and directed the independent think tank ProgressiveEconomy until rejoining USTR in 2015. In 2013, the Washington International Trade Association presented him with its Lighthouse Award, awarded annually to an individual or group for significant contributions to trade policy.

Ed is the author of Freedom from Want: American Liberalism and the Global Economy (2007).  He has published in a variety of journals and newspapers, and his research has been cited by leading academics and international organizations including the WTO, World Bank, and International Monetary Fund. He is a graduate of Stanford University and holds a Master’s Degree in International Affairs from Columbia Universities and a certificate from the Averell Harriman Institute for Advanced Study of the Soviet Union.

Read the full email and sign up for the Trade Fact of the Week

PPI’s Trade Fact of the Week: ‘Trade’ is generally popular among Americans

FACT:

“Trade” is generally popular among Americans. 


THE NUMBERS: 

Gallup 2022 poll: International trade “is an opportunity for growth through exports”*

All respondents                    61%
Self-declared Democrats     72%

*The alternative, international trade is more “a threat to the economy through foreign imports,” gets 35% support among the general public; Gallup’s writeup does not cite Democratic support for this proposition.


WHAT THEY MEAN:

Gallup’s February trade poll asks, for the 22nd time since 1992, whether we are more inclined to see “exports as an opportunity for growth” or “foreign” imports as a “threat to the economy.” Lamentably off on the economics! But faced with this choice, 61% of respondents choose “opportunity” and 35% “threat.” This result is on the “optimistic” side of the poll’s average, which over the full 30 years comes out at 53%-33%. Its partisan filter, meanwhile, finds self-identified Democrats more “pro-trade” than average at 72%; Republicans are for now more pessimistic, with 44% choosing “opportunity” and 52% “threat.” Independents, at 65% “opportunity,” are closer to the Democratic view.

The second very recent trade poll, released last November by the Chicago Council for Global Affairs, asks about two specific trade agreements — the Comprehensive and Progressive Trans-Pacific Partnership (previously the more concise TPP), and U.S.-Mexico-Canada Agreement (before its renegotiation, the North American Free Trade Agreement) and whether in general “globalization” and “international trade” are good for the United States. Though the questions are different, the Council’s results are similar to Gallup’s: an overall positive view, with a noticeable partisan divergence.  Asked about a hypothetical decision by the U.S. to rejoin the CPTPP, 62% of Council respondents favored the idea while 33% opposed. Among Democrats, the split was a decisive 75% yes and 19% no; Republicans were also positive but less emphatic, at 50%-38%. Likewise, asked whether “international trade” is good for the U.S. economy in general, 86% of Democrats concurred as against 66% of Republicans; and asked whether trade is good for “creating jobs,” 68% of Democrats and 51% of Republicans agreed.

Both results are pretty typical of the last decade’s trade polling, showing a generally positive public view of trade but with Democrats more enthusiastic. A trawl back through earlier Gallup and Chicago Council polls, along with more by Pew Research, NBC/Wall Street Journal, Monmouth and others, finds at least three different demographic axes of divergence, suggesting that the partisan gap has a stronger foundation than simple reactions to a current administration:

1. Youth and Age: Young people generally seem more positive about trade than their elders.  As an example, Pew’s 2018 poll found 18-29-year-olds most likely to agree in a general sense that “trade is good” (84%), and also most likely to agree that trade creates jobs, lowers prices, and raises wages.

2. Race and Ethnicity: Monmouth University asked in 2019 (during the Trump administration’s burst of tariffing) whether “tariffs on products imported from our trading partners” would help or harm the U.S. economy. This poll divides the public a little simply, contrasting the views of non-Hispanic whites with those of all other races and ethnicities combined.  It found non-Hispanic white Americans tilting against tariffs (28% help the U.S. economy, 41% harm); among Hispanic, Asian Americans, and African Americans, by contrast, the split was a decisive 19% “help” and 57% “harm.”

3. Education: The same Monmouth poll, found differences on tariffs to be modest among the public as a whole, but with less-educated white Americans noticeably less likely than other demographics to see tariffs as harmful to the economy.  Among all Americans with college degrees, 23% predicted that tariffs would help the economy while 56% predicted harm; for all those without degrees, the split was a similar though less emphatic 25% “help” and 43% “harm”.  Among non-Hispanic white Americans, specifically though, views diverged sharply by education level:  respondents with college degrees viewed tariffs as likely to harm the economy by 54%-23%, while respondents without degrees split nearly evenly, at 31% “help” and 35% “harm.”

FURTHER READING


Gallup on the 2022 view of trade.

Pew’s 2018 survey.

The Chicago Council’s 2021 poll.

Monmouth University’s 2019 poll on tariffs.

And NBC/WSJ, also from 2019.

Time capsule

The Chicago Council on Global Affairs has the longest continuous record of trade polling, spanning 42 years from last November’s report to the March 1979 American Public Opinion and U.S. Foreign Policy release. Forty-three years ago, the U.S. public’s top international economic concerns were inflation and the declining value of the dollar, and the public at large appears to have been more inclined to keep tariffs while national leaders mostly favored abolishing them. The Chicago Council archive.


ABOUT ED

Ed Gresser is Vice President and Director for Trade and Global Markets at PPI.

Ed returns to PPI after working for the think tank from 2001-2011. He most recently served as the Assistant U.S. Trade Representative for Trade Policy and Economics at the Office of the United States Trade Representative (USTR). In this position, he led USTR’s economic research unit from 2015-2021, and chaired the 21-agency Trade Policy Staff Committee.

Ed began his career on Capitol Hill before serving USTR as Policy Advisor to USTR Charlene Barshefsky from 1998 to 2001. He then led PPI’s Trade and Global Markets Project from 2001 to 2011. After PPI, he co-founded and directed the independent think tank ProgressiveEconomy until rejoining USTR in 2015. In 2013, the Washington International Trade Association presented him with its Lighthouse Award, awarded annually to an individual or group for significant contributions to trade policy.

Ed is the author of Freedom from Want: American Liberalism and the Global Economy (2007).  He has published in a variety of journals and newspapers, and his research has been cited by leading academics and international organizations including the WTO, World Bank, and International Monetary Fund. He is a graduate of Stanford University and holds a Master’s Degree in International Affairs from Columbia Universities and a certificate from the Averell Harriman Institute for Advanced Study of the Soviet Union.

Read the full email and sign up for the Trade Fact of the Week

Trade Fact of the Week: America’s ‘non-MFN’ tariffs on natural resources are usually low

FACT:

America’s “non-MFN” tariffs on natural resources are usually low.


THE NUMBERS: 

Tariff rates on two Russian imports

Palladium, “MFN”:           0%
Palladium, “Column 2”:    0%

King crab, “MFN”:            0%
King crab, “Column 2”:     0%


WHAT THEY MEAN:

The Biden administration’s ban on Russian oil, coal, and gas is a large though not total trade sanction, cutting off about 60% of American imports of Russian goods. (Last year’s import total was $26 billion; energy made up $16 billion.) Congress, meanwhile, is considering a bill to revoke Russia’s “Most Favored Nation” tariff status. Some observations on this more complex measure:

Fundamentally, it means the tariff rates a country applies generally — as an example, the U.S.’ 6.5% “MFN” tariff on umbrellas (tariff line 66019100) applies to European umbrellas, Chinese umbrellas, Brazilian umbrellas, etc. (Following the late Senator Daniel Moynihan’s noble but forlorn hope to make trade policy terms of art more comprehensible, the U.S. also uses the term “permanent Normal Trade Relations or “NTR” to mean the same thing, but others don’t.) MFN tariffs are also a core feature of relationships among WTO members, as membership entails accepting a “non-discrimination” obligation requiring them to give one another equal tariff rates.

What then does “revoking” MFN status mean? In practice, should Congress pass such a law, buyers of Russian goods would no longer pay the current U.S. tariff rate. Instead they would pay the rates created in the 1930 “Smoot-Hawley” Tariff Act during the Hoover presidency.  These rates are now listed in “Column 2” of the U.S. Harmonized Tariff Schedule; as an example, an umbrella gets a 40% Column 2 tariff. More broadly, standard estimates of Smoot-Hawley average tariffs are (a) about 20% overall, based on dividing tariff revenue by import value, as opposed to 2.8% in 2021 (or 1.4% excluding the Trump-era tariffs on Chinese goods and metals) or (b) an even higher average of 59% excluding duty-free goods.

As the averages and the umbrella example both suggest, non-MFN tariffs are generally seen as quite punitive, and often are so in reality. However, they are much less punitive in the specific Russian case.  This is because Russia is mainly a natural-resource exporter, and Column 2 tariffs on natural resources are actually rarely high and often zero. In 1930, both Congress and Mr. Hoover wanted very high tariffs on manufactured goods and farm products, but avoided them on raw materials to keep costs low for U.S. factories. These sorts of things — energy, specialty metals, chemical inputs for fertilizer — make up most of America’s 21st-century purchases from Russia. A look at MFN and “Column 2” rates on the U.S.’ top 25 Russian imports last year (accounting for $22 billion of a $26 billion total) yields this result:

1. Energy ($16 billion): Eight crude and refined oil, gas, and coal products made up about 60% of all U.S. imports from Russia last year.  The Column 2 tariff on crude oil is 21 cents per barrel —twice the “MFN” 10.5 cents per barrel, but still insignificant.  So revoking MFN tariffs on energy would be unlikely to change trade flows at all, since the increases basically raise rates from about 0.1% to about 0.2%.  If the goal is to impose economic costs, yesterday’s ban will do a lot more.

2. Four specialty metals ($2.1 billion): palladium, rhodium, uranium, and silver in bullion form. Here, revoking MFN changes nothing, as U.S. tariffs are zero on these things at MFN, and also zero in Column 2.

3. Five natural resources and basic chemical products (also $2.1 billion): Diamonds are zero at MFN, and 10.5% in Column 2; likely some impact, but not a huge one.  The others — king crab, potassium chloride, urea, and urea/ammonium mixture (the latter two used as fertilizer precursors) — are all zero tariff now and also zero in Column 2.

4. Four industrial metals ($2.5 billion): The largest is pig iron at $1.2 billion, for which rates rise from zero to $1.11 per ton.  This was probably a lot in 1930, but is about 0.2% — not significant — at the 2022 market price of about $500 per ton. Increases are higher for the other three:  zero to 10.5% for unwrought aluminum alloy, zero to 11.5% for ferrosilicon, and zero to 30% for ferrosilicon.

5. Four value-added manufactured products ($1.5 billion): Here, a shift to Column 2 means a steep tariff increase.  For birch-faced plywood, tariffs rise from zero to 30%; for bullets and cartridge shells, zero to 50%; for semi-finished steel products, zero to 20%; and for reaction engines, zero to 35%.

Altogether, then, revoking MFN status for Russia imposes some penalties, but in most cases not very significant ones given Russia’s unusual export pattern.  It may nonetheless be an appropriate symbolic and moral gesture, in particular if many WTO members join in it.  But as a policy measure meant specifically to impose economic cost, the energy import ban is the one with practical real-world impact.

FURTHER READING


President Biden on blocking Russia energy imports; also summarizes current sanctions, coordination with allies, and measures to ease impacts at home.

Trade Subcommittee Chair Rep. Earl Blumenauer on the case for revoking Russia’s PNTR.

Finance Committee Chair Wyden with a similar bill.

A quick PPI table: The top 25 U.S. imports from Russia (at HTS-8 level in tariff lingo, accounting for 87% of the $26 billion in U.S. imports from Russia last year), with import value, tariff code, and MFN/non-MFN rates:

Tariff System Background

The Harmonized Tariff Schedule, from the U.S. International Trade Commission (MFN rates in Column 1, non-MFN in Column 2).

Also from the ITC, the invaluable (though a bit challenging for those not yet initiated into tariff codes) Dataweb allows you to check imports, exports, and balances country-by-country and product-by-product.

And trade policy historian Doug Irwin looks back at the notorious Tariff Act of 1930.

A Note on Platinum-Group Metals

Where does it hurt? Overall, Russia is a modest U.S. trading partner, supplying 1% of U.S. imports and buying 0.3% of exports. Though the largest chunk of this is energy (again, $16 billion of $26 billion in total imports, and of $32 billion in total trade), adjustment for the U.S. might be most challenging in a few specialty metals (e.g. palladium and rhodium, “platinum-group” metals used in automotive engines to absorb pollutants in exhaust, in medical device manufacturing, and so on). The U.S. Geological Survey’s summary of platinum-group metal reserves around the world suggest it isn’t impossible. Russia has a lot, but South Africa has more, and the U.S. and Canada have some, too.

Here’s where it is — Sibanye Stillwater, a South African-owned U.S. mine in Montana, is the principal non-Russian source of palladium.


ABOUT ED

Ed Gresser is Vice President and Director for Trade and Global Markets at PPI.

Ed returns to PPI after working for the think tank from 2001-2011. He most recently served as the Assistant U.S. Trade Representative for Trade Policy and Economics at the Office of the United States Trade Representative (USTR). In this position, he led USTR’s economic research unit from 2015-2021, and chaired the 21-agency Trade Policy Staff Committee.

Ed began his career on Capitol Hill before serving USTR as Policy Advisor to USTR Charlene Barshefsky from 1998 to 2001. He then led PPI’s Trade and Global Markets Project from 2001 to 2011. After PPI, he co-founded and directed the independent think tank ProgressiveEconomy until rejoining USTR in 2015. In 2013, the Washington International Trade Association presented him with its Lighthouse Award, awarded annually to an individual or group for significant contributions to trade policy.

Ed is the author of Freedom from Want: American Liberalism and the Global Economy (2007).  He has published in a variety of journals and newspapers, and his research has been cited by leading academics and international organizations including the WTO, World Bank, and International Monetary Fund. He is a graduate of Stanford University and holds a Master’s Degree in International Affairs from Columbia Universities and a certificate from the Averell Harriman Institute for Advanced Study of the Soviet Union.

Read the full email and sign up for the Trade Fact of the Week

Trade Fact of the Week: The only previous attempt to erase a U.N. member country from the map: 1990

FACT:

The only previous attempt to erase a U.N. member country from the map: 1990.

THE NUMBERS: 

U.N. member states as of February 2022: 193

WHAT THEY MEAN: 

From the transcript of Ukrainian Ambassador Sergei Kyslytsya’s remarks to the U.N. Security Council a week ago Tuesday:

“The internationally recognized borders of Ukraine have been and will remain unchangeable.  Ukraine unequivocally qualifies the recent actions by the Russian Federation as violation of sovereignty and territorial integrity of Ukraine. … President Putin, who has taken a decision that we discuss today as a threat to the rules-based order, to the U.N. Charter, in particular its Article 2, as well as to international peace and security.”

Particularly relevant in the Ambassador’s reference to the U.N. Charter is Article 2’s Clause 3, on wars of conquest: “All Members shall refrain in their international relations from the threat or use of force against the territorial integrity or political independence of any state, or in any other manner inconsistent with the Purposes of the United Nations.”

Obviously, the actual U.N. members have frequently fallen short of the Charter’s aspirations over the 78 years since its signature. In the last decade especially, after a long period of peace among great powers, even close allies found it difficult to sustain a sense of common interest.  But however far governments have fallen short of the Charter’s goals, they have almost invariably respected its ban on wars of conquest. Only once before last week’s attack on Ukraine (in Saddam Hussein’s 1990 attempt to annex Kuwait to Iraq) has one U.N. member state attempted to erase another from the map. Three thoughts on the events since:

(1)    Respect for the ban on wars of conquest is at the foundation of any international aspiration, whether related to peaceful settlement of disputes among countries, scientific and medical progress, common action against environmental threats, prosperity and reduction of poverty, or reduction of the risk of war.

(2)    The breach of this principle in the attack on Ukraine last week is very rare in modern history and exceptionally dangerous, in that it was ordered not by the rogue dictator of an isolated minor power but by a permanent member of the U.N. Security Council.  Should it succeed, we may well expect more such events and a much more dangerous world.  Should it fail, the taboo on wars of conquest will be greatly strengthened, and future attempts far less likely.

(3)    The Biden administration and partner democracies have responded with a model of muscular, calm, and principled cooperation, first in attempting to dissuade the Russian government from attacking Ukraine, and then in their coordinated response, combining extensive financial and other sanctions with practical and moral support for Ukraine.  The contrast between this response and the self-pitying folly of “America First” movements — in the 1940s or the 2020s — is stark, reminding us that isolationism makes the world more dangerous and ultimately Americans themselves less safe; and that when defense of international order and the principles Ambassador Kyslytsya cites prove necessary, the world’s democracies have many and powerful options.


FURTHER READING

Ukrainian Ambassador Kyslytsya at the U.N. Security Council last week.

The U.N. Charter full text.

Current policy review

NATO summarizes military aid to Ukraine.

The Treasury Department’s Office of Foreign Assets Control reports the addition of four individuals to the “Specially Designated Nationals” list.

The European Union itemizes current sanctions.

The U.K. sanctions.

Australia sanctions.

New Zealand on Ukraine.

Japan sanctions.

Korea on Ukraine.

Canada sanctions.

Some relevant PPI readings 

PPI President Will Marshall on the meaning of Putin’s war on Ukraine.

A reprise of our Trade Fact launch last October, “Liberalism is Worth Defending.”

And Paul Bledsoe on ways to undo Europe’s natural gas dependency on Russia.

ABOUT ED

Ed Gresser is Vice President and Director for Trade and Global Markets at PPI.

Ed returns to PPI after working for the think tank from 2001-2011. He most recently served as the Assistant U.S. Trade Representative for Trade Policy and Economics at the Office of the United States Trade Representative (USTR). In this position, he led USTR’s economic research unit from 2015-2021, and chaired the 21-agency Trade Policy Staff Committee.

Ed began his career on Capitol Hill before serving USTR as Policy Advisor to USTR Charlene Barshefsky from 1998 to 2001. He then led PPI’s Trade and Global Markets Project from 2001 to 2011. After PPI, he co-founded and directed the independent think tank ProgressiveEconomy until rejoining USTR in 2015. In 2013, the Washington International Trade Association presented him with its Lighthouse Award, awarded annually to an individual or group for significant contributions to trade policy.

Ed is the author of Freedom from Want: American Liberalism and the Global Economy (2007).  He has published in a variety of journals and newspapers, and his research has been cited by leading academics and international organizations including the WTO, World Bank, and International Monetary Fund. He is a graduate of Stanford University and holds a Master’s Degree in International Affairs from Columbia Universities and a certificate from the Averell Harriman Institute for Advanced Study of the Soviet Union.

Trade Fact of the Week: Russian share of world GDP and trade: 1% to 2%

FACT:

Russian share of world GDP and trade: 1% to 2%


THE NUMBERS: 

GDP by country, IMF 2022 estimate

World.  $102.0 trillion
U.S.         $24.8 trilion
EU          $18.4 trillion
Russia.      $1.7 trillion

WHAT THEY MEAN:

As international sanctions responses to Russia’s attack on Ukraine evolve this week, what are they working with? Some measures of Russia’s place in the world economy along seven lines of data, covering GDP, trade, energy, currency trading, FDI, financial reserves, and scientific research:

GDP: Russia’s economy is more volatile than that of most other big countries, as it inflates rapidly when energy and metal prices rise and deflates fast when prices fall. This noted, the International Monetary Fund’s most recent estimate places Russian GDP at $1.7 trillion in 2022. This places it midway between Mexico’s $1.4 trillion and Canada’s $2.2 trillion, and about 1.5% of the $102 trillion world economy. Others in the same neighborhood include Brazil at $1.8 trillion, Taiwan at $1.6 trillion, and Indonesia at $1.2 trillion. IMF estimates for other big economies include: U.S. $25 trillion, China $18.5 trillion, EU $18.4 trillion, Japan $5.4 trillion, Germany $4.6 trillion, the U.K. $3.4 trillion, India $3.3 trillion, France $3.1 trillion, and Korea $1.9 trillion.

Trade: Russian exports vary, again with energy and metal prices, in a range from $200 billion to $400 billion per year. At the high end, this is about 2% of the world’s annual $20 trillion in goods exports. Relative to output, exports accounted for 25.5% of GDP in 2020, just below the worldwide 26.5% average. The EU is the main partner, buying 40% of Russian exports and providing 31% of imports; China is next as the market for 13% of Russian exports and source of 22% of imports. The U.S. is a minor player in both accounts, at about 5% each; for the U.S., Russia’s main significance is as a supplier of some specialty metals such as titanium and palladium.

Energy: DoE’s Energy Information Administration reports that Russia is the third-largest producer of petroleum in the world (after the United States and Saudi Arabia), and holds the world’s largest proven reserves of natural gas. With respect to trade, figures compiled by BP suggest that Russia accounts for 11.4% of world oil exports (7.4 million bbl/day out of 65.1 million), and a quarter of gas exports (238 billion cubic meters out of 940 billion. This means that the Russian government is more dependent on exports for revenue, and Russian private-sector businesses less dependent, than is the case for large manufacturing or agricultural exporting economies. About half of Russian oil exports go to the EU and a third to China; with respect to gas, determined by pipeline construction, 89% of exports go to the EU, Turkey, and Belarus.

Currency: The Bank of International Settlements’ most recent triennial report (2019) reports $46 billion in daily Russian currency turnover, or about 0.5% of the daily $8.3 trillion in worldwide currency trading.

Foreign Direct Investment: Russia’s role in currency trading is minimal; the Bank of International Settlements’ most recent triennial report (2019) reports $46 billion in daily Russian currency turnover, or about 0.5% of the daily $8.3 trillion in worldwide currency trading. As reported last November by UNCTAD, about $416 billion of the world’s $41.4 trillion in foreign direct investment stock are in Russia. Measured the other way, Russian firms and state enterprises hold a similar $379 billion in other countries. These figures, however, are likely large overstatements; IMF staff research suggests that about 60% of FDI in Russia comes from “foreign phantom corporations” — that is, “empty shell corporations with no real activities.”

Financial Reserves: The IMF reports Russian financial reserves, which presumably are less vaporous than FDI figures, at $630 billion. This is a large but not extraordinary sum, just below India’s $634 billion and not vastly above those of some smaller countries; for example, Israel is at $209 billion and the Czech Republic $175 billion. China’s reserves are the world’s largest at $3.4 trillion, with Japan next at $1.4 trillion.

Science: The OECD reports Russian spending on research and development at $44 billion, which is about 2% of an identified world total (including OECD members, China, Russia, Taiwan, and a few others) of $2.2 trillion. OECD places Russia’s R&D at 1% of GDP, similar to the level for Turkey and about 40% of the 2.5% OECD. The U.S. is at 3.1%; Israel and Korea have the highest known figure at 4.9% and 4.6%.

In sum, Russia is a large country and mid-tier economy. It is significant in energy production and exports (especially as a supplier for western Europe); it can use energy income to finance a large military establishment and a modest research base; and it has a large financial reserve but also likely relies heavily on energy exports to maintain this reserve. Otherwise, its role in global growth, investment, or invention is modest.


FURTHER READING

The Embassy of Ukraine in D.C.

And an update on U.S. policy, from the U.S. Embassy in Ukraine.

Sanctions background

White House staff review Russia energy and financial sanctions, as of Feb. 22.

European Union decisions.

The Japan Foreign Ministry can be found here.

The Treasury Department’s Office of Foreign Assets Control lists/reviews existing sanctions.

And a 2009 assessment of economic sanctions as a foreign policy tool, from Peterson Institute for International Economics scholars Hufbauer/Schott/Elliott/Clegg.

Background

The U.S. Energy Information Agency on Russia’s role in gas and oil.

PPI’s Paul Bledsoe’s report on natural gas, including the role of Russian gas.

The IMF economic database, with GDP, exports, debt, etc.

… and IMF staff on “phantom FDI” in Russia and elsewhere.

The OECD’s “Main Science and Technology Indicators.”


ABOUT ED

Ed Gresser is Vice President and Director for Trade and Global Markets at PPI.

Ed returns to PPI after working for the think tank from 2001-2011. He most recently served as the Assistant U.S. Trade Representative for Trade Policy and Economics at the Office of the United States Trade Representative (USTR). In this position, he led USTR’s economic research unit from 2015-2021, and chaired the 21-agency Trade Policy Staff Committee.

Ed began his career on Capitol Hill before serving USTR as Policy Advisor to USTR Charlene Barshefsky from 1998 to 2001. He then led PPI’s Trade and Global Markets Project from 2001 to 2011. After PPI, he co-founded and directed the independent think tank ProgressiveEconomy until rejoining USTR in 2015. In 2013, the Washington International Trade Association presented him with its Lighthouse Award, awarded annually to an individual or group for significant contributions to trade policy.

Ed is the author of Freedom from Want: American Liberalism and the Global Economy (2007).  He has published in a variety of journals and newspapers, and his research has been cited by leading academics and international organizations including the WTO, World Bank, and International Monetary Fund. He is a graduate of Stanford University and holds a Master’s Degree in International Affairs from Columbia Universities and a certificate from the Averell Harriman Institute for Advanced Study of the Soviet Union.


Read the full email and sign up for the Trade Fact of the Week

Trade Fact of the Week: The U.S.-Canada trade relationship is the largest in world history

FACT:

The U.S.-Canada trade relationship is the largest in world history.


THE NUMBERS: 

Top six U.S. goods + services trade partners in 2021*

* Estimates for services based on the nine months available data. Goods trade are full-year figures.


WHAT THEY MEAN:

Then-President Reagan in September of 1988, eloquently closing as he signs the U.S.-Canada Free Trade Agreement: “Let the 5,000-mile border between Canada and the United States stand as a symbol for the future. No soldier stands guard to protect it. Barbed wire does not deface it. And no invisible barrier of economic suspicion and fear will extend it. Let it forever be not a point of division but a meeting place between our great and true friends.”

A generation into this future:

(1)      Canada accounts for a ninth of all U.S. goods trade and (with some uncertainty as final services data aren’t yet in) about a fifteenth of services trade. The total places Canada slightly ahead of Mexico and China as top trade partner, and thus as the largest single trade relationship in the world.  Matching this against history is tricky — should one compare last year’s $740 billion in U.S.-Canada trade to the $95 trillion in world GDP? To the $20 trillion in trade flows? To something else? But in the simplest sense, counting the nominal value of paper dollars or shiny loonies, last year’s U.S.-Canada relationship was the largest two-way trade relationship ever.

(2)    Canada is the top U.S. export market for 29 states, and second-ranked for another 13. Canadians buy more American goods ($308 billion in 2021) than the 27 EU countries ($272 billion) combined; or, alternatively, nearly as much as China ($150 billion) plus Japan ($75 billion) plus Korea ($66 billion) plus Hong Kong ($30 billion) plus Taiwan ($37 billion). Only the U.K. is a larger buyer of American services.

(3)    President Reagan seems to have low-balled the border length a bit; by the International Border Commission’s estimate, it is 5,528 miles, including 4,000 along the “continental U.S.” northern border and 1,500 on Alaska’s western and southern frontier. Either way, as events elsewhere in the world continually remind us, a friendly, unguarded, border-cum-meeting-place, where the most troubling events are COVID-related tourism interruptions and temporary blockages of auto-parts shipments, is (a) a rarity in history, (b) something to greatly value, and (c) a heritage to protect.


FURTHER READING

Governments 

Then-President Reagan signs the U.S.-Canada FTA, September 1988.

USTR’s “USMCA” page, a generation later.

Trade section for the U.S. Embassy in Ottawa.

… and for the Canadian Embassy on vice versa.

Borders

Official data on state, provincial, and other border facts from the International Border Commission.

Wait times on the Ambassador Bridge, said to be the world’s single busiest international commercial crossing, from U.S. Customs and Border Patrol.

The Canadian Customs Border Services Agency tracks wait times at the 126 U.S.-Canada crossing points.

Exasperated comment from Michigan Gov. Whitmer.

The Missoulian reports on protests, blockages, and local reactions at the Sweetgrass (MT) crossing point.

Remarks from Deputy Prime Minister Chrystia Freeland regarding the blockades and the Emergencies Act


ABOUT ED

Ed Gresser is Vice President and Director for Trade and Global Markets at PPI.

Ed returns to PPI after working for the think tank from 2001-2011. He most recently served as the Assistant U.S. Trade Representative for Trade Policy and Economics at the Office of the United States Trade Representative (USTR). In this position, he led USTR’s economic research unit from 2015-2021, and chaired the 21-agency Trade Policy Staff Committee.

Ed began his career on Capitol Hill before serving USTR as Policy Advisor to USTR Charlene Barshefsky from 1998 to 2001. He then led PPI’s Trade and Global Markets Project from 2001 to 2011. After PPI, he co-founded and directed the independent think tank ProgressiveEconomy until rejoining USTR in 2015. In 2013, the Washington International Trade Association presented him with its Lighthouse Award, awarded annually to an individual or group for significant contributions to trade policy.

Ed is the author of Freedom from Want: American Liberalism and the Global Economy (2007).  He has published in a variety of journals and newspapers, and his research has been cited by leading academics and international organizations including the WTO, World Bank, and International Monetary Fund. He is a graduate of Stanford University and holds a Master’s Degree in International Affairs from Columbia Universities and a certificate from the Averell Harriman Institute for Advanced Study of the Soviet Union.


Read the full email and sign up for the Trade Fact of the Week

Trade Fact of the Week: U.S. has lost 35,000 exporting businesses since the mid-2010s

FACT:

U.S. has lost 35,000 exporting businesses since the mid-2010s.


THE NUMBERS: 

U.S. export share of GDP:

2021:        10.8%
2020:       10.2%
2019:        11.8%
2018:        12.3%
2014:        13.5%


WHAT THEY MEAN:

Three Census Bureau reports provoke some thoughts on the U.S.’ export economy, workers and pay, growth with and without inflation, and the next three years of policy:

(1)  The “FT-900,” released Tuesday morning, is the Census’ regular monthly summary of the basic U.S. trade data, with figures on exports, imports, goods, services, countries, and so on. Tuesday’s edition covers December 2021, and is a good point for stock-taking as it covers the full year 2021, the Biden/Harris administration’s first year in office. This found U.S. exports at $2.53 billion: 2.1 million cars and $2 billion in sports and fishing equipment; 170 million cubic meters of liquefied natural gas; $59 billion in telecommunications, information, and computer services; 25 million tons of wheat; $5 billion in wine, liquors, and beer; $30 billion worth of medical devices, etc. This represents a $394 billion jump from $2.13 trillion in COVID-stricken 2020, which in one way is a very impressive pace of growth, unmatched since 2010 but in another way essentially brings exports back to the pre-COVID levels of $2.53 trillion in 2019 and $2.54 billion in 2018.

(2)  The second report, out last November, is “U.S. Exporting Firms by Demographics”.  This is a deep dive into the nature of the businesses that produce these things, using tax, trade, and other data for 2018 to provide a survey of the ownership, employment, payrolls, and foreign markets of 178,000* of that year’s 293,000 known U.S. exporters.  Some findings:

*    Exporters offer high employment and pay:  Exporting businesses averaged 274 workers, at payroll per worker of $69,000.  Non-exporters, by comparison, employed 14 workers on payroll at $44,000 per worker. About 16,500 exporting businesses are large, presumably publicly held forms (in Census’ terminology, “unclassifiable” by ownership type).  Dropping these from the tables, U.S. exporters averaged employed 54 workers, on payroll at $64,210 per worker. The comparable figures for “unclassifiable by ownership type” non-exporters were 10 workers and $41,027 per worker. The sharpest pay premium appears to be among the 23,500 women-owned exporters: They average 38 workers at $61,000 in payroll per worker, as against 9 workers and $38,000 in women-owned non-exporting businesses.

*    Diverse business ownership is a national asset:  An ethnically and racially diverse business community appears to help the U.S. find customers and income abroad.  As one example, about 1 in 12 U.S. exporters sell to Africa; for African American owned firms, the share is 1 in 7. A similar comparison from a different angle finds Hispanic-owned firms making up 5.5% of all U.S. exporters, but 10% of exporters to Latin America and 12% of exporters to Central America specifically.

(3)  Finally, “Profile of U.S. Importing and Exporting Companies,” also from this past November (though in “preliminary” form, pending a final count in April) counts the total number of exporting businesses as of early 2020.  It glumly reports 270,000 such firms, about 35,000 below the peak count of 305,000 in 2013/2014, and 23,000 below the 293,000 reported for 2016 and 2018. Mirroring this decline in numbers, the export sector’s place in the U.S. economy has diminished in recent years, falling as a share of GDP from a 13.5% peak in 2013 and 2014 to 11.8% in 2018, and then 10.3% of GDP in 2020 — the lowest level since 2006.


Against this long-term backdrop, the big jump in yesterday’s FT-900 is good news, but still leaves the U.S. exporting well short of the role it held five or 10 years ago.

What explains the erosion?  And will it last?  One obvious but presumably transient contributor is the impact of COVID-related economic closures (especially in the first half of 2020).  These affected almost all exporting sectors, and are still powerful in “transport” and “travel” services, whose exports remain far below pre-COVID levels. Another is recent policy choices: Trump-era tariffs provoked direct retaliations against U.S. exporters, and may also, by raising the cost of parts and materials for American manufacturers and farmers, be contributing to a slower erosion of export competitiveness.  Beyond this, and not yet felt, implementation of the Asia-based “Regional Closer Economic Partnership” — a 15-country Asia-Pacific trade agreement joining China, Japan, Korea, Australia, New Zealand, and the 10 ASEAN members, together accounting for about a third of all world imports outside the U.S. — presages a Pacific tariff tilt in favor of the cars, wines, fishing rods, wheat, etc. produced by U.S. competitors.

In sum, Census numbers say many good things about the U.S. export economy in 2021.  And they suggest some ways for exporters might contribute more to both workers and macroeconomic health in the next few years.  But they also offer grounds for concern, and reasons for energetic policy.

Note: PPI Trade and Global Markets staff thank Census staff for helping with interpretation of several of these releases, and more generally for their sustained excellence in statistical work in trade and other areas.


FURTHER READING

From Census 

The “FT-900” series has the basic monthly trade figures, updated Tuesday for full-year 2021.

… and the accompanying “Historical Series” has a convenient one-page annual summary of imports, exports and balances from 1960 through 2021.

And “U.S. Exporting Firms by Demographics” looks deeply into 178,000 of 2018’s 293,000 exporting businesses* by owner type: male/female; race and ethnicity (with white, African American, Hispanic, Asian American, Native American, and Pacific Islander); veteran ownership; and 200 export markets ranging in scale from “Vanuatu” and to “Africa” to “EU-27” and “All Countries.” Available with data for 2018, 2017, 2012, and 2007.

* The 115,000 whose ownership couldn’t be accounted for include non-employing firms, agricultural producers, and businesses located in Puerto Rico and the U.S. insular territories.

The “Profile of Importing and Exporting Companies” looks at exporters and importers by size, with state-by-state figures, SMEs, 25 countries, sectors, etc.

Also on exporters, from two of Census’ sister Commerce Department agencies

Writing for the Minority Business Development Agency in 2015, Sharon Freeman reviews export opportunities and challenges for African American, Hispanic, Asian American, and Native American small businesses.

And the International Trade Administration summarizes research on the count and nature of “jobs supported by exports.”

And overseas

ASEAN announces entry into force for RCEP.


ABOUT ED

Ed Gresser is Vice President and Director for Trade and Global Markets at PPI.

Ed returns to PPI after working for the think tank from 2001-2011. He most recently served as the Assistant U.S. Trade Representative for Trade Policy and Economics at the Office of the United States Trade Representative (USTR). In this position, he led USTR’s economic research unit from 2015-2021, and chaired the 21-agency Trade Policy Staff Committee.

Ed began his career on Capitol Hill before serving USTR as Policy Advisor to USTR Charlene Barshefsky from 1998 to 2001. He then led PPI’s Trade and Global Markets Project from 2001 to 2011. After PPI, he co-founded and directed the independent think tank ProgressiveEconomy until rejoining USTR in 2015. In 2013, the Washington International Trade Association presented him with its Lighthouse Award, awarded annually to an individual or group for significant contributions to trade policy.

Ed is the author of Freedom from Want: American Liberalism and the Global Economy (2007).  He has published in a variety of journals and newspapers, and his research has been cited by leading academics and international organizations including the WTO, World Bank, and International Monetary Fund. He is a graduate of Stanford University and holds a Master’s Degree in International Affairs from Columbia Universities and a certificate from the Averell Harriman Institute for Advanced Study of the Soviet Union.


Read the full email and sign up for the Trade Fact of the Week

PPI Applauds Passage of America COMPETES Act

Today, the House of Representatives passed the America COMPETES Act, which will help ease supply chain tension, invest in American innovation, and strengthen our standing in the race to technological leadership.

Aaron White, Director of Communications for the Progressive Policy Institute (PPI) released the following statement:

“The Progressive Policy Institute is encouraged to see the House passage of the America COMPETES Act, a companion bill to the Senate’s bipartisan United States Innovation and Competition Act, which will invest in American innovation, ease the tensions on U.S. and global supply chains, and strengthen America’s standing in our race with China for technological leadership.

“This bill has the potential to spur long-term growth through significant investment in scientific innovation and new-age manufacturing and logistics advancements. The American technology sector has long been a leading global innovator; by investing in emerging technologies, research and development, the future workforce and the U.S. high-tech productive base, America can once again lead the world with a robust 21st century economy and expand opportunity for generations to come.

“Notably, it is unfortunate that House Republicans refused to vote for legislation that mirrored bipartisan bills and committee provisions, particularly given the Senate was willing to compromise and pass their companion bill on a bipartisan vote months ago. Important issues like supporting American innovation, technological leadership, and strengthening our economy should transcend partisanship, especially as we recover from the pandemic.

“We must acknowledge that there is still room for improvement. As the Senate and House begin the conference process for the United States Innovation and Competition Act and the America COMPETES Act, PPI encourages conference committee members to more closely examine the trade provisions within the final bill, and take the time needed — through hearings, public comments or other means — to consider the wide ranging implications for U.S. exporters and importers of several of the bill’s trade provisions.

“We also encourage the conference committee to consider reverse the Trump and GOP-era tax increase on scientific research that took effect this year. If left in place, this tax change threatens to undo much of the good that this legislation would do for American innovation. Finally, we hope lawmakers will wait for an official score from the Congressional Budget Office before voting on passage of the bill in its final form. Even if some public investments generate high enough returns to justify borrowing to pay for them, as PPI believes may be the case for some provisions in this bill, it is essential that our leaders have the necessary information to consider all the costs and tradeoffs.

“We thank Speaker Pelosi and Majority Leader Schumer for their continued work in advancing this legislative package, and congratulate President Biden for spearheading this historic advancement in American economic leadership. The finished product will be a major win for American workers, consumers, and manufacturers alike.”

###

Trade Fact of the Week: Florida’s sea turtle nest counts are growing

FACT:

Florida’s sea turtle nest counts are growing.


THE NUMBERS: 

Average counts of green turtle nests at 27 Florida “core index beaches,” two-year average*

2020-2021    ~23,000 nests
2010-2011     ~10,000 nests
2000-2001    ~4,000 nests
1990-1991      ~1,000 nests

* Florida Wildlife Commission; using two-year averages as green turtle nesting totals appear to vary in a two-year cycle.  These are not total statewide (or U.S.) nesting estimates; they are counts of nesting at 27 long-studied beaches, representing about 10% of the known Florida nesting beaches.

WHAT THEY MEAN:

Here’s a good idea:  Somewhere around 320 B.C., proto-conservationist Mencius offers King Hui of Liang (near present-day Kaifeng) a simple solution to a complex problem:

“If you ban nets with fine mesh from ponds, there will be more fish and turtles than the people can eat.  If you ban axes from the forests on the hillsides except in the proper season, there will be more timber than the people can use.”  

Twenty-three centuries later, and in the ocean rather than in ponds, all seven sea turtle species are “endangered,” “threatened,” or “critically endangered.” As large, armored reptiles with few natural predators, these turtles are very tough. Their nesting season this summer will be roughly the 150 millionth; the series has outlasted not only the last seven ice ages, but the end-of-Cretaceous asteroid that wiped out their early contemporaries the ammonite and the plesiosaur.

But maybe they are no longer tough enough. Some are caught and traded for shell jewelry.  Many more fall victim to “by-catch,” as shrimp and fishing fleets suck them into bag-shaped shrimp trawl nets or catch them on long lines meant for shark and tuna.  And many more, with beach erosion and harvesting of nests for eggs, never hatch at all.  This series of losses accelerated in the mid-20th century; to take one example, the global estimate of nesting leatherback females done by the International Union for the Conservation of Nature dropped from about 90,000 in 1980 to 54,000 in 2010.

How to respond?  Sea turtle protection in the United States may, tentatively, be succeeding, with a mix of three measures:

(1)    Trade restriction:  The 184 countries and territories in the Convention on International Trade in Endangered Species, the world’s first international trade-and-environment agreement, listed all sea turtles in ‘Appendix I,’ in the 1980s, banning trade in turtle jewelry and other products.

(2)    By-catch reduction:  To reduce by-catch, the United States in 1987 banned sale or import of shrimp caught by boats which do not use Turtle Excluder Devices or “TEDs.”  These are barred metal grills — something like the wide meshes like those Mencius recommended for fishnets in ponds — placed in the neck of the bag-shaped shrimp nets to let mistakenly captured turtles swim out.  They cost about $375.  Each summer, the State Department publishes a list of countries which, through compliance with this rule, can export ocean-caught shrimp to the U.S.  The most recent certifies 41 countries and territories as “equivalent” to the U.S. in turtle protection, and thus able to export wild-caught shrimp to the United States.

(3)    Beach protection:  National and state laws, and local regulations set aside beaches for nesting, and limit their use.  As an example, Florida’s Marine Turtle Conservation Act (passed in 1991 under then-Gov. Lawton Chiles) bars over-building, lighting schemes that can disorient hatchlings in season, and disruption of nesting by tourists.

Does it work?  Tentatively, yes.  Florida’s green turtle population is a case in point:  while totals vary up and down each year, Florida Wildlife Commission figures shows about 20 times as many nests in the 2020/2021 season as there were in the early 190s, when the national TED and Florida beach protection laws began.  Kemp’s Ridley turtle nesting levels (almost exclusively on a single stretch of Mexican beach, though with outposts in Texas and Cape Hatteras) are up from a near-extinction low of 200 in the 1980s to about 5000 a decade ago, and perhaps as many as 20,000 in 2020.  On a larger scale, the International Union for the Conservation of Nature’s estimate of leatherback nesting females has risen from 54,000 in 2010 to 64,000 as of 2020, and looks ahead under current population trends (driven by strong growth in Atlantic populations) to 79,000-110,000 by 2040.

Just a start, of course.  Hardly Mencius’ “more than you can eat”; and (as an example) the IUCN’s optimistic take on Atlantic leatherbacks is offset by continuing Pacific leatherback decline.  And apparently positive trends remain open to newer questions about rising ocean temperatures, acidification, plastics accumulation, and beach erosion as sea levels rise.  But this said, a promising start and some validation for Mencius’ rather old, still simple, and still good idea.

FURTHER READING


The Florida Wildlife Commission reports on nesting totals for five turtle species at “index beaches” from 1989 forward.

A worried World Wildlife Fund fact-sheet.

The IUCN has assessments for all seven sea turtle species; optimistic projections for the leatherback here.

Reports from:

Florida: UCF ponders growth in small-turtle nesting.

… and Fort Myers explains beach lighting rules in the May to October nesting season.

Hawaii: NOAA’s Pacific Islands office on hawksbills in Hawaii.

Texas: The National Park Service on Kemp’s Ridley nesting.

Australia: Australia’s Department of Agriculture, Water, and the Environment on flatback turtle conservation.

Oman: The Oman Times reports on green turtle nesting and tourism at Ras al-Hadd in Oman (certified as U.S.-equivalent in turtle protection).

Belize: Oceana reports on hawskbills.

Policy

The State Department announces 2021 shrimp trade certifications: Oman, Australia, Belize joined by Bahamas, Malaysia, Fiji, et al.

The CITES (Convention on the International Trade in Endangered Species) homepage.

Sea turtle protection page from the National Oceanic and Atmospheric Administration.

Litigation

A famous WTO dispute of the 1990s, “DS-58”, wound up validating the U.S. TED rule against complaints.

And last…

Mencius, with the brief passage on nets, excluder devices and turtles in Chapter A3.

In A New Voyage Round the World (1699), English professional navigator, part-time pirate, and amateur naturalist William Dampier discusses the massive Caribbean green turtle populations of the 17th century:

“I heard of a monstrous green turtle once taken at Port Royal in the Bay of Campeachy that was four foot deep from the back to the belly, and the belly six foot broad.  Captain Roch’s son, of about nine or ten years of age, went in it as in a boat on board his father’s ship, about a quarter mile from the shore.  … One thing is very strange and remarkable in these Creatures; that in the breeding-time they leave for two or three months their common Haunts, where they feed most of the year, and resort to other places only to lay their Eggs: and ‘tis not thought that they eat any thing during this Season: so both the He’s and the She’s grow very lean. … Altho’ multitudes of Turtles go from their common places of feeding and abode, to those laying eggs:  and at the time the Turtle resort to these places to lay their Eggs, they are accompanied by abundance of Fish, especially Sharks; the places that the Turtle then leave being at that time destitute of Fish, which follow the Turtle.”

Dampier’s New Voyage, with the turtle passage in Chapter 5.

ABOUT ED

Ed Gresser is Vice President and Director for Trade and Global Markets at PPI.

Ed returns to PPI after working for the think tank from 2001-2011. He most recently served as the Assistant U.S. Trade Representative for Trade Policy and Economics at the Office of the United States Trade Representative (USTR). In this position, he led USTR’s economic research unit from 2015-2021, and chaired the 21-agency Trade Policy Staff Committee.

Ed began his career on Capitol Hill before serving USTR as Policy Advisor to USTR Charlene Barshefsky from 1998 to 2001. He then led PPI’s Trade and Global Markets Project from 2001 to 2011. After PPI, he co-founded and directed the independent think tank ProgressiveEconomy until rejoining USTR in 2015. In 2013, the Washington International Trade Association presented him with its Lighthouse Award, awarded annually to an individual or group for significant contributions to trade policy.

Ed is the author of Freedom from Want: American Liberalism and the Global Economy (2007).  He has published in a variety of journals and newspapers, and his research has been cited by leading academics and international organizations including the WTO, World Bank, and International Monetary Fund. He is a graduate of Stanford University and holds a Master’s Degree in International Affairs from Columbia Universities and a certificate from the Averell Harriman Institute for Advanced Study of the Soviet Union.

Read the full email and sign up for the Trade Fact of the Week

Trade Fact of the Week: Energy accounts for 3/5 of Russian exports

FACT:

Energy accounts for 3/5 of Russian exports.


THE NUMBERS: 

Russia GDP (IMF estimates, currency-basis) 

2021    $1.7 trillion
2016    $1.3 trillion
2013    $2.3 trillion
2009    $1.3 trillion


WHAT THEY MEAN:

Most economies “grow” incrementally and undramatically (with occasional incremental dips in recessions).  Through productivity growth, investment, and slight rises in the populations of consumers and workers, they steadily add a couple of percentage points each year.  The Russian economy looks different: More like an inflating and deflating bellows, nearly doubling in size from 2009 to 2013, then contracting by nearly half over the next three years, and since 2016 another burst of growth.

Why?  The pattern reflects Russia’s exceptionally high dependence on energy production and energy sales.  According to the WTO’s Trade Profiles 2021, an annual country-by-country summary of imports, exports, partners and balances for 197 countries, “fuels and mining products” accounted for 59% of Russian exports in 2020.  This figure is quite large — among developed economies, only Norway’s is higher — and likely understates the actual role of energy in Russian trade.  The WTO lists Russia’s top four exports in 2020 as:

Crude oil, $122 billion;
Refined petroleum products, $67 billion;
Coal, $16 billion; and
Natural gas, $10 billion.

These four products combine for $215 billion, or 65% of $332 billion in total Russian goods exports that year, with the “refined petroleum products” category, presumably including include some goods classified as manufactures rather than primary “fuels and mining” products.  Overall, Russia was the world’s second-ranking exporter of these goods; the U.S. ranked second, but with energy making up a much smaller 15% of the U.S.’ $1.4 trillion in exports.

Two frequent consequences of this level of dependence on energy sales:

(1)    Countries this reliant on energy and metal ore exports are economically volatile — they boom when world prices rise and crash when prices fall — unless they have especially sophisticated ways of banking excess resource rents in good years.  Thus the odd pattern of Russian GDP.  With large shares of GDP and government revenue coming through a small group of companies and individuals, they also frequently (though again not always) develop political systems centralized around a few government officials and top executives of state or quasi-private enterprises.  The Russian examples are Gazprom, Rosneft, Lukoil, and a few similar organizations.

(2)    Their customers need to diversify sources, so as to avoid reliance on potentially unstable partners.  Paul Bledsoe examines this question in PPI’s most recent energy and climate paper, reviewing the implications of Western and Central European reliance on Russian natural gas for heating and electricity.  He suggests an important place for the United States as an alternative source for European energy needs:

“New sources of gas, including liquefied natural gas (LNG) imports from the United States and other clean sources, can reduce the EU’s reliance on methane-heavy Russian gas. But of course, that will require the United States and other exporters to drive down methane and carbon dioxide emissions from the lifecycle as close to zero as possible, and verify their reductions with credible methodologies.  Moreover, the geopolitical costs of Russian gas continue to plague the EU broadly, and Ukraine and other Eastern European nations specifically. EU imports of Russian gas have actually increased since Moscow’s illegal annexation of the Crimea in 2015. Over time, limiting Russian gas imports thus could diminish its political leverage over Europe while also helping the EU achieve its climate goals.”


Don’t miss this PPI report by Paul Bledsoe

The report covers natural gas, Atlantic economics, and European security. Read it below:


FURTHER READING

Read PPI’s Bledsoe on natural gas, Atlantic economics, and European security here.

And read this from PPI President Will Marshall on the Biden administration, Putinist threats, and re-anchoring American foreign policy in liberal and democratic values.

Data 

The World Bank’s Russia Economic Report can be found here.

The WTO’s World Trade Profiles has exports/imports/partners by country for 197 economies can be found here.

Background reading

Anna Politkovskaya’s essay collection “Putin’s Russia: Life in a Failing Democracy,” on Russian life and politics circa 2005:

The State Department’s European and Eurasian Affairs Bureau can be found here.

The European Union is Russia’s main trading partner, buying 41% of Russian exports and providing 34% of Russian imports in 2020. Read about the EU’s Moscow mission.

The Ukrainian Embassy in D.C., can be found here.

Read about Russian gas giant Gazprom.


ABOUT ED

Ed Gresser is Vice President and Director for Trade and Global Markets at PPI.

Ed returns to PPI after working for the think tank from 2001-2011. He most recently served as the Assistant U.S. Trade Representative for Trade Policy and Economics at the Office of the United States Trade Representative (USTR). In this position, he led USTR’s economic research unit from 2015-2021, and chaired the 21-agency Trade Policy Staff Committee.

Ed began his career on Capitol Hill before serving USTR as Policy Advisor to USTR Charlene Barshefsky from 1998 to 2001. He then led PPI’s Trade and Global Markets Project from 2001 to 2011. After PPI, he co-founded and directed the independent think tank ProgressiveEconomy until rejoining USTR in 2015. In 2013, the Washington International Trade Association presented him with its Lighthouse Award, awarded annually to an individual or group for significant contributions to trade policy.

Ed is the author of Freedom from Want: American Liberalism and the Global Economy (2007).  He has published in a variety of journals and newspapers, and his research has been cited by leading academics and international organizations including the WTO, World Bank, and International Monetary Fund. He is a graduate of Stanford University and holds a Master’s Degree in International Affairs from Columbia Universities and a certificate from the Averell Harriman Institute for Advanced Study of the Soviet Union.


Read the full email and sign up for the Trade Fact of the Week

Trade Fact of the Week: The U.S. Generalized System of Preferences program has been expired for more than a year

FACT:

The U.S. Generalized System of Preferences program has been expired for more than a year.


THE NUMBERS: 

GSP imports, 2020 –

tons of Ukrainian pickles
3,700 traditional Mongolian ger (nomadic living tents)
11,900 liters of Georgian wine
1.5 tons of Pakistani spice mix
$5 million in Namibian stonework
412 tons of taro root from Tonga and Samoa
90,000 Rwandan travel bags
492 tons of Fijian ginger (candied and sushi-grade)
1 million dog collars and leashes from Cambodia
14,000 Senegalese wicker baskets
15 tons of vegetable oil from Timor-Leste
$9.5 million in Armenian-made golden jewelry
217 tons of South African essential oils (eucalyptus, orange, lemon, grapefruit)
27.3 million Thai orchids
870,000 Haitian-woven flags
32,700 Bolivian-made wooden doors


WHAT THEY MEAN:

The U.S.’ oldest and largest effort to help the poor abroad is the “Generalized System of Preferences”, or “GSP” for short.  Dating to 1974, it waives tariffs on about 3,500 types of products (more precisely, on 3,500 “tariff lines”) from 119 low- and middle-income countries meeting 15 eligibility criteria covering cooperation against terrorism, labor standards, intellectual property, expropriation, trade policy, and other issues.  The law authorizing GSP benefits lapsed at the end of 2020, so for a year the program has been stopped.  As Congress works on renewal, PPI Vice President Ed Gresser – who among other things directly oversaw GSP system administration from 2015-2020 – has observations and ideas in PPI’s newest policy paper:


By way of background, GSP is fairly simple. By waiving U.S. tariffs – 7.0% on flags, 9.6% on pickles, 2.3% on fresh taro root, etc. – imposed on things made or grown in places like Haiti, Ukraine, and the Pacific Islands, it encourages buyers otherwise drawn to the EU, China, or other larger suppliers to these smaller and poorer countries, helping them diversify their economies and create better job opportunities. Australia, EU, Canada, Japan, and other high-income countries have their own GSP programs launched around the same time as the U.S. GSP; other countries such as China, Taiwan, Chile, and Korea have created their own similar systems more recently.

The program’s scale is modest.  Imports of variously picturesque and mundane GSP products totaled $16.9 billion in 2020 – 0.8% of the U.S.’ $2.351 trillion in total goods imports, and (more relevant) 11.1% of the $152 billion in imports from the 119 participating countries – but the impact is useful.  Reviewing the results in 2016 (along with those of regional preference programs AGOA and CBI) the Obama administration concluded that “U.S. trade preference programs have encouraged exports from developing countries, with particular effect in value-added and labor-intensive goods … This is corroborated by a large body of economic literature [which has] also found that U.S. trade preference programs have made a contribution to the reduction of poverty.”

Gresser’s paper applauds Congressional interest in renewing the system – the Senate has passed a reauthorization bill and House Democrats have introduced one which differs in some areas from the Senate bill but shares much with it – noting that reauthorization will be good for the countries participating in the system and, in a small but tangible way, for the Biden administration’s effort to show that America “is back”.  It also endorses Congress’ interest in rethinking aspects of the program.  GSP’s list of “eligibility criteria” (that is, a set of policy goals a country needs to meet to qualify for tariff waivers) mainly dates to the 1970s and 1980s.  So does its list of “import-sensitive” products excluded as overly competitive with U.S. goods and its “Competitive Need Limits” on the levels of particular products a country is allowed to send duty-free.  All these could probably use a fresh look.

On the other hand, the paper expresses concern about a large proliferation of new eligibility rules in both the Senate and House Democratic bills.  It argues for dialing this back a bit and balancing new rules with new product coverage (as a complementary proposal by Representatives Stephanie Murphy (D-Fla) and Jack Walorski (R-Ind) suggests).  Three thoughts as Congress moves ahead:

1.    Set priorities when adding new eligibility rules.

The current list of 15 eligibility criteria includes some moribund issues (“domination by the international Communist movement”), misses some contemporary concerns, and overall is a bit of a hodge-podge.  But it also has some virtues, including brevity: the list is short enough to set clear priorities, so governments of GSP countries know what they need to do to retain benefits.  Both reauthorization bills risk losing this virtue by adding many new criteria: human rights, poverty reduction, environment, gender policy, anti-corruption, economic reform, microcredit availability, political participation, rule of law, digital trade, and others.  Though all appear well-intended, expansion on this scale can overload a small system, and risk forcing wholesale unintended expulsions of countries which fall short on one or two of many criteria, or pushing administrations into unsystematic and essentially arbitrary enforcement to avoid such an outcome.

2.    Recognize good-faith effort.

A second virtue is that the current eligibility criteria are flexibly written, enabling officials administering the system to recognize good-faith if imperfect efforts to comply.  Overly strict rules for low-income countries can be unrealistic: “low-income countries often have well-trained and well-intentioned leaders and senior bureaucrats who design good policies … [but] few such countries have the deep and professional civil services needed to effectively [implement] these policies uniformly and nationwide.”  Whether adding new criteria or updating old ones, good-faith effort by well-intentioned governments should continue to get credit.

3.    Balance new eligibility rules with broader benefits. 

Finally, new looks at old eligibility rules should go together with new looks at old limits on benefits.  GSP rules set in the 1970s excludes some significant categories of goods (clothes, shoes, glassware, watches) and also, under an unusual feature known as “Competitive Need Limitations”, remove products from a country’s GSP portfolio when it becomes too good at making them.  The paper suggests reconsidering some of the product exclusions, for example that of shoes not made in the United States, and applauds the Murphy/Walorski proposal’s reforms to the ”Competitive Need Limitation” feature of GSP.

FURTHER READING

>> PPI’s Gresser on GSP Renewal – “Trade, the Poor, and America is Back” – Read the Report 

Background:

The U.S. Trade Representative’s GSP Guidebook explains GSP program goals, product coverage, eligibility rules, and country participation.

The Obama administration (2016) evaluates U.S. trade preference programs (including GSP and also the African Growth and Opportunity Act and the Caribbean Basin Economic Recovery Act) and their records on poverty alleviation.

Some beneficiaries:

The Embassy of Ukraine explains GSP benefits to potential U.S. customers.

The Fiji Sun reports on a U.S. official’s 2018 visit to a GSP-beneficiary ginger factory.

USTR presentation on benefits for Mongolia (tungsten concentrate, leather bags, pine nuts, traditional “ger” tents).

Ecuadoran Ambassador Ivonne Baki updates Quito press on GSP reauthorization.

… and a Delaware vendor of Mongolian “ger” (traditional tents).

Renewal proposals from:

Senate Finance Committee (included in larger bill and passed in 2021).

House Ways and Means Democrats.

Reps. Murphy & Walorski.

… and for comparison, the current GSP statute.

And some international comparisons: 

Japan’s Ministry of Foreign Affairs explains the Japanese GSP.

The European Union.

Australia.

China’s “least-developed country” tariff waiver.


ABOUT ED

Ed Gresser is Vice President and Director for Trade and Global Markets at PPI.

Ed returns to PPI after working for the think tank from 2001-2011. He most recently served as the Assistant U.S. Trade Representative for Trade Policy and Economics at the Office of the United States Trade Representative (USTR). In this position, he led USTR’s economic research unit from 2015-2021, and chaired the 21-agency Trade Policy Staff Committee.

Ed began his career on Capitol Hill before serving USTR as Policy Advisor to USTR Charlene Barshefsky from 1998 to 2001. He then led PPI’s Trade and Global Markets Project from 2001 to 2011. After PPI, he co-founded and directed the independent think tank ProgressiveEconomy until rejoining USTR in 2015. In 2013, the Washington International Trade Association presented him with its Lighthouse Award, awarded annually to an individual or group for significant contributions to trade policy.

Ed is the author of Freedom from Want: American Liberalism and the Global Economy (2007).  He has published in a variety of journals and newspapers, and his research has been cited by leading academics and international organizations including the WTO, World Bank, and International Monetary Fund. He is a graduate of Stanford University and holds a Master’s Degree in International Affairs from Columbia Universities and a certificate from the Averell Harriman Institute for Advanced Study of the Soviet Union.

Read the full email and sign up for the Trade Fact of the Week