PPI’s Trade Fact of the Week: Per the International Labour Organization, ‘Uzbek cotton is free from systemic child labour and forced labour’

FACT: Per the International Labour Organization, “Uzbek cotton is free from systemic child labour and forced labour.”

THE NUMBERS: ILO estimates of forced labor worldwide –

2021:  27.6 million
2016:  24.9 million
2011:   20.9 million

WHAT THEY MEAN:

A grim series of statistics, drawn from last week’s International Labour Organization report on worldwide forced labor in 2021:

“49.6 million people were living in modern slavery in 2021, of which 27.6 million were in forced labour and 22 million in forced marriage. Of the 27.6 million people in forced labour, 17.3 million are exploited in the private sector; 6.3 million in forced commercial sexual exploitation, and 3.9 million in forced labour imposed by states.”

The 27.6 million total — up by 2.7 million from the 24.9 million estimated in the ILO’s 2017 report — combines several different conditions under the broad term “forced labor.” The most common of these, found in 36% of cases, involves workers trapped in jobs by withholding of pay; others involve debt bondage, entrapment of migrant workers, threats of violence by criminal enterprises, and in 1% of cases, chattel slavery. Reacting to this report, the U.S., European Union, and Japanese Trade and Labor ministers express joint commitment “to eradicating all forms of forced labour, including state-sponsored forced labour, from our rules-based multilateral trading system, and resolve to strengthen national and international efforts to meet this commitment.”

How exactly would they do this? Perhaps more fundamentally, would “removing forced labor products from international trade flows” also eliminate forced labor as such, or simply shift the destination of the products? In thinking through these questions, it might be useful to look at a recent example of large-scale success: the elimination of a state-run program of seasonal forced labor in cotton harvesting in Uzbekistan. Some background and tentative conclusions:

Background: Largest of the Central Asian republics at 34 million people, Uzbekistan is the world’s sixth-largest cotton producer, harvesting about 3 million tons per year in a global total usually around 25 million tons. Having served in the Soviet era as the provider of cotton for Russia-based textile mills, as an independent country since 1991 Uzbekistan now grows cotton both for local factories and for exports to clothing-producers elsewhere in the world.

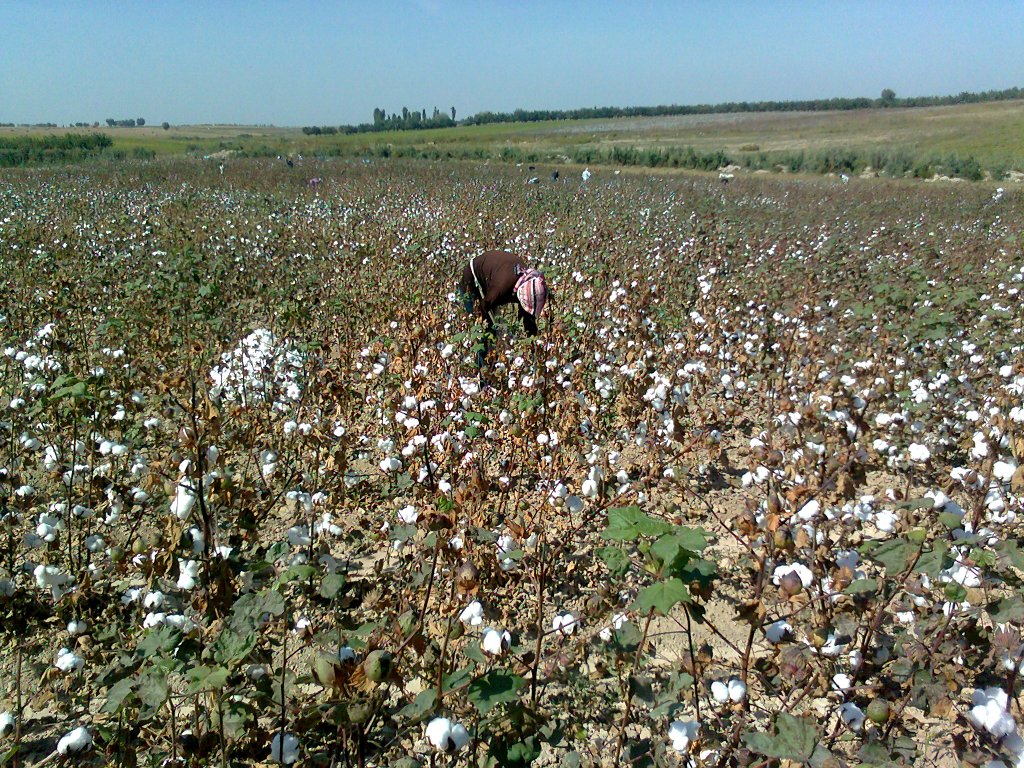
According to a series of ILO surveys begun in 2016, about 2.8 million people worked in Uzbekistan’s annual autumn cotton harvest in the early 2010s. Roughly 14% of these harvesters — almost 400,000 people – were forced laborers required by local governments to leave school or jobs for unpaid fieldwork during harvest season until regional harvest quotas were filled. The 2016 survey reported that those “most ‘at risk’ of forced labour were medical and education staff, people employed elsewhere, and university/college students.” Five years later, the January 2021 report declared that “systemic forced labour and child labour has come to an end in Uzbekistan,” and the March 2022 report found no return.

Eliminating this system appears to have involved at least three factors:

(a) A large and sustained international activist effort through the “Cotton Campaign” involving businesses, labor unions, and human rights groups, which provided information on forced labor practices in the cotton harvest and pressured textile and apparel industry buyers worldwide not to use Uzbek cotton.

(b) International government pressures, in the U.S. case including human rights reports published by the State and Labor Departments, and a ‘review’ of the tariff waivers Uzbekistan received through the Generalized System of Preferences entailing possible revocation.

(c) Contingent factors, in particular the death in office of post-Soviet leader Islam Karimov and his replacement by a new leader, Shavkat Mirziyoyev, whose government hoped to avoid the reputational and potential economic damage associated with forced labor and was willing to put sustained effort, with ILO advice and monitoring, into reshaping the cotton industry.

Tentative conclusions: In drawing lessons from this experience, it’s likely important to be aware that the term “forced labor” covers many different forms of coercion, and these may require different approaches. The Uzbek cotton harvesting system appears an unusual, both as a state-run program and as one designed mainly for economic/industrial purposes. The policies that succeeded in eliminating it may be less useful with respect to state forced labor systems used by militaries or for other political purposes. State-required forced labor in turn is a relatively small part of forced labor generally, accounting in the ILO’s estimates for about 15% of the worldwide 27.6 million forced laborers. Most forced labor (see data below) appears to be in small-scale private businesses and criminal enterprises, where the policy challenge will often be effective law enforcement, often at local levels. But some general features of the effort to eliminate forced labor in Uzbekistan’s cotton harvest may be generally useful.

Publicity: The Cotton Campaign’s work, and the publication of credible data and reports by the U.S. government and ILO, appear to have had a major impact on both international opinion and Uzbek government policy. The U.S.’ GSP review likely added to this; its economic importance was modest — in the mid-2010s it applied to $2.5 million in imports of dried peppers, apricots, and other agricultural goods, out of $100 million to $300 million in annual Uzbek exports to the U.S. — but the reputational impact of the case and potential loss of benefits may have been high. This is especially relevant since, as our January report on GSP notes, the system lapsed almost two years ago and is not now available for the six Ministers’ efforts on forced labor, but can be restored whenever Congress acts.

Patience and persistence: The Cotton Campaign began working in 2007, and remained focused specifically on Central Asian cotton harvesting for a decade before the change of government in Uzbekistan and the subsequent relatively rapid abolition of forced labor in cotton harvesting.

Optimism: In this case, some combination of government policies, activism, and changing perceptions within the Uzbek government worked. Different circumstances elsewhere may require different methods, but the fact of one success means others are also possible.


FUTURE READINGS:

The ILO on forced labor worldwide as of 2021.

And via the Uzbekistan Embassy in D.C., remarks from Tanila Narbaeva (Chair of National Commission on Combatting Human Trafficking and Forced Labor) on the abolition of forced labor and next steps in labor reform.

Forced labor commitment from U.S./EU/Japan Trade and Labor Ministers.

And the U.S. Customs and Border Patrol explains forced labor-product interdiction.

Data:

Over the last decade, the world labor force has grown from 3.20 billion to 3.45 billion, and the ILO estimates of forced labor has risen from 20.9 million in 2011, to 24.7 million in 2016, to the 27.6 million cited in last week’s report. Basic statistics from last week’s report:

Industries: About two thirds of forced labor, totaling 17.3 million people, is in the “private sector.” This includes 5.5 million in a broadly defined “services” sector, and an additional 1.4 million in domestic work; 3.2 million in manufacturing, 2.8 million in construction; 2.1 million in agriculture; 0.2 million in mining and quarrying; and 0.1 million in fisheries. Child forced labor is most common in services, especially for domestic maid work.

Prostitution and pornography: 6.3 million forced laborers appear to be performing forced sex work (which in the ILO report is considered separately from ‘private sector’ industries). Of this total, 4.9 million are female and 1.4 male. Over a quarter of the 6.3 million people, 1.7 million, are children.

Government: 3.9 million people are held in labor camps or forced to work by governments. (Not including prisoners required to work as part of legitimate sentences for crimes). This total is nearly double the 2.2 million the ILO estimated for 2011, but slightly lower than the 4.1 million estimate for 2016. The ILO does not cite specific governments involved.

International trade: The report offers no guess at how much forced labor production enters international trade flows, but notes that the sectors where the risk of forced labor is “highest in severity and scale” are “informal micro- and small enterprises operating at the lower links of supply chains in high-risk sectors and locations”.

Geography: Forced labor estimates appear roughly consistent with shares of the world labor force, except that Africa’s share of forced labor is relatively low and the “Europe/Central Asian” share high. About half of all forced labor — 15.1 million people — is in Asia. Elsewhere, the ILO estimates 3.6 million people in forced labor in the Western Hemisphere, 0.9 million in Arab states, 3.8 million (and the lowest rate relative to population) in sub-Saharan Africa, and 4.1 million in Europe and Central Asia.

Case history in success: Uzbek cotton 2015-2022:

ILO’s 2016 report (first in the series, covering the 2015 harvest), with analysis on the nature of forced labor in cotton harvesting seven years ago.

And the March 2022 report announces an end to “systemic forced labour and child labour” in Uzbek cotton harvesting.

The Cotton Campaign lifts its boycott of Uzbek cotton, March 2022.

And historical Central Asia perspective:

Sadriddin Aini’s Sands of Oxus (1954), recounting childhood in the Emirate of Bukhara in the 1880s (conquered by imperial Russia in 1865 and no longer independent, but still a “protectorate” and locally self-governing), includes recollection of a temporary forced-labor recruitment episode for road-building.


ABOUT ED

Ed Gresser is Vice President and Director for Trade and Global Markets at PPI.

Ed returns to PPI after working for the think tank from 2001-2011. He most recently served as the Assistant U.S. Trade Representative for Trade Policy and Economics at the Office of the United States Trade Representative (USTR). In this position, he led USTR’s economic research unit from 2015-2021, and chaired the 21-agency Trade Policy Staff Committee.

Ed began his career on Capitol Hill before serving USTR as Policy Advisor to USTR Charlene Barshefsky from 1998 to 2001. He then led PPI’s Trade and Global Markets Project from 2001 to 2011. After PPI, he co-founded and directed the independent think tank Progressive Economy until rejoining USTR in 2015. In 2013, the Washington International Trade Association presented him with its Lighthouse Award, awarded annually to an individual or group for significant contributions to trade policy.

Ed is the author of Freedom from Want: American Liberalism and the Global Economy (2007).  He has published in a variety of journals and newspapers, and his research has been cited by leading academics and international organizations including the WTO, World Bank, and International Monetary Fund. He is a graduate of Stanford University and holds a Master’s Degree in International Affairs from Columbia Universities and a certificate from the Averell Harriman Institute for Advanced Study of the Soviet Union.

Read the full email and sign up for the Trade Fact of the Week

PPI’s Trade Fact of the Week: 42 of the world’s 195 countries are monarchies

FACT: 42 of the world’s 195 countries are monarchies.

THE NUMBERS: 21st century monarchies –

Western Hemisphere: Canada, Antigua, the Bahamas, Belize, Grenada, Jamaica, St. Kitts, St. Lucia, St. Vincent.

Middle East: Bahrain, Jordan, Kuwait, Morocco, Oman, Qatar, Saudi Arabia, and the United Arab Emirates.

Europe: Andorra, Belgium, Denmark, Liechtenstein, Luxembourg, Monaco, the Netherlands, Norway, Spain, Sweden, United Kingdom.

Asia: Bhutan, Brunei, Cambodia, Japan, Malaysia, Thailand.

Africa: Lesotho and Swaziland.

Pacific: Australia, New Zealand, Papua New Guinea, Solomon Islands, Tonga, Tuvalu.


WHAT THEY MEAN:

Economist editor and poli. sci. pioneer Walter Bagehot explained in 1867 that monarchies hold public support better than republics because, being personal and symbolic rather than abstract and confusing, monarchies are more fun:

“Royalty is a government in which the attention of the nation is concentrated on one person doing interesting actions. A Republic is a government in which that attention is divided among many, who are all doing uninteresting actions.”

Recent TV statistics illustrate his thought in practice: 13.4 million Britons are said to have watched Queen Elizabeth II’s Platinum Jubilee ceremony last year, while a modest 1.3 million watched the 2019 Parliamentary debate on Brexit.  Barbara Tuchman’s famous Guns of August introduction evokes the same mood with a bit less cynicism:

“So gorgeous was the spectacle on the May morning of 1910 when nine kings rode in the funeral of Edward VII of England that the crowd, waiting in hushed and black-clad awe, could not keep back gasps of admiration. In scarlet and blue and green and purple, three by three the sovereigns rode through the palace gates, with plumed helmets, gold braid, crimson sashes, and jeweled orders flashing in the sun. After them came five heirs apparent, forty more imperial or royal highnesses, seven queens—four dowager and three regnant—and a scattering of special ambassadors from uncrowned countries. Together they represented seventy nations in the greatest assemblage of royalty and rank ever gathered in one place and, of its kind, the last. The muffled tongue of Big Ben tolled nine by the clock as the cortege left the palace, but on history’s clock it was sunset, and the sun of the old world was setting in a dying blaze of splendor never to be seen again.”

Fifteen decades later, as the U.K. prepares for a similar event for his great-granddaughter next Monday — a  moment of “sunset on history’s clock”, with attendant reflections on a life stretching from the Second World War, through the transition from Edward’s empire to Elizabeth’s Commonwealth, 15 Prime Ministers, etc., across seven decade of public service to the third decade of the 21st century — monarchy still seems to catch national and global imagination. Of the world’s 195* independent countries, 42 are monarchies — 15 Commonwealth realms including the U.K. itself, along with eight in the Middle East, one (Tonga) in the Pacific, two in sub-Saharan Africa, six in Asia, and 10 in continental Europe. R.I.P to a unique figure, and our sympathy with U.K. and Commonwealth friends this week.

* Using the State Department’s count of countries.


FUTURE READINGS:

Some looks back:

Then-Princess Elizabeth’s Children’s Hour broadcast during the Blitz in 1940 (pictured above).

The Platinum Jubilee weekend.

More highlights on the life of Queen Elizabeth II from The Commonwealth.

Two takes:

Walter Bagehot explains the populist appeal of monarchy.

And Tuchman’s The Guns of August, in which after the intro the Kaiser takes a lot of interesting actions but non-royals do so as well.

Eight current monarchies:

The British royal household.

The Japanese monarchy is the oldest in the world, predating the fall of the Roman Empire by at least 70 years: Japan’s Imperial Household Agency.

Thailand’s King Rama IX reigned from 1946 to 2016, equalling Elizabeth’s 70 years. Thailand’s Royal Office.

King Letsie of Lesotho marks his 25th year this October 13.

King Tupou IV of Tonga.

King Abdullah II of Jordan.

Oman’s Sultan Haitham bin Tariq.

And Danish Queen Margarethe, who marked 50 years last January, traces her antecedents back to a Viking named Gorm the Old (~ 900 A.D.)  She is also queen of Greenland and the Faeroes Islands, technically autonomous realms “under the Danish crown.”

Also:

The current global count of monarchies is a bit less clear than the “42” figure suggests, since many countries retain hereditary ruling kings and queens of regions and ethnic groups incorporated in larger countries. Three examples:


ABOUT ED

Ed Gresser is Vice President and Director for Trade and Global Markets at PPI.

Ed returns to PPI after working for the think tank from 2001-2011. He most recently served as the Assistant U.S. Trade Representative for Trade Policy and Economics at the Office of the United States Trade Representative (USTR). In this position, he led USTR’s economic research unit from 2015-2021, and chaired the 21-agency Trade Policy Staff Committee.

Ed began his career on Capitol Hill before serving USTR as Policy Advisor to USTR Charlene Barshefsky from 1998 to 2001. He then led PPI’s Trade and Global Markets Project from 2001 to 2011. After PPI, he co-founded and directed the independent think tank Progressive Economy until rejoining USTR in 2015. In 2013, the Washington International Trade Association presented him with its Lighthouse Award, awarded annually to an individual or group for significant contributions to trade policy.

Ed is the author of Freedom from Want: American Liberalism and the Global Economy (2007).  He has published in a variety of journals and newspapers, and his research has been cited by leading academics and international organizations including the WTO, World Bank, and International Monetary Fund. He is a graduate of Stanford University and holds a Master’s Degree in International Affairs from Columbia Universities and a certificate from the Averell Harriman Institute for Advanced Study of the Soviet Union.

Read the full email and sign up for the Trade Fact of the Week

PPI’s Trade Fact of the Week: The Trade Adjustment Assistance program expired June 30

FACT: The Trade Adjustment Assistance program expired June 30.

THE NUMBERS: TAA beneficiaries by sector, FY2021 –
Total 107,454
Manufacturing   80,588
Wholesaling     3,422
Information     2,227
Mining/energy     1,801
Retail        701
Agriculture          71
Accommodation/food service            0


WHAT THEY MEAN:

As 158 million American workers return from the Labor Day break to shops, offices, restaurants, factories, labs, grocery and retail checkout registers, construction sites, and bedside computer terminals, the Bureau of Labor Statistics abounds with good news. Businesses are hiring 6 million workers per month. Layoffs, contrariwise, are running about 1.3 million per month, 400,000 per month below pre-COVID levels. And the tally of unemployed workers, at 5.67 million last July, was the lowest since the golden summer of 2000 and barely half the 11.23 million currently open jobs.

Against this September’s blue and sunny labor-market skies, a policy cloud: the expiration June 30th of Trade Adjustment Assistance (“TAA” for short), a 60-year-old program dating to the Kennedy Administration which offers job training and other benefits to workers displaced by trade competition or job shifts abroad.  The end of these benefits is a challenge. But it is also an opportunity for fresh thinking, laid out in a joint piece today by PPI’s Ed Gresser and Workforce Development Policy Director Taylor Maag, which suggests going beyond simple renewal to make TAA benefits more widely available to displaced workers regardless of the cause of job loss. A couple of quick descriptive points, and then a thought on the reason for a fresh approach:

Scale and Coverage: Over the past decade TAA served an average of 91,000 displaced workers per year. Coverage is nationwide; of the 107,454 workers in the 2021 TAA cohort, 12,638 are in Texas, 11,012 in Oregon, 3,112 in Minnesota, 1,420 in Connecticut, 1,231 in Kentucky, and so on. By sector, about 75% of last year’s TAA beneficiaries (80,588 of the 107,454) were in manufacturing, as compared to 1,809 in mining and energy, 61 in agriculture and 24,966 in variety of services industries (e.g., 701 in retail, 3,422 in wholesaling, 2,227 in information industries, none in accommodation and food service, and so on).  Demographically, the 2021 beneficiaries have a median age of 51; two-thirds are men; half have high school degrees, GEDs or less; ethnically they are 65% white, 13% African American, 11% Hispanic, 9% Asian and 2% Native American.

Distinctiveness: After its 18 renewals and revisions, with especially significant ones in 1974, 2002, and 2015, TAA has become a sort of pilot program in active labor-market policy.  Its services go well beyond between-jobs income support to include self-help options for workers with widely differing career goals and local opportunities. Workers certified as TAA-eligible receive a menu of benefits: two years of job training for those interested in new career paths; temporary wage insurance for older workers taking lower-paying jobs; health care tax credits; and relocation support for workers planning a move to areas with more employment opportunities.

A comment on results: Examining the results in 2018, New York Fed researcher Ben Hyman found a strong though temporary benefit: “Ten years out, TAA-trained workers have $50,000 higher cumulative earnings, driven by both higher incomes and greater labor force participation. Yet annual returns fully depreciate after ten years. … Returns are further concentrated in the most disrupted regions.”

Where to now? The original argument John F. Kennedy made for TAA, as a complement to the Trade Expansion Act of 1962, provides a useful point of departure. His case, made with the standard New Frontier clarity and force, is that reducing tariffs and opening foreign markets promotes growth, fights inflation, helps new industries grow, and raises consumer living standards; but can also increase competition and stress at home. In such cases, he says:

“[C]ompanies, farmers and workers who suffer damage from increased foreign import competition [should] be assisted in their efforts to adjust to that competition. When considerations of national policy make it desirable to avoid higher tariffs, those injured by that competition should not be required to bear the full brunt of the impact. Rather, the burden of economic adjustment should be borne in part by the Federal Government. …  Just as the government met its obligation to assist industry in adjusting to war production and again to return to peacetime production, so there is an obligation to render assistance to those who suffer as a result of national trade policy.”

Kennedy’s logic held up for six decades and could be used again for a simple renewal. But it has a couple of weaknesses that suggest the need for a bolder approach. One relates to the particular circumstances of 2022 as opposed to those of 1962, 1974, 2002, or 2015. The other is more basic and troubling.

First, Kennedy and his successors argued for TAA as part of a national trade-liberalizing policy, in which the various benefits of an open market and export growth should be balanced with support for dislocated workers in previously sheltered industries. But with the U.S. at least for now not trying to cut tariffs, trade-related dislocation appears more likely to come from the opposite direction – trade lawsuits of the type that destabilized the solar power industry this spring, the costs that Trump-era tariffs on industrial inputs impose on U.S. machinery and automotive manufacturers, or (indirectly) retaliations against U.S. exporters. In these circumstances the case for a special program for import-related job loss is probably weaker than it was in the past.

Second, Kennedy’s case for special help for trade-displaced workers has always had an unspoken and troubling corollary:  some workers in distress, particularly in the manufacturing sector, get more help than others. Specifically, the manufacturing sector accounted for 7.0% of layoffs in 2021, and 6.2% of layoffs over the last decade.  Meanwhile, displaced manufacturing workers made up 75% of TAA beneficiaries in FY2021 and 72% over the past decade.  Retail, construction, and food service/accommodation workers who make up larger shares of annual U.S. layoffs typically make do with standard unemployment insurance. In more individual terms, TAA’s self-help policy options are much more open to a displaced auto plant worker than to a displaced auto shop worker, or to a textile worker than to a waitress or a gas station attendant.

With these facts in mind, Gresser and Maag suggest that Congress should consider something new: not removing TAA benefits as options for trade-dislocated workers by simply letting the program expire, but making them more broadly available to displaced workers, regardless of sector or cause of job loss. This is a complex question, requiring some budget thinking and possibly some reorganization of job-training and displaced-worker support more generally. But as they note in their post-Labor Day piece today, there is no better time to think about reforming and revising old labor policies than a sunny year in which jobs are plentiful and layoffs rare.

FUTURE READINGS:

TAA data and status

DoL’s TAA database, with counts of petitions and worker certifications from 2010 forward.

The DoL’s Annual Reports on TAA, FY2009 through FY2021.

And a comment on program expiration from Secretary of Labor Marty Walsh.

Policy goals and outcomes, 1962-2021 

JFK on tariff-cutting and Trade Adjustment Assistance, January 25, 1962.

Sen. Max Baucus, D-Mont., on renewal and options for reform, 2004.

An evaluation from Ben Hyman of the New York Fed, 2018.

And a Ways and Means Committee renewal hearing featuring workers, firm owners, and state officials, 2021.


ABOUT ED

Ed Gresser is Vice President and Director for Trade and Global Markets at PPI.

Ed returns to PPI after working for the think tank from 2001-2011. He most recently served as the Assistant U.S. Trade Representative for Trade Policy and Economics at the Office of the United States Trade Representative (USTR). In this position, he led USTR’s economic research unit from 2015-2021, and chaired the 21-agency Trade Policy Staff Committee.

Ed began his career on Capitol Hill before serving USTR as Policy Advisor to USTR Charlene Barshefsky from 1998 to 2001. He then led PPI’s Trade and Global Markets Project from 2001 to 2011. After PPI, he co-founded and directed the independent think tank Progressive Economy until rejoining USTR in 2015. In 2013, the Washington International Trade Association presented him with its Lighthouse Award, awarded annually to an individual or group for significant contributions to trade policy.

Ed is the author of Freedom from Want: American Liberalism and the Global Economy (2007).  He has published in a variety of journals and newspapers, and his research has been cited by leading academics and international organizations including the WTO, World Bank, and International Monetary Fund. He is a graduate of Stanford University and holds a Master’s Degree in International Affairs from Columbia Universities and a certificate from the Averell Harriman Institute for Advanced Study of the Soviet Union.

Read the full email and sign up for the Trade Fact of the Week

Why U.S. Policymakers Should Renew TAA (For Everyone)

What should the Biden administration and Congress do as Trade Adjustment Assistance expires? Consider a new approach: Renew it but drop the trade clause and reach more workers.

John F. Kennedy’s Trade Act of 1962 marked a watershed in U.S. trade policy, leading after a few years of negotiations to the largest single tariff cut in American negotiating history. It was also, though this is less well-remembered, a watershed in worker adjustment policy. The 1962 Act created the Trade Adjustment Assistance (TAA) program, which helps workers losing jobs to import competition by offering benefits that went well beyond the support available for other displaced workers. Kennedy’s argument for it noted that reducing tariffs and opening foreign markets promotes growth, fights inflation, helps new industries grow, and raises consumer living standards; but can also increase competition and stress at home. To address this, he suggested a new federal support program:

“[C]ompanies, farmers and workers who suffer damage from increased foreign import competition [should] be assisted in their efforts to adjust to that competition. When considerations of national policy make it desirable to avoid higher tariffs, those injured by that competition should not be required to bear the full brunt of the impact. Rather, the burden of economic adjustment should be borne in part by the Federal Government. …  Just as the government met its obligation to assist industry in adjusting to war production and again to return to peacetime production, so there is an obligation to render assistance to those who suffer as a result of national trade policy.”

Over the six decades since, TAA has represented a liberal-internationalist bargain, blending trade liberalization and support for exporters with a commitment to vulnerable workers. As Kennedy and each of his Democratic successors recognized, openness to foreign trade helps to catalyze the U.S. economy but can also harm less competitive domestic companies and their workers. They also recognized the value of a federal commitment to an active labor market policy that helps displaced workers develop new skills and find career paths, enabling them to support families and continue their contribution to communities and to the nation’s economy. Congress has reauthorized TAA 18 times since. The renewals in 1974, 2002, 2011, and 2015 were particularly ambitious, with the 21st century renewals adding coverage for workers grappling with internet-based competition, workers displaced by plant shifts abroad, and farmers. The most recent iteration, completed in 2015, offered reemployment services including training (on the job training, academic training, and apprenticeship), income support for those enrolled in training, job search services, relocation, and transportation benefits as well as wage subsides for older workers.

TAA thus pledged that as the U.S. reduced trade barriers, those who lost their jobs due to shifts in production and foreign labor would be adequately supported by the government to find new and often better employment. In FY2021, for example, the Department of Labor certified 801 petitions for TAA support, providing help to over 107,000 displaced workers. A statistical snapshot drawn from the Labor Department’s most recent annual report finds that 80,000 of these beneficiaries or 75% of the cohort come from the manufacturing sector. Their median age is 51; half half high school degrees or GEDs, 31% some additional schooling, and 19% are college graduates.  By gender, two-thirds are male; by race and ethnicity, two-thirds are white, 13% African-American, 11% Hispanic, and 9% Asian-American.

However, in the past decade since the 2015 reauthorization, the program has changed little. Most recently, Congress left TAA out of the stimulus and recovery packages passed in response to the COVID-19 pandemic and likewise out of the recently passed CHIPS and Science Act. As a result, TAA officially expired at the beginning of July 2022, and workers displaced by trade competition or job shifts abroad no longer can receive its support.

Where to now? TAA often received criticism, sometimes on budget grounds and sometimes on efficacy grounds. Its critics claim that the program failed to reach eligible workers, due to lack of program awareness and hoops to access services. As Andrew Stettner of The Century Foundation observed in a 2021 appearance before the House Ways and Means Committee, “Workers can only qualify for TAA if a union, local government agency, or a group of three or more workers files a petition that proves that job losses at a specific facility/unit are directly tied to trade. This is a laborious process that takes an average of 61 days from the time a petition is filed (which itself may come after a plant is closed), and as a result many potentially qualified workers do not receive coverage.”

These critiques have some force. To Stettner’s point, TAA’s impact is inherently limited by its qualification rules: A worker seeking help must know first that a special program for trade-related job displacement exists, and then be able to show that trade or jobs abroad contributed to their job loss.

Nonetheless, bipartisan policy analysis shows that TAA has had some significant success over time. New York Fed economist Ben Hyman in 2018 after comparing employment outcomes for TAA beneficiaries with outcomes for non-beneficiaries in similar circumstances, found that “ten- years out, TAA-trained workers have $50,000 higher cumulative earnings, driven by both higher incomes and greater labor force participation,” though earnings converge after a decade.  An earlier Peterson Institute for International Economics paper  highlighted significant change for the better in the 2002 TAA renewal, including increased uptake in services sectors and increased participation in skill development opportunities by affected workers. On the center-right, a recent AEI report found that TAA generally has had long-term impact on earnings for workers receiving services, especially those that received the full benefit of skills training. Additionally, as part of the 2011 reauthorization, the TAACCCT grant program was created. This program encouraged partnerships between community colleges and the workforce system to develop accelerated pathways to careers for adult learners. And a report by New America found individuals that participated in TAACCCT-funded programs were more likely to complete their training, earn a relevant credential, and find in-demand employment.

Not only have multiple sources and research found that TAA has had considerable and valuable impact for trade-displaced workers, but TAA also has a potentially greater importance as a pioneer of generous benefits that other federal programs do not always consistently offer to displaced workers. These include the length of the training benefit (two years) for workers committed to developing new skills, wage subsidies for those in training or based on age eligibility, and the option for workers in particularly distressed areas to get financial support for relocation and job search elsewhere. This type of holistic approach is increasingly important to ensure people persist and complete in their training to prepare for in-demand opportunities. And it is a good model for a better, more active support program for workers generally.

This last point leads to a final, unsettling fact for advocates of the TAA program. TAA has by nature always included a troubling inequity, inherent in Kennedy’s original case for special support for workers displaced by import competition. That is, workers who lose jobs to trade competition can get more generous benefits than workers who lose jobs to recession or domestic competition.  Is there really a strong ethical case to distinguish between (say) a displaced clothing factory worker and a displaced waitress or gas station attendant, and view the former as more in need of benefits or more entitled to benefits than the latter?

So, we return to the expiration of the program this year, and potential next steps. By missing the opportunity to renew and update TAA at all, federal policymakers are yet again forgetting about working Americans and the policies that were designed for them specifically.  On the other hand, with the Biden administration so far not seeking to open new export markets and declining opportunities to liberalize the U.S. trade regime, does the historic liberal-internationalist bargain — more open markets, support for displaced workers — still apply?  And if it is less applicable in current circumstances, should we not therefore think about an opportunity to generalize the program, so that it supports not only trade-affected workers but other workers in industries that have been hard hit over the past two and a half years from the pandemic and technological advancement?

Looking ahead, here is our take: Since TAA is expired, Congress should take this time to think about ways we can do better. Here are three ideas that could address critiques to the program and make sure it better serves workers in our 21st century economy.


  • Expand Eligibility: Consider expanding services to reach a broader group of workers — perhaps any worker – facing dislocation, for international or domestic reasons beyond their control. This would still include trade-affected workers but would also open the benefits to those dislocated from industry decline based on automation, climate-related provisions (i.e., coal) and/or fallouts from the pandemic (i.e., retail & hospitality industries).
  • Market & Streamline Services: TAA Administrators must better ensure that eligible workers know the program exists and are able to access benefits. This means a more robust public relations campaign, better partnership with other systems (i.e., workforce boards, community colleges) and community-based organizations that are reaching people on the ground as well as collaboration with employers so they can accurately communicate opportunities to at risk employees.
  • Prioritize Skill Development: While reemployment services like job search are important, we need to do a better job of helping people prepare themselves for new in-demand jobs, which often means opportunities to up-skill. Skill development opportunities available through TAA are critical to make sure dislocated workers find employment that helps them find new and better jobs.


To make these changes work, policymakers also must think about the budgetary implications. In FY 2021, prior to expiring, TAA served a total of 107,000 workers with an appropriation of $633.6 million dollars.  The precise number of workers a generalized program would serve is unclear, but current statistics on TAA use and the universe of potential new beneficiaries can provide some guideposts.  On one hand, the 80,000 manufacturing workers in the FY2021 cohort is about 6% of total manufacturing-sector layoffs, and total layoffs in a year typically average about 1 million.  On the other, the most likely users are long-term unemployed workers unable to find new jobs quickly, and the total long-term unemployed population has varied in recent years between the current 1.2 million and 3 million.  Such figures suggest that a million displaced workers might be something of an upper bound.  To serve this many dislocated workers across an array of disrupted industries and the long-term unemployed, TAA’s budget would have to increase about ten-fold, reaching roughly $6 billion annually. However, that number shouldn’t alarm policymakers and probably can be reduced. Determining whether a particular worker’s layoff is ‘trade-related’ requires a significant investment in administrative overhead and costs. A more generalized program would reduce the time and money spent on proving eligibility. Additionally, with an expanded TAA, other federal workforce programs may be duplicative and unnecessary. This means programs could be consolidated or cut, which could also help reduce costs.

In sum, the TAA program is an important one, delivering valuable benefits to hundreds of thousands of workers each year. Congress should remember this impact and make sure it does not simply disappear.  It should also remember, though, that trade is far from the largest cause of job displacement, and all workers — especially those in lower-skilled jobs that are subject to increased disruptions as the economy changes — deserve support. With the program lapsed, federal policymakers should consider ways to improve and broaden it. An updated policy could focus beyond trade and international competition, and provide adjustment assistance for all economic disruption, would help empower working Americans to advance by giving them access to the skills and financial support necessary to find new and emerging in-demand work. This is critical to enhance workers’ confidence, broaden economic opportunity, and help our nation grow from the bottom up and middle out.


PPI’s Trade Fact of the Week: 1.4 million Americans have Pacific Island roots

FACT: 1.4 million Americans have Pacific Island roots.

THE NUMBERS: U.S.-Pacific Island economic links –

Aid                 $20 million
Imports          $486 million
Remittances  $300 million

WHAT THEY MEAN:

Speaking last month to the Pacific Islands Forum (the annual assembly of 18 countries and territories around the South Pacific*), Vice President Harris regretfully observes that “in recent years the Pacific Islands may not have received the diplomatic attention and support that you deserve.” To make up for lost time, she announces an array of new political and economic supports, to be finalized this September at the first U.S.-Pacific Islands summit ever held:

  • Opening new embassies in Tonga and Kiribati (both countries of about 100,000 people, now served by the U.S. embassy in Suva, the capital of Fiji), along with an AID office in Fiji and a new Peace Corps volunteer program.
  • Raising annual U.S. aid to Pacific Island states from $21 million to $60 million for “economic development and ocean resilience” along with “infrastructure programs that are sustainable, high quality, climate friendly, and very importantly do not result in insurmountable debts.”
  • Pledging to conclude a long-pending South Pacific Tuna Treaty and cooperative policies to reduce illegal/unreported/unregulated fisheries.

All this will be amplified, presumably with more ideas, by a “U.S. National Strategy on the Pacific Islands” to be published sometime after the summit.  Some explanation below, plus a couple of suggestions:

Background: The South Pacific expanse spans 3,000 islands, spread out over an expanse of sunlit water as large as Asia, Europe, and North America combined.  These islands combine to form 14 independent countries, two French departments, one U.S. state plus three insular territories.  They are home to 50 million people, of whom 35 million live in Australia and New Zealand, 9 million in Papua New Guinea, 1.5 million in Hawaii, and 2.5 million in the other 15 countries and territories combined.

This region suddenly seems like an arena for big-power diplomatic competition. Some of its rapidly proliferating Chinese aid programs are civilian and visually striking: a ring road around Papua New Guinea’s capital Port Moresby, a large hospital on the coastal road east of Suva in Fiji, a “royal military band” facility in Tonga. Others carry murkier overtones of intelligence and high naval strategy: leaked mutual defense and telecommunications arrangements between China and the Solomon Islands, the sudden withdrawal of coral atoll-state Kiribati from the Forum after a visit by the Chinese Foreign Minister, etc.  With this subtext, the VP’s concern and interest presumably goes beyond abstract hope to raise the American diplomatic profile.

The policy outlined in her speech focuses, along with climate and fisheries policy, on aid and infrastructure development. These are useful and needed no doubt; on the other hand, the impact of aid likely has some limits.  On one hand, the Pacific Islands are already the world’s most aid-saturated region.  By the Sydney-based Lowy Institute’s calculations, they receive $2.4 billion in aid annually.  This amounts to 10 percent of the region’s economy, a figure sixteen times higher than the 0.6% average for all low- and middle-income countries.  Adding more may encourage the governments of very small countries – setting aside Papua New Guinea, the populations range from 11,000 in Nauru to 900,000 in Fiji – to take on more aid than they can manage.

More conceptually, a strategy focused particularly on aid may miss an area of American “comparative advantage”, which Harris’ speech notes in observing that 1.4 million Americans trace family to the Pacific islands.  A useful insight here comes from the influential 1993 essay Our Sea of Islands, in which the late Tongan intellectual Epeli Hau’ofa argued that the people of Pacific island nations should see themselves as citizens of a large ocean continent extending to expatriate communities in the United States, Australia, and New Zealand, rather than as comparatively helpless residents of small and isolated islands.  He notes in particular the large role these communities play in island economies through remittances and exchanges of goods (clothes, TVs, refrigerators etc. going to the islands; crafts, agricultural goods, information coming in turn), and concludes with a caution against very heavy reliance on aid: “Ordinary Pacific people depend for their daily existence much more on themselves and their kin, wherever they may be, than on anyone’s largesse.”

With this in mind, two policy options for the VP and her administration associates as they think about next steps:

1. Trade preferences: Americans bought $0.5 billion worth of goods from Pacific islands last year. This is a tiny sum in the $2.8 trillion world of U.S. goods imports, but a large part of the islands’ export portfolio.  A simple way to bolster it would be renewal of the Generalized System of Preferences, the main U.S. trade program for developing countries, which lapsed in 2020.  Before the lapse, it provided substantial support for growth and employment through candied and sushi-grade ginger and taro from Fiji, canned tuna from the Solomon Islands, taro and cassava from Tonga. A more ambitious option would be creation of a special trade program analogous to the Caribbean Basin Initiative’s permanent duty-free access to the U.S., which could offer additional support for processed fish exports.

2. Reducing remittance costs: The 1.4 million Americans from Pacific Island and Native Hawaiian families noted in Harris’ speech are a source of income almost equal to trade. Remittances — wires of money from workers abroad to families — account for 7%-10% of Pacific island GDP, and peak at levels of 43% of GDP for Tonga and 21% for Samoa. Assuming a roughly equal division between the islands’ three main remittance sources (the U.S., Australia, and New Zealand), this would probably mean about $300 million per country.  The challenge is that, by World Bank tallies, Pacific islanders abroad pay a lot more than other remittance senders for their generosity:  bank and wire fees eat up 11% of remittance value for Vanuatu, 9.8% for Tonga, and 8.4% for Samoa.  Reducing these costs to 2.9% of remittance — the figure for equally remittance-reliant El Salvador — this would free up as much as 2% of national income for some countries, all of which would go directly to families.

Summary: Harris’ remarks are a thought-provoking read and a good beginning for policy; but one has room for more.

* Australia, Cook Islands, Marshall Islands, Federated States of Micronesia, Fiji, French Polynesia, Marshall Islands, Nauru, New Caledonia, New Zealand, Niue, Palau, Papua New Guinea, Samoa, Solomon Islands, Tonga, Tuvalu, Vanuatu, and associate member Tokelau. Outlier Kiribati withdrew on July 14.

FUTURE READINGS:

Some quick geography/economy background: Geographers traditionally divide the South Pacific into three areas with Fiji more or less in the middle. Melanesia, just north and east of Australia, includes Papua New Guinea, the Solomon Islands, New Caledonia, and Vanuatu, which have large extractive-industry economies driven by timber and mining exports to China. Polynesia, the largest expanse of ocean, goes east from Fiji through Tonga and Samoa to Tahiti, Hawaii and Easter Island (and also includes New Zealand’s Maori community), with fisheries along with taro, vanilla, ginger, and other specialty agriculture. Most Polynesian trade is with the U.S., Australia, and New Zealand. Micronesia, in the north heading toward Guam, has six countries mostly made up of small coral atolls with especially high climate change risk; three of these (Palau, the Marshall Islands, and the Federated States of Micronesia) have special trade access to the U.S. dating to their independence.  Fiji, in the center, is a middle-income state with a diversified economy with the region’s main air and maritime logistics centers and the University of the South Pacific, along with a large tourism sector, agriculture, and light manufacturing.

U.S. policy:

Remarks by Vice President Kamala Harris to the Pacific Islands Forum.

The White House promises more in the run-up to next month’s Summit.

Capitol Hill views from the Congressional Pacific Islands Caucus.

Policy spectrum: 

regional overview from the Forum Secretariat looks at climate change response, COVID, nuclear weapons tests legacies, and big-country diplomacy.

Epeli Hau’ofa’s Our Sea of Islands essay and other writings on Pacific islands culture and government in We Are the Ocean.

The Diplomat on Kiribati’s withdrawal from the Forum.

Brookings Institution China scholar Patricia Kim on the possible implications of the China-Solomon Islands security document.

Trade:

Trade Fact series editor/PPI Vice President Gresser, then in government, visits a Fijian ginger factory and GSP exporter in 2018. They were buying sushi-quality vinegar from Oregon and Florida-made machinery, and selling candied ginger and sushi ginger back.

And a look at the GSP program, with a friendly critique of Congressional reauthorization bills and suggestions for next steps.

Remittances:

The World Bank on remittance flows to Pacific Island nations during and after COVID.

Sydney-based Lowy Institute on remittance policy.

Aid programs from the U.S./Australia/New Zealand:

The Lowy Institute’s Pacific Aid Map, with aid figures by country and donor.

USAID’s Pacific Islands programs.

MCC’s Solomon Islands Threshold Program.

AUSAID’s Pacific programs.

And New Zealand’s Pacific Islands aid and diplomacy.

And from China:

MoFA on China’s Pacific aid programs.

… and the Chinese Embassy in Tongan capital Nuku’alofa reviews deliveries of water tanks, computers, and tractors along with building a “royal military band” facility.

ABOUT ED

Ed Gresser is Vice President and Director for Trade and Global Markets at PPI.

Ed returns to PPI after working for the think tank from 2001-2011. He most recently served as the Assistant U.S. Trade Representative for Trade Policy and Economics at the Office of the United States Trade Representative (USTR). In this position, he led USTR’s economic research unit from 2015-2021, and chaired the 21-agency Trade Policy Staff Committee.

Ed began his career on Capitol Hill before serving USTR as Policy Advisor to USTR Charlene Barshefsky from 1998 to 2001. He then led PPI’s Trade and Global Markets Project from 2001 to 2011. After PPI, he co-founded and directed the independent think tank Progressive Economy until rejoining USTR in 2015. In 2013, the Washington International Trade Association presented him with its Lighthouse Award, awarded annually to an individual or group for significant contributions to trade policy.

Ed is the author of Freedom from Want: American Liberalism and the Global Economy (2007).  He has published in a variety of journals and newspapers, and his research has been cited by leading academics and international organizations including the WTO, World Bank, and International Monetary Fund. He is a graduate of Stanford University and holds a Master’s Degree in International Affairs from Columbia Universities and a certificate from the Averell Harriman Institute for Advanced Study of the Soviet Union.

Read the full email and sign up for the Trade Fact of the Week

Webinar: What is Priority Number 1? Inflation, Jobs, or Trade Policy

WITA Webinar: What is Priority Number 1? Inflation, Jobs, or Trade Policy

Thursday, September 1, 2022

11:00 a.m. — 12:00 p.m.

Virtual Webinar

Hosted by the Washington International Trade Association (WITA)

About this event

President Biden has said that inflation is his “top priority.” Would reducing U.S. tariffs on imported goods help fight inflation?


Featured Speakers:

Professor Alan Deardorff, Economist and Professor at the Ford School of Public Policy at the University of Michigan.

Ed Gresser, Vice President and Director for Trade and Global Markets, Progressive Policy Institute

Michael Stumo, CEO, Coalition for a Prosperous America

Moderator: Nasim Fussell, Partner, Holland & Knight; former Chief International Trade Counsel for the U.S. Senate Committee on Finance


RSVP here and watch the livestream here.

PPI’s Trade Fact of the Week: Mexico is now the principal source of illicit fentanyl and methamphetamines sold in the U.S.

FACT: Mexico is now the principal source of illicit fentanyl and methamphetamines sold in the U.S.

THE NUMBERS: U.S. deaths by drug overdose –
2021 total
 107,500*
Opioids
 73,400 deaths among 9.5 million users
Psychostimulants
 32,500 deaths among 2.6 million users
Cocaine
 26,000 deaths among 5.2 million users
Heroin/other opiates
   8,000 deaths among 0.9 million users
* Mortality from overdoses from the Centers for Disease Control; user totals from HHS’ Substance Abuse and Mental Health Services Administration. Many overdose deaths involve use of combinations of drugs, so overdoses measured by individual substances often double- or triple-count.


WHAT THEY MEAN:

After two decades of steady escalation, drug overdoses caused over 107,000 premature deaths in the United States last year. This was more than double the 41,500 overdose fatalities of 2012 and six times the 17,400 recorded in 2000. Or, alternatively, it is more than the combined total of U.S. deaths to automobile accidents (38,800 in 2020, 42,400 in 2021) and homicides (24,600 in 2020, likely higher in 2021).

Four classes of drugs, often in combination, account for most of these overdoses: synthetic opioids such as fentanyl, whose very high “purity” and variable chemical content make them especially dangerous; “psychostimulants” such as methamphetamines; cocaine; and heroin along with other natural or semi-synthetic opiates refined from naturally grown opium poppies. The Drug Enforcement Administration’s most recent “Annual Drug Threat Assessment” report, released in early 2021, suggests that (a) most of these products are imported, and (b) supply chains for opioids and amphetamines have changed substantially over the past decade and now center on Mexican production and land transport. A precis:

1. Opioids and opiates: A decade ago, fentanyl was mostly made in China and (being very light and cheap to transport) shipped to the U.S. via air cargo. Use of this from-China-by-air route has sharply declined since 2019, however. Most U.S.-consumed fentanyl is now produced in Mexico and moved to the U.S. by land. DEA’s report suggests a complex and adaptable precursor-chemical “supply chain,” with the relevant chemicals “primarily from sources originating in China, including purchases made on the open market, smuggling chemicals hidden in legitimate commercial shipments, mislabeling shipments to avoid controls and the attention of law enforcement, and diversion from the chemical and pharmaceutical industries.” Heroin production appears simpler in the DEA report; about 92% is from Mexico, refined from locally grown opium.

2. Psychostimulants: The methamphetamine supply system has likewise evolved over the past decade, though in this case away from local U.S. lab production. As with heroin, “most of the methamphetamine available in the United States is clandestinely produced in Mexico,” using precursor chemicals purchased from China and India. As with opioids and heroin, the finished products travel mainly by land.

3. Cocaine: Coca leaf is grown and refined into cocaine principally in Colombia and secondarily in Bolivia and Peru. DEA believes total cocaine production is around 1,900 tons per year. Cocaine trafficking routes appear to have remained stable over the last two decades, with cocaine transported in smuggling boats and planes, or using cargo containers, through the Caribbean with smaller quantities arriving by land through Central America and Mexico.


FUTURE READINGS:

CDC’s grim estimates of death by drug overdose in the United States, 2000-2021, summarized by year:

2021 107,500
2020   92,500
2019   71,100
2016   63,600
2012   41,500
2000   17,400

And the numbers in detail by year and substance.

The Substance Abuse and Mental Health Services Administration has tables for use of narcotics, abuse of prescription drugs, marijuana, alcohol and tobacco use.

The White House releases the 2022 National Drug Control Strategy, including health and overdose prevention, data improvement, DEA and CBP funding, anti-money laundering programs, and international police coordination.

And DEA’s 2020 National Drug Threat Assessment reviews use, production, and trade of narcotics.

And three global economy context questions:

(a) How large is the international narcotics trade? A 2019 RAND study estimates that in 2016 Americans were spending $150 billion on narcotics. This total included $50 billion on marijuana and $100 billion on heroin, cocaine, and methamphetamines, but did not venture a guess on opioids. Accepting RAND’s estimate for the sake of argument, a guess at the value of the imports would require understanding the markup from border to distributor to retail. As a guidepost, the National Coffee Association put U.S. consumer spending on coffee (also almost entirely imported) at $74 billion, or about 12 times that year’s $6 billion in coffee imports. A 10:1 markup for heroin, cocaine, and amphetamines would suggest an import value of around $10 billion, but presumably a criminal business’ markup would have to be much higher.  At 20:1, a figure of $100 billion in U.S. retail spending on narcotics would imply $5 billion in import value, the equivalent of about 1 percent of the $385 billion in legitimate imports from Mexico in 2021, and not far from the value of total U.S. coffee imports.  Obviously the 20:1 figure is arbitrary and could be quite different, and may also vary by narcotics type.

(b) How large is the criminal economy? On a world scale, a 2017 paper by the DC-based Center for Global Financial Integrity guessed at a total of $426 billion to $651 billion for illicit drug trade as of 2014, including both intra-country and cross-border transactions, as part of a larger $1.8-$2.2 trillion global shadow economy. (The other elements include counterfeiting, human trafficking, illegal wildlife/fishery/logging exports, and other illicit activities.) Cocaine, amphetamines, opiates and opioids accounted for about 60% of the illegal drug business, and marijuana and hashish-type products 40%. The ~$2 trillion estimate, if correct, would have been about 2.5% of that year’s $77 trillion global GDP.

(c) How many drug users are there, and which countries are the largest narcotics markets? UN’s Office on Drugs and Crime’s annual World Drug Report reviews production, transport, health, and other policy matters, and also estimates users counts worldwide.  Their most recent guesses:  209.2 million users of cannabis, 61.3 million of opioids, 34.1 million of amphetamines and other stimulants, 31.1 million of opiates, and 21.5 million of cocaine.  The analysis of use in UNODC’s 2022 report covers regions rather than countries, but suggests (though not stating explicitly) that the U.S. is the world’s largest narcotics market and largest importer: “North America” is the largest market for cocaine and amphetamines, and at par with Asia for opioids.  By population, comparing HHS user estimates for the U.S. to the UN’s worldwide estimates, American narcotics use seems slightly above the world average rate for amphetamines (2.6 million of the UN’s 34.1 million users), below the average for heroin and other opiates, and well above average for fentanyl-type opioids and cocaine.  Read more in the UNODC’s World Drug Report 2022.

ABOUT ED

Ed Gresser is Vice President and Director for Trade and Global Markets at PPI.

Ed returns to PPI after working for the think tank from 2001-2011. He most recently served as the Assistant U.S. Trade Representative for Trade Policy and Economics at the Office of the United States Trade Representative (USTR). In this position, he led USTR’s economic research unit from 2015-2021, and chaired the 21-agency Trade Policy Staff Committee.

Ed began his career on Capitol Hill before serving USTR as Policy Advisor to USTR Charlene Barshefsky from 1998 to 2001. He then led PPI’s Trade and Global Markets Project from 2001 to 2011. After PPI, he co-founded and directed the independent think tank Progressive Economy until rejoining USTR in 2015. In 2013, the Washington International Trade Association presented him with its Lighthouse Award, awarded annually to an individual or group for significant contributions to trade policy.

Ed is the author of Freedom from Want: American Liberalism and the Global Economy (2007).  He has published in a variety of journals and newspapers, and his research has been cited by leading academics and international organizations including the WTO, World Bank, and International Monetary Fund. He is a graduate of Stanford University and holds a Master’s Degree in International Affairs from Columbia Universities and a certificate from the Averell Harriman Institute for Advanced Study of the Soviet Union.

Read the full email and sign up for the Trade Fact of the Week
PPI’s Trade Fact of the Week: Energy makes up nearly a fifth of U.S. exports this year

FACT: Energy makes up nearly a fifth of U.S. exports this year.

THE NUMBERS: Energy share of U.S. merchandise exports –

2022*   18.1%
2021    16.8%
2020   10.5%
2010    6.4%
2000    1.7%
1932    13.2%**
* Six months of available data, January-June 2022
** Previous record


WHAT THEY MEAN:

Export growth figures are usually boring and small: A 2.3% growth rate might suggest a weak year; 7.5% or 10.2% a very good one; a drop of -2% would be exceptionally bad. Here are this year’s U.S. natural gas export rates to a string of European countries, based on the data available for the first six months of 2022:


Sweden 884%
Belgium 588%
Spain 394%
Italy 357%
France 352%
Poland 347%
Lithuania 274%
Netherlands 175%
U.K. 155%


What is going on here? Three things, one transitory and the other two suggesting an accelerating revolution in energy trade:

(a) The usual answer in natural-resource trade is the commodity markets. In the aftermath of Russia’s invasion of Ukraine, oil prices are up from $41.30 to $107 per barrel since 2020, and the International Monetary Fund’s index of natural gas prices is nine times its 2020 level. These effects are typically transitory – with prices up, export money goes up too; when they go back down, export earnings fall with them.

(b) The U.S. produces much more energy than before, propelled by investments made during the high-price China boom era, circa 2004-2012. The Department of Energy’s figures (measured by energy content) show U.S. production of oil, natural gas, and renewable energy up from 41 quadrillion BTUs in 2010 to 71 quadrillion BTUs in 2021. With a lot more available, the U.S. is accordingly exporting more than ever before.

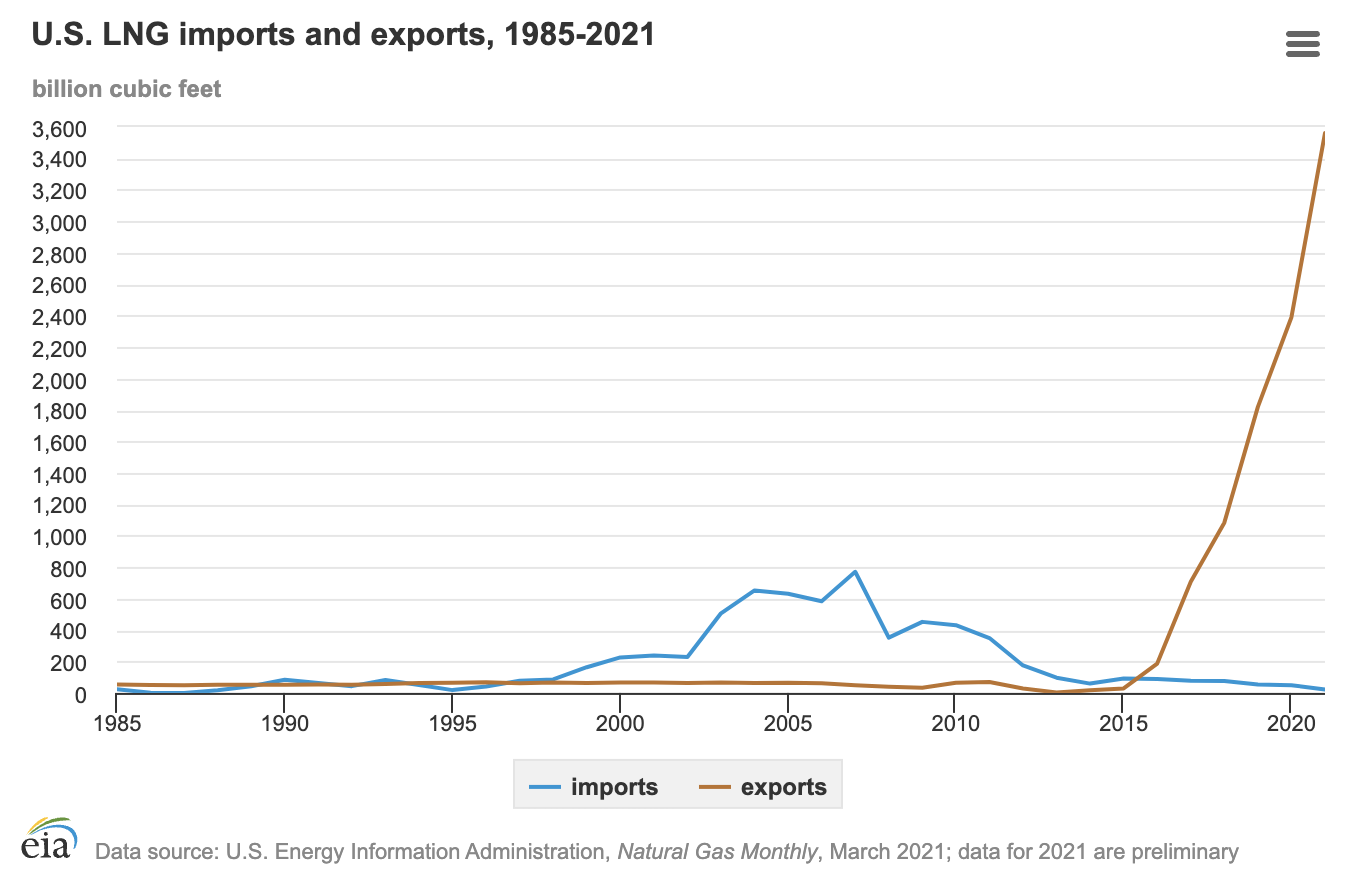
(c) Russia is no longer a reliable supplier. Russia’s use of energy supply as a political tool has convinced European buyers to find new sources, as PPI’s Paul Bledsoe very presciently advised three months before the invasion of Ukraine.  American liquefied natural gas (LNG) is the logical replacement on security grounds, and a lower-methane emissions option as well). Louisiana in particular, home to two of the U.S.’ seven LNG terminals, has seen its exports double in two years; Gov. Edwards, noting that “market forces disrupting the world economy are creating a historic opportunity for our state,” plans a set of new infrastructure investments to help make the shift permanent.

Taken together, the figures reveal an incipient revolution in world energy trade. At 16.8% of American merchandise exports in 2021, and 18.1% through June of 2022, energy is already well above the 89-year-old record set in the Hoover administration. (At 13.2%, or $208 million of that year’s Depression-shrunken $1.58 billion in total U.S. exports.) Internationally, having surpassed Russia and Saudi Arabia last year, the U.S. is the world’s largest energy* exporter for the first time in a century. The dollar figures look like this:

2022    $420 billion?**
2021     $240 billion
2020      $151 billion
2015      $105 billion
2010       $82 billion
2000       $13 billion

*  Crude and refined petroleum, natural gas, coal, electricity, other.
** Annualized based on six months of available data.

A graph from the Energy Information Administration (link below):


FUTURE READINGS:

PPI’s Paul Bledsoe on natural gas exports, lower-methane emissions, and European/Asian security:

December 2021, on Europe’s ability to reduce overall emissions and ease a security threat by replacing Russian with American natural gas.

And following up, June 2022, on cleaner/less dangerous energy for Asia.

Two takes from Louisiana: 

Governor John Bel Edwards and associates on European markets, infrastructure development, and Louisiana export growth.

And the Acadian Advocate looks at soaring LNG shipments from the six U.S. LNG terminals.

Data and a bit of explanation:

The Department of Energy’s Energy Information Administration explains liquefied natural gas.

… and tracks U.S. energy imports and exports.

The European Union’s Eurostat on energy imports from Russia (though only through 2021).

Sweden’s Energy Ministry reviews vulnerability to Russian energy coercion, March 2022.


ABOUT ED

Ed Gresser is Vice President and Director for Trade and Global Markets at PPI.

Ed returns to PPI after working for the think tank from 2001-2011. He most recently served as the Assistant U.S. Trade Representative for Trade Policy and Economics at the Office of the United States Trade Representative (USTR). In this position, he led USTR’s economic research unit from 2015-2021, and chaired the 21-agency Trade Policy Staff Committee.

Ed began his career on Capitol Hill before serving USTR as Policy Advisor to USTR Charlene Barshefsky from 1998 to 2001. He then led PPI’s Trade and Global Markets Project from 2001 to 2011. After PPI, he co-founded and directed the independent think tank Progressive Economy until rejoining USTR in 2015. In 2013, the Washington International Trade Association presented him with its Lighthouse Award, awarded annually to an individual or group for significant contributions to trade policy.

Ed is the author of Freedom from Want: American Liberalism and the Global Economy (2007).  He has published in a variety of journals and newspapers, and his research has been cited by leading academics and international organizations including the WTO, World Bank, and International Monetary Fund. He is a graduate of Stanford University and holds a Master’s Degree in International Affairs from Columbia Universities and a certificate from the Averell Harriman Institute for Advanced Study of the Soviet Union.

Read the full email and sign up for the Trade Fact of the Week

PPI’s Trade Fact of the Week: Greenland is losing 280 billion tons of ice each year

FACT: Greenland is losing 280 billion tons of ice each year.

THE NUMBERS: Volumes of fresh water –

Total worldwide:                  ~40.0 million cubic km
Antarctic ice sheets:             ~24.7 million cubic km
Groundwater & permafrost:  ~12.0 million cubic km
Greenland ice sheet:               ~2.9 million cubic km
Glaciers and ice-caps:              ~0.1 million cubic km
Lakes, ponds and rivers:          ~0.1 million cubic km


WHAT THEY MEAN:

As Congress concludes its work on the “Inflation Reduction Act,” with its arrays of decarbonization and clean industry programs, a note from NASA’s climate program at Caltech:

“The mass of the Greenland ice sheet has rapidly declined in the last several years due to surface melting and iceberg calving. Research based on observations from the Gravity Recovery and Climate Experiment (GRACE) satellites (2002-2017) and GRACE Follow-On (since 2018) indicates that between 2002 and 2021, Greenland shed approximately 280 gigatons of ice per year, causing global sea level to rise by 0.03 inches (0.8 millimeters) per year.”

How much water is this exactly? According to a rough estimate published by the U.S. Geological Survey, the world’s store of fresh water — all the glaciers, ice sheets, lakes, rivers, and groundwater combined — is about 40 million cubic kilometers by volume. About three fifths of this, or 24.7 cubic kms, is locked up in the 30-million-year-old Antarctic ice sheets. Ground water adds 12 million cubic kms. Greenland’s ice sheet — about 2.7 million years old and averaging a mile in height — holds about 2.9 million cubic kms. By volume and height, this makes the ice sheet something like the Mediterranean Sea suspended a few feet above the Arctic Ocean. Alternatively, Greenland holds about 15 times as much fresh water as the 0.2 million cubic kms of liquid in all the picturesque and historic lakes, rivers, and mountain glaciers of the Americas, Asia, Africa, Australia, Europe, and smaller islands combined.

How much, then, is 280 gigatons of ice? By one comparison, converted into liquid this would be about half the 530 gigatons of water flowing down the Mississippi River each year. By another, given that by arithmetic the Greenland ice sheet weighs about 2.9 quadrillion tons, losing 280 billion tons means that about 0.01% of it, or one ten-thousandth, is melting off each year. This is likely to accelerate: A recent survey published by the National Academy of Sciences estimates that expected warming through 2100 is likely to melt enough of it to raise sea levels by one meter, implying loss of about an eighth of the ice sheet or twice the above-ground fresh water outside Antarctica. Melting all of it would raise sea levels by about 24 feet, and require about 1000 years under current climate-change trajectory.* So, Congress’ action this week is perhaps not very timely, but it is also not too late.

* The presumably less likely case of an Antarctic ice-sheet melt would raise the seas by 190 feet.


FUTURE READINGS:

Flight  

NASA’s GRACE project at Caltech monitors Greenland ice sheet melt rates.

Danish research program EastGrip is a 30-person team investigating the behavior of the ice sheet through radar, drilling for ice cores to a depth of 2500 meters (1.5 miles), and surface observations to understand past climate effects on ice sheets, chemical content at various levels, melting and internal ice flows, etc.

Proceedings of the National Academy of Sciences on likely future melting trends.

The National Snow and Ice Data Center’s “Greenland Ice Sheet Today” bulletin shows surface melting at “moderate” levels compared to 2020 and 2021, principally along the western/southern coastal strip with some on the far northern coast.

… and also from the NSIDC, a look at adaptation in southern Greenland polar bear populations.

And the U.S. Geological Survey counts the world’s fresh water.

Policy: 

The Senate Democratic Caucus summarizes the Inflation Reduction Act’s energy and climate change provisions.

The White House’s Office of Science & Technology Policy announces Arctic policies.

And more about Greenland:

The world’s largest island and undisputed fresh-water superpower is roughly one-fifth the size of the United States, and 80% covered by ice. About 56,000 people — 6,000 Danes, 50,000 Inuit — live on the actually “green” bits. Administered by Denmark since 1721, in constitutional terms Greenland is a politically autonomous kingdom under the Danish monarchy, with a right in theory to declare independence. The odd interlude in which the Trump administration suddenly proposed to “buy” it four years ago rested on a complex set of concerns about access to potentially large mineral lodes (Greenland is thought to be home to an array of rare-earth metals useful in clean-energy manufacturing but potentially damaging to mine, as well as messy to mine; also gold, silver, zinc, tantalum, etc.) along with concerns about Arctic sea lanes and intelligence surveillance.  For now, Greenland’s main industry is about $1 billion in cold-water fisheries for snow crab, cold-water shrimp, turbot, halibut, and other northern catch.

The Greenland government’s page, evidently only in Greenlandic (an Inuit language) and Danish.

Denmark reviews mineral resources.

U.S. policy, via the Embassy in Copenhagen.

The NYT looks at metal ores and mining.

…while NPR catalogues big-power interests and motives in the far north.

Perspective from the Inuit Circumpolar Council, with indigenous reps. from the U.S., Canada, Greenland, Denmark, Finland, and (still) Russia.

And the 10-day weather report for Nuuk (50°F and wet all week).


ABOUT ED

Ed Gresser is Vice President and Director for Trade and Global Markets at PPI.

Ed returns to PPI after working for the think tank from 2001-2011. He most recently served as the Assistant U.S. Trade Representative for Trade Policy and Economics at the Office of the United States Trade Representative (USTR). In this position, he led USTR’s economic research unit from 2015-2021, and chaired the 21-agency Trade Policy Staff Committee.

Ed began his career on Capitol Hill before serving USTR as Policy Advisor to USTR Charlene Barshefsky from 1998 to 2001. He then led PPI’s Trade and Global Markets Project from 2001 to 2011. After PPI, he co-founded and directed the independent think tank Progressive Economy until rejoining USTR in 2015. In 2013, the Washington International Trade Association presented him with its Lighthouse Award, awarded annually to an individual or group for significant contributions to trade policy.

Ed is the author of Freedom from Want: American Liberalism and the Global Economy (2007).  He has published in a variety of journals and newspapers, and his research has been cited by leading academics and international organizations including the WTO, World Bank, and International Monetary Fund. He is a graduate of Stanford University and holds a Master’s Degree in International Affairs from Columbia Universities and a certificate from the Averell Harriman Institute for Advanced Study of the Soviet Union.

Read the full email and sign up for the Trade Fact of the Week

PPI’s Trade Fact of the Week: Over 100 million people worldwide have been forcibly displaced from their homes

FACT: Over 100 million people worldwide have been forcibly displaced from their homes.

THE NUMBERS: UNHCR’s annual counts of refugees, internally displaced people, asylum seekers, and others forced from their homes –

2022        103 million
2021          89 million
2020          82 million
2016          65 million
2012          42 million


WHAT THEY MEAN:

From Matthew 2:13, the “Flight to Egypt” story:

“An angel of the Lord appeared to Joseph in a dream and said, “Rise, take the child and his mother, and flee to Egypt, and remain there till I tell you; for Herod is about to search for the child, to destroy him.” And he rose and took the child and his mother by night, and departed to Egypt, and remained there until the death of Herod.”

In modern legal terms, the family would be “refugees”, under the relevant 1951 U.N. Convention: people who have crossed a national border “owing to a well-founded fear of being persecuted for reasons of race, religion, nationality, membership of a particular social group or political opinion,” and cannot safely return home. The passage does not recount the family’s reception in Egypt, then a Roman province, though the implication is that they found a place to live and a temporary livelihood. An announcement from the University of Maryland’s Rosham Center for Persian Studies (a 15-year-old center for Persian language and cultural study) provides a modern parallel, combining government support and policy with non-profit charities and individual volunteerism:

“Afghan refugees are currently the largest refugee population in the D.C.-Maryland-Virginia area served by the International Rescue Committee. While making the difficult adjustment to life in a new country they frequently struggle with a variety of problems, including social isolation/integration into the community, developing English language skills, and learning about local community resources and American culture.  UMD students chosen to participate in the ARA Program as ARA interns help our new Afghan neighbors during their transition into their new life in America while themselves benefiting from the opportunity to learn more about Afghan Persian culture and the Dari dialect of Persian spoken in Afghanistan. ARA interns also receive training in refugee care from the IRC and additional training in Afghan culture and Dari (Persian) from Roshan-UMD faculty.”

Background: The U.N. High Commission on Refugees (UNHCR) keeps an annual count of refugees, along with “internally displaced” people (i.e., those forced to leave home for similar reasons but who have not crossed an international border), and several other categories* of people forced from homes by violence or threat of persecution.  The steadily rising tallies over the last decade, and the acceleration of their growth in the last five years, are a human index of deteriorating world peace and security:


  • In 2012, UNHCR counted 41.8 million ‘forcibly displaced’ people, including 10.5 million refugees, 26.4 million internally displaced people, 10.5 million cross-border refugees, and 5.8 million in other classifications.
  • By the end of 2016, this count had risen to 65 million, including 17 million refugees, 40 million internally displaced people, and 8 million other.
  • Five years later, at the end of 2021, the count was at 89 million, pushed up by a series of state breakdowns and civil wars: overthrows of elected governments in Afghanistan and Burma, Russian military intervention in Syria, civil wars in Ethiopia and Yemen, economic collapse in Venezuela. UNHCR’s end-2021 “Global Trends” report finds that children made up 40% of this total, or 36.5 million boys and girls.
  • By mid-2022, the Russian invasion of Ukraine had raised the total above 100 million for the first time, with 4.6 million Ukrainians now refugees and another 6.5 million internally displaced, along with an additional 367,000 in Myanmar and 270,000 in Burkina Faso.


Parallel to this is a second story of tenuous hope for shelter and resettlement.  Six countries now host nearly half the world’s refugees: Turkey with 3.8 million, Colombia with 1.8 million, Pakistan and Uganda with 1.5 million each, Germany and Poland with 1.3 million each. In the United States, roughly three million Americans (including two currently serving Members of Congress) came to the U.S. as refugees, and are now permanent residents or citizens. From the turn of the century to 2016, the State Department was admitting 27,000-85,000 refugees per year for resettlement, which was roughly 3% to 8% of net immigration, depending on the year.  The Trump administration cut admissions to 11,411 in FY2021, the lowest level since passage of the 1980 U.S. law defining refugee eligibility. The count has rebounded a bit since, with 15,100 arriving from the beginning of the Fiscal Year in September 2021 through June 2022, including the Afghans now acclimatizing at the University. In parallel with this, the Justice Department runs a “Temporary Protected Status” program, with stays of deportation and work authorization (though not citizenship) for about 400,000 nationals of 15 countries.

* Other classifications in UNHCR’s count of forcibly displaced people include Palestinians in the U.N. Relief and Works Administration’s jurisdiction, asylum seekers, and Venezuelans displaced abroad.


FUTURE READINGS:

Flight  

UNHCR reports over 100 million people forcibly displaced from homes worldwide.

… also notes 20-year trends, main source countries, countries with the largest incoming populations, and more.

… and summarizes country situations in:

Ukraine

Afghanistan

Syria

Ethiopia

Venezuela

Burma

Shelter 

The Justice Department’s Temporary Protected Status data.

The State Department’s refugee resettlement program site.

… and State Dept data on refugee resettlement from FY2000 through FY2022 (through June). The largest arriving groups for the first nine months of FY2022: 3,735 from Congo (DROC), 3,525 from Syria, 1,308 from Sudan, 1,129 from Burma, 1,028 from Ukraine, and 846 from Afghanistan.

The Department Health and Human Services explains available services.

U.S. Citizenship and Immigration Services on sponsoring Ukrainian refugee arrivals.

And the University of Maryland’s Rosham Center explains its Afghan refugee support program.

And resettlement 

Rep. Stephanie Murphy, D-Fla., on growing up in a refugee family and support for Afghan allies of the U.S.

Minnesota’s Hmong community celebrates a local girl.

Delaware encourages refugee business creation.

And Atlanta does the same.

D.C.’s African refugee community runs a family support and job center for newly arrived Ethiopian, Eritrean, Syrian and others.


ABOUT ED

Ed Gresser is Vice President and Director for Trade and Global Markets at PPI.

Ed returns to PPI after working for the think tank from 2001-2011. He most recently served as the Assistant U.S. Trade Representative for Trade Policy and Economics at the Office of the United States Trade Representative (USTR). In this position, he led USTR’s economic research unit from 2015-2021, and chaired the 21-agency Trade Policy Staff Committee.

Ed began his career on Capitol Hill before serving USTR as Policy Advisor to USTR Charlene Barshefsky from 1998 to 2001. He then led PPI’s Trade and Global Markets Project from 2001 to 2011. After PPI, he co-founded and directed the independent think tank Progressive Economy until rejoining USTR in 2015. In 2013, the Washington International Trade Association presented him with its Lighthouse Award, awarded annually to an individual or group for significant contributions to trade policy.

Ed is the author of Freedom from Want: American Liberalism and the Global Economy (2007).  He has published in a variety of journals and newspapers, and his research has been cited by leading academics and international organizations including the WTO, World Bank, and International Monetary Fund. He is a graduate of Stanford University and holds a Master’s Degree in International Affairs from Columbia Universities and a certificate from the Averell Harriman Institute for Advanced Study of the Soviet Union.

Read the full email and sign up for the Trade Fact of the Week
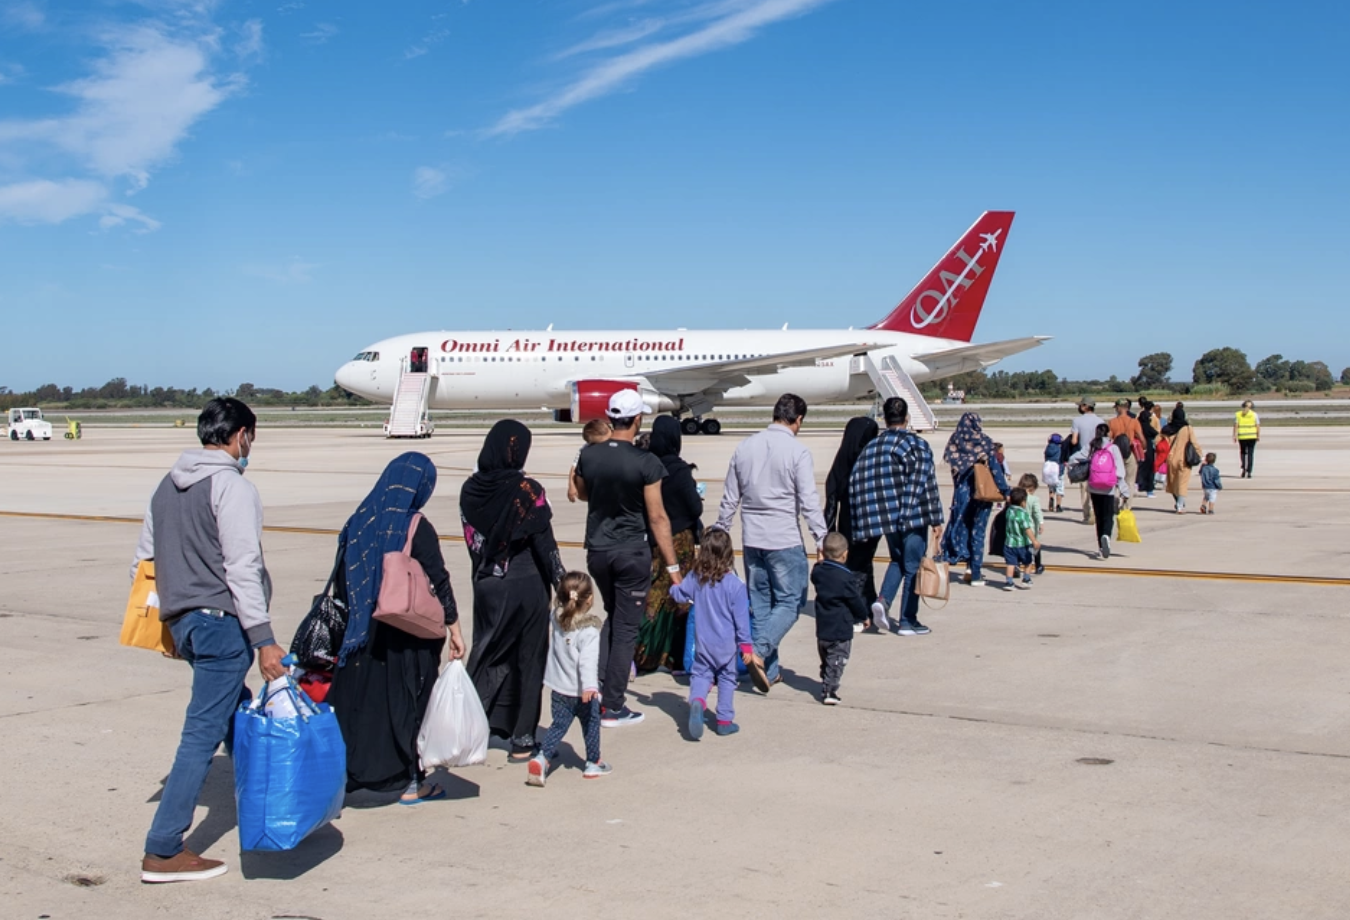
PPI’s Trade Fact of the Week: Digital bank accounts help Cambodian garment workers stay safe and earn more from their wages

FACT: Digital bank accounts can help Cambodian garment workers stay safe and earn more from their wages

THE NUMBERS: Estimated monthly data flows over the internet, worldwide* –

2022                396 exabytes
2020                254 exabytes
2015                  76 exabytes
2010                    3 exabytes
1998           0.0001 exabytes

* Estimates from Cisco’s Visual Networking Index, 2017 and earlier reports.

WHAT THEY MEAN:

It is a quarter-century since WTO members approved a “moratorium” on applying tariffs to electronic transmissions, at “MC-2” — the second Ministerial conference — in the spring of 1998. Last June, a quarter-century later, the twelfth Ministerial conference extended this once again, with another decision point at the 13th Ministerial conference likely in late 2023. In the intervening years:


  •  The world’s internet user community has grown from 147 million (of whom 77 million were American) to 5.3 billion or two-thirds of the world’s people in mid-2022.
  • The digital economy has grown to about 15.5% of global GDP, equivalent to $16 trillion, a figure close to the $18 trillion Chinese and EU economies.
  • The scale of information flowing across telecom networks, according to estimates in Cisco’s now-slightly-dated Virtual Networking Initiative, rose about 4-million-fold, from 100 terabytes to a likely 396 exabytes per month.
  • The cost of transferring information has dropped by a likely 99%, as fiber-optics replaced copper submarine cables and low-altitude satellites proliferated.
  • Debate over the “moratorium” this spring centered on growth, development, and taxation: How does the economic and social value of rising information flows match up against the revenue poor-country governments could take by taxing these information flows (while in doing so slowing their growth). Here is a small human case for the choice WTO members have made so far:


Cambodia’s 800,000 garment workers, mostly young women from rural towns and villages, have been the country’s engine of industrial development over the past generation. At the national minimum wage for garment factories, they earn $194 and up monthly, which is about 50% above Cambodia’s $1,591 per capita income at paycheck time. But they lose some of this, and assume personal risks that workers in middle-income and rich countries don’t, because they are mostly paid in cash and have great difficulty finding safe places to put their money.

Visiting factories around Phnom Penh a decade ago, the Trade Fact series editor noticed that almost all the line workers at sewing machines were wearing silver necklaces, earrings, and bangles. Experts and factory managers explained that this was not a fashion choice, but the best among a poor set of savings options. Since rural Cambodia lacked an effective birth certificate or ID system, workers could not open bank accounts and took wages in cash. To avoid carrying lots of paper money around, or trying to hide it in their (usually shared) apartments, they would visit pawn shops and buy small pieces of jewelry, essentially ‘wearing’ their savings until the holidays. Then they would resell the jewelry at a small loss in order to bring remittance money and presents to their families.  In financial-services jargon, this is a negative-interest savings account, but the best choice available since it is physically safer than others.

World Bank researchers now see the falling cost and eased availability of financial information transfer — the ability to move data cheaply and securely, combined with worker’s widespread adoption of smartphones with low-cost monthly data plans — beginning to change this system. For a one-time fee of $5,900, a Cambodian garment factory can contract with a bank or telecom company to replace cash payouts with automatic digital deposit that workers can access through phones and ATMs with unique pins. This in turn will enable a worker to earn interest and develop credit rather than losing part of her wages to pawnshops, and send remittances home digitally rather than carrying a purseful of cash on a bus.

This local case has analogues throughout the low-income world as data flows grow cheaper and reach more countries:  financial inclusion for informal-sector workers, telemedicine for rural areas, weather and soil bulletins for farmers, and other support for the poor. More generally, World Bank researchers believe that raising access to mobile digital service by 10% in low-income countries raises per capita income by 2% (and in sub-Saharan Africa by a somewhat higher 2.5%). The WTO members will be arguing these matters as they prepare for “MC-13” sometime late in 2023 or early 2024.  Arguments for slowing this growth by taxing it, however attractive to accountants in Finance ministries, need to be weighed against larger-scale potential loss in development and daily life.

FUTURE READINGS:

Digital growth and policy 

What does “grow from 100 terabytes per month in 1998 to 396 exabytes in 2022” mean? A “byte” is eight binary digits, enough information to form one letter. Prefixes run as follows: kilo represents 1,000, mega 1 million, giga 1 billion, tera 1 trillion, peta 1 quadrillion, exa 1 quintillion, and zetta 1 sextillion. Yotta comes next, but has not yet been achieved by anything human. Thus, the 396 exabytes thought to be transmitted each month this year are about 4 million times more information than the 100 monthly terabytes of 1998.  By analogy, the ratio of digital information flows in 1998 to those of 2022 is about the same as the ratio of the 2 million trees in and around Washington D.C., to the 3 trillion trees thought to be alive and growing on Planet Earth.

Cisco’s most recent Annual Internet Report, with counts of users, devices, and speed for the world and regions.

The WTO looks to another debate on electronic transmissions, tariffs, finance, and development in its next Ministerial conference.

Data flow, development, and the garment worker 

The World Bank examines the role of digital information and inclusion in low-income country development.

… and looks at the transition from cash payments to digital banking for Cambodian garment workers.

The International Labour Organization has a wide-scale take on life and work in Cambodia’s garment and shoe factories.

And a look back:

The White House electronic commerce report, from the Clinton administration in 1997, argues that “Unnecessary regulation of [Internet-based] commercial activities will distort development of the electronic marketplace by decreasing the supply and raising the cost of products and services for consumers the world over. … Accordingly, governments should refrain from imposing new and unnecessary regulations, bureaucratic procedures, or taxes and tariffs on commercial activities that take place via the Internet..

CNN recalls the world’s Internet user community as of 1998.

And the WTO’s 1998 Declaration on Electronic Commerce.

ABOUT ED

Ed Gresser is Vice President and Director for Trade and Global Markets at PPI.

Ed returns to PPI after working for the think tank from 2001-2011. He most recently served as the Assistant U.S. Trade Representative for Trade Policy and Economics at the Office of the United States Trade Representative (USTR). In this position, he led USTR’s economic research unit from 2015-2021, and chaired the 21-agency Trade Policy Staff Committee.

Ed began his career on Capitol Hill before serving USTR as Policy Advisor to USTR Charlene Barshefsky from 1998 to 2001. He then led PPI’s Trade and Global Markets Project from 2001 to 2011. After PPI, he co-founded and directed the independent think tank Progressive Economy until rejoining USTR in 2015. In 2013, the Washington International Trade Association presented him with its Lighthouse Award, awarded annually to an individual or group for significant contributions to trade policy.

Ed is the author of Freedom from Want: American Liberalism and the Global Economy (2007).  He has published in a variety of journals and newspapers, and his research has been cited by leading academics and international organizations including the WTO, World Bank, and International Monetary Fund. He is a graduate of Stanford University and holds a Master’s Degree in International Affairs from Columbia Universities and a certificate from the Averell Harriman Institute for Advanced Study of the Soviet Union.

Read the full email and sign up for the Trade Fact of the Week
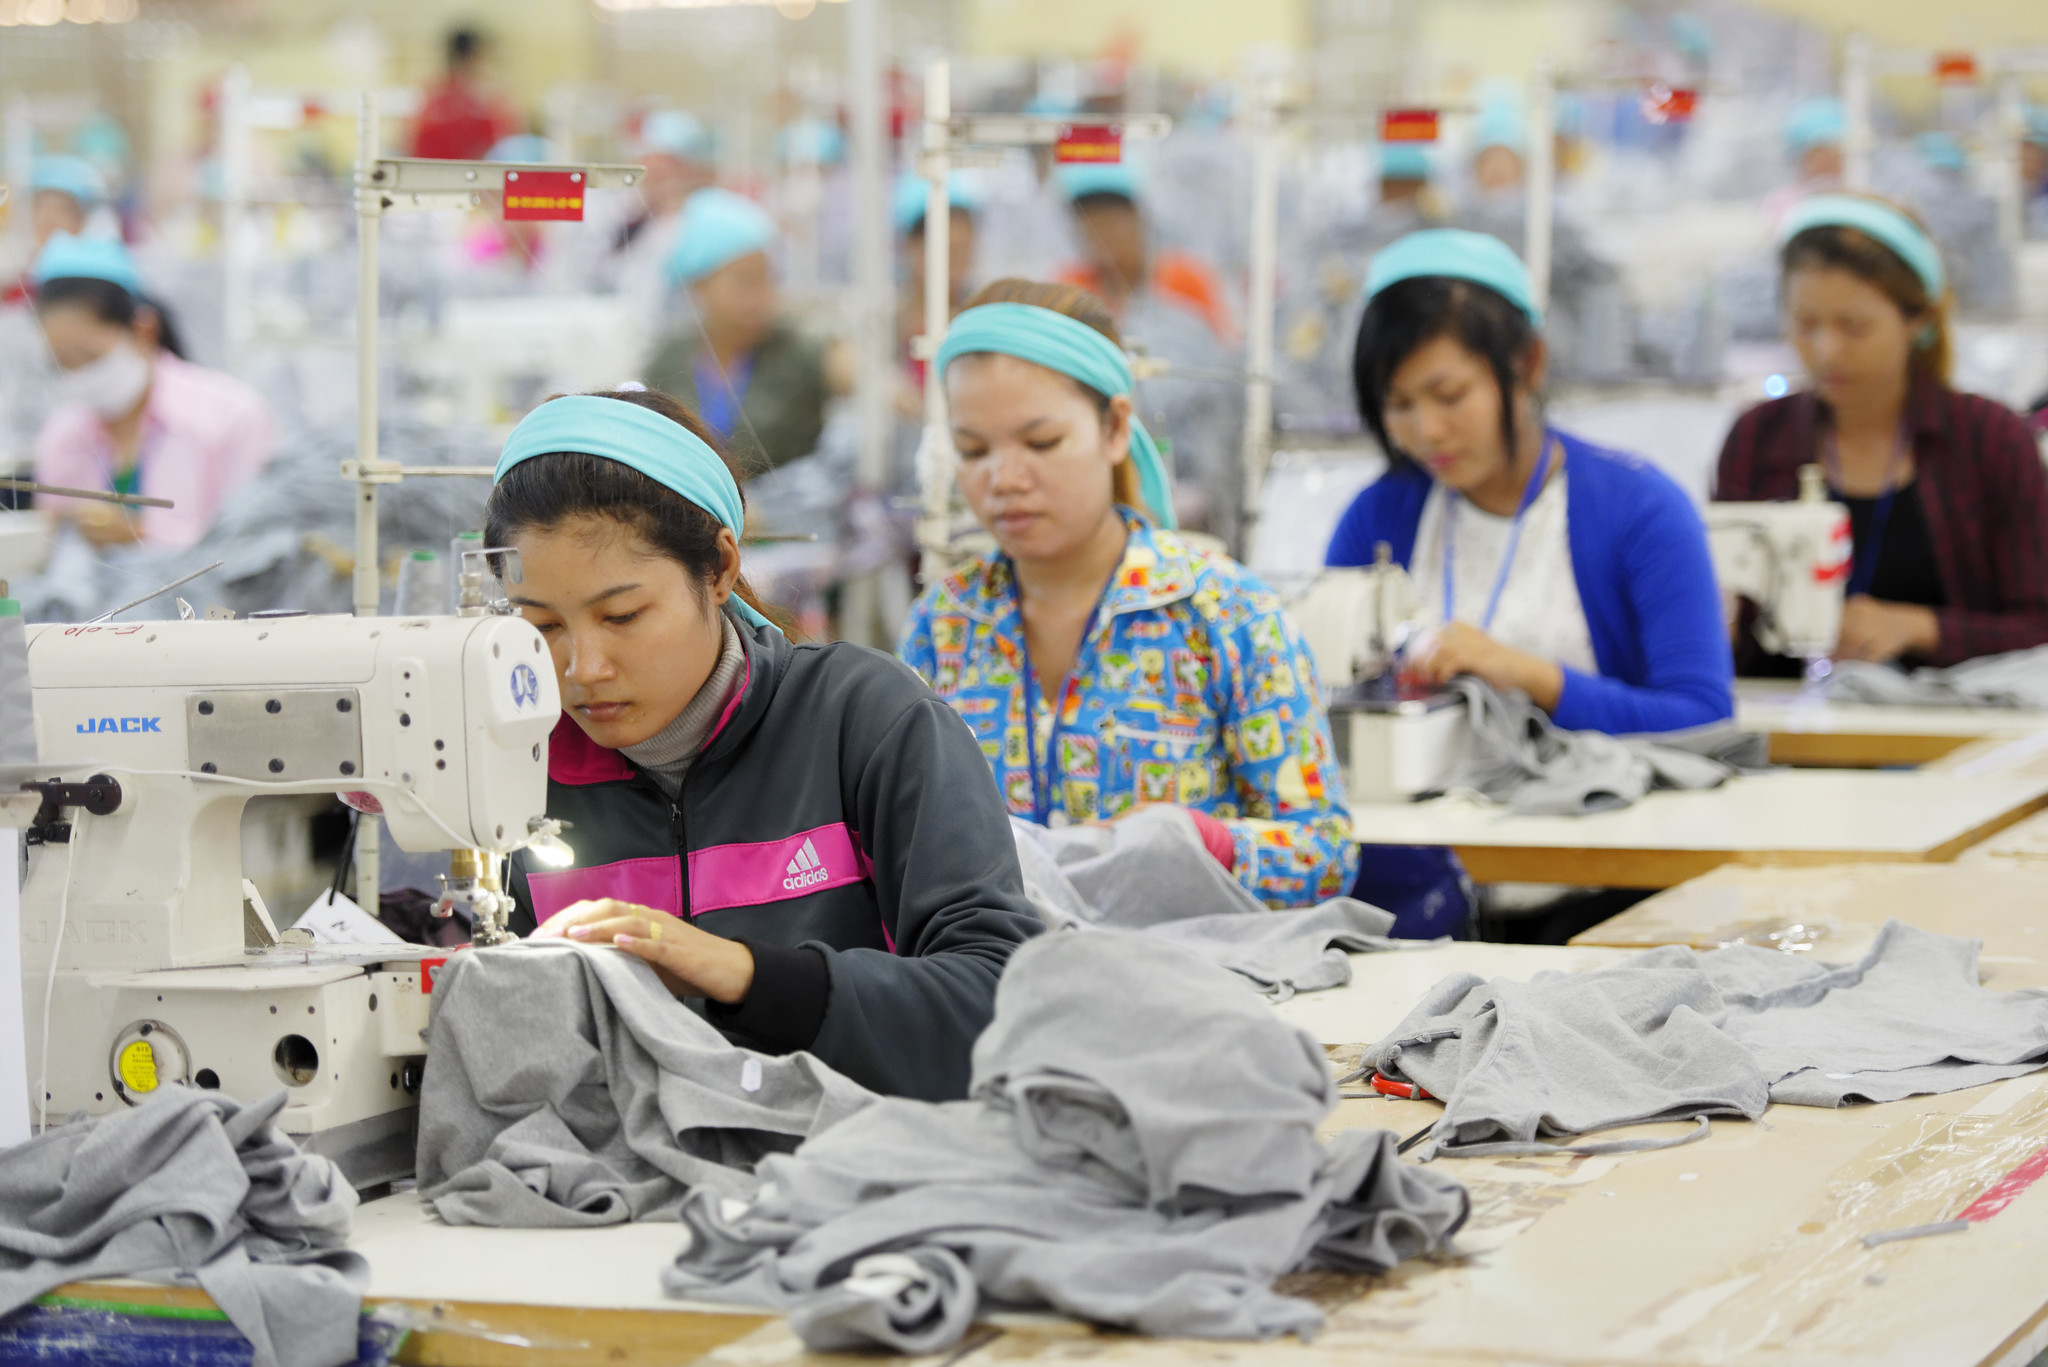
PPI’s Trade Fact of the Week: 4.85 billion people have been vaccinated against COVID-19 worldwide

FACT: 4.85 billion people have been vaccinated against COVID-19 worldwide


THE NUMBERS: Vaccination rates for adults, by world income group*

Upper-middle income countries       78%
High-income countries                      73%
United States                                     67%
World                                                  61%
Lower-middle income countries        55%
Low-income countries                        19%

Source: Ourworldindata.org for percentages by income level. World Bank definitions for these classifications are above $13,205 in Gross National Income per capita for ‘high-income, $4,206 – $13,204 for upper-middle income, $1,086 – $4,205 for lower-middle income, and under $1,085 for low-income.


WHAT THEY MEAN:

The world’s first COVID vaccine jab, delivered by nurse May Parsons, went to a 91-year-old Margaret Keenan at University Hospital Coventry in England, on December 8, 2020. That was 331 days after the first publication of the coronavirus’ DNA sequence. With another 589 days have gone by since Ms. Keenan’s first shot, where do we stand?

According to the Johns Hopkins University Coronavirus Information Center, health care providers like Ms. Parsons have given 11.84 billion vaccine shots worldwide. This has “fully vaccinated” 4.84 billion people, or 61% of the world’s population. (“Fully vaccinated” by JHU’s definition: two mRNA shots or one Johnson and Johnson shot.)  A study last month conducted by the British medical journal The Lancet calculates that these vaccinations have cut worldwide COVID-19 deaths by a range from 14.4 million to 19.8 million, in the context of an epidemic of 565 million known cases and 6.4 million known deaths. Each day the total rises a bit, as providers administer about 9 million more shots. This is a remarkable, even stunning, achievement of government and private-sector science, transnational manufacturing and logistics, and health-provider delivery.  But it remains an achievement with gaps; and these may grow more important as new variants emerge and immunity conferred through early vaccination fades.

One gap is that of income. People in rich and upper-middle income countries are somewhat more likely to be vaccinated than people in lower-middle-income countries, and low-income countries are far behind both. Low-income countries also appear to be relatively more reliant on Chinese- and Russian-produced vaccines that offer lower levels of protection than U.S./European vaccines. There are also some gaps by region – vaccination rates appear relatively high in South America, East Asia, ASEAN, the Pacific Islands and western Europe, and relatively low in southern and eastern Europe, the Middle East, the Caribbean, South Asia, and Africa. These general patterns have many exceptions — low-income Asian countries including Cambodia and Bhutan are near the top of the vaccination-rate tables, for example — and some countries in very similar circumstances report quite different results. As an extreme case, the world-low vaccination rate in JHU’s table is Burundi’s 0.1% of the population (13,800 of 12 million people); next-door Rwanda is at 65%, essentially the same as the United States.

The U.S. in a way mirrors the international pattern, with vaccination rates by state varying widely, and modestly correlating with state median income levels, political divisions, and larger geography. New England, where vaccination rates are in the 75% to 84% range, is comparable to the rates in Japan, France, and Australia, and taken as a distinct region would be near the top of the high-income spectrum. D.C., Hawaii, Puerto Rico, New York and New Jersey are also in the top ten. The “least vaccinated” group includes Wyoming and a set of deep South states; here, rates are in the 51%-55% range and at par with lower-middle income countries such as Tajikistan, Bolivia, and Honduras (and upper-middle income Russia). Explanations for relatively high U.S. state rates of vaccination may include lower public “vaccine hesitance”, strong outreach from state governments, high health-provider-to-population ratios and low levels of uninsured people.  Explanations for lower rates, the reverse.

A table illustrates, with vaccination levels in sample countries and U.S. states drawn from the Johns Hopkins University Coronavirus Information Center:


Much, then, achieved. But with 3 billion still unvaccinated around the world, mortality counts still at 15,000 weekly, new variants emerging every few months, and many early vaccination recipients needing booster shots, much still to do.

* Using the District’s own 77% count; JHU has a perplexing 100% rate for D.C.


FUTURE READINGS:

The Lancet calculates that vaccinations have saved between 14.4 million and 19.8 million lives

And the Royal College of Nursing on Parsons, Keenan, and the first COVID shot.

Data on vaccination rates, new cases, death rates by country and U.S. state, etc. 

Ourworldindata.org has an interactive site allowing selection of particular countries and regions.

Johns Hopkins U. Coronavirus Information Center reports 6.4 million deaths among 560 million cases since December 2020.  The mortality count has diminished to a still-high 12,000 deaths per week worldwide, from levels in the range of 50,000-100,000 deaths per week from mid-2020 through late 2021.

At home:

Rhode Island’s 84% vaccination rate is the highest in the U.S.

Washington, D.C., is at 77% by its own count; the JHU list somehow credits the District with a 100% vaccination rate. Either way, one of the top U.S. vaccination performers.  Mayor Muriel Bowser explains vax requirements.

The Centers for Disease Control and Prevention COVID-19 site.

Overseas:

USAID outlines its COVID aid program in low- and middle-income countries.

The WTO explains the state of debate on intellectual property rules and COVID.

The African Union outlines vaccination trends and policies in Africa.

The Rwanda Biomedical Centre has Q&A on vaccination.

And the OECD reviews the supply chains that produce and deliver vaccines.


ABOUT ED

Ed Gresser is Vice President and Director for Trade and Global Markets at PPI.

Ed returns to PPI after working for the think tank from 2001-2011. He most recently served as the Assistant U.S. Trade Representative for Trade Policy and Economics at the Office of the United States Trade Representative (USTR). In this position, he led USTR’s economic research unit from 2015-2021, and chaired the 21-agency Trade Policy Staff Committee.

Ed began his career on Capitol Hill before serving USTR as Policy Advisor to USTR Charlene Barshefsky from 1998 to 2001. He then led PPI’s Trade and Global Markets Project from 2001 to 2011. After PPI, he co-founded and directed the independent think tank Progressive Economy until rejoining USTR in 2015. In 2013, the Washington International Trade Association presented him with its Lighthouse Award, awarded annually to an individual or group for significant contributions to trade policy.

Ed is the author of Freedom from Want: American Liberalism and the Global Economy (2007).  He has published in a variety of journals and newspapers, and his research has been cited by leading academics and international organizations including the WTO, World Bank, and International Monetary Fund. He is a graduate of Stanford University and holds a Master’s Degree in International Affairs from Columbia Universities and a certificate from the Averell Harriman Institute for Advanced Study of the Soviet Union.

Read the full email and sign up for the Trade Fact of the Week
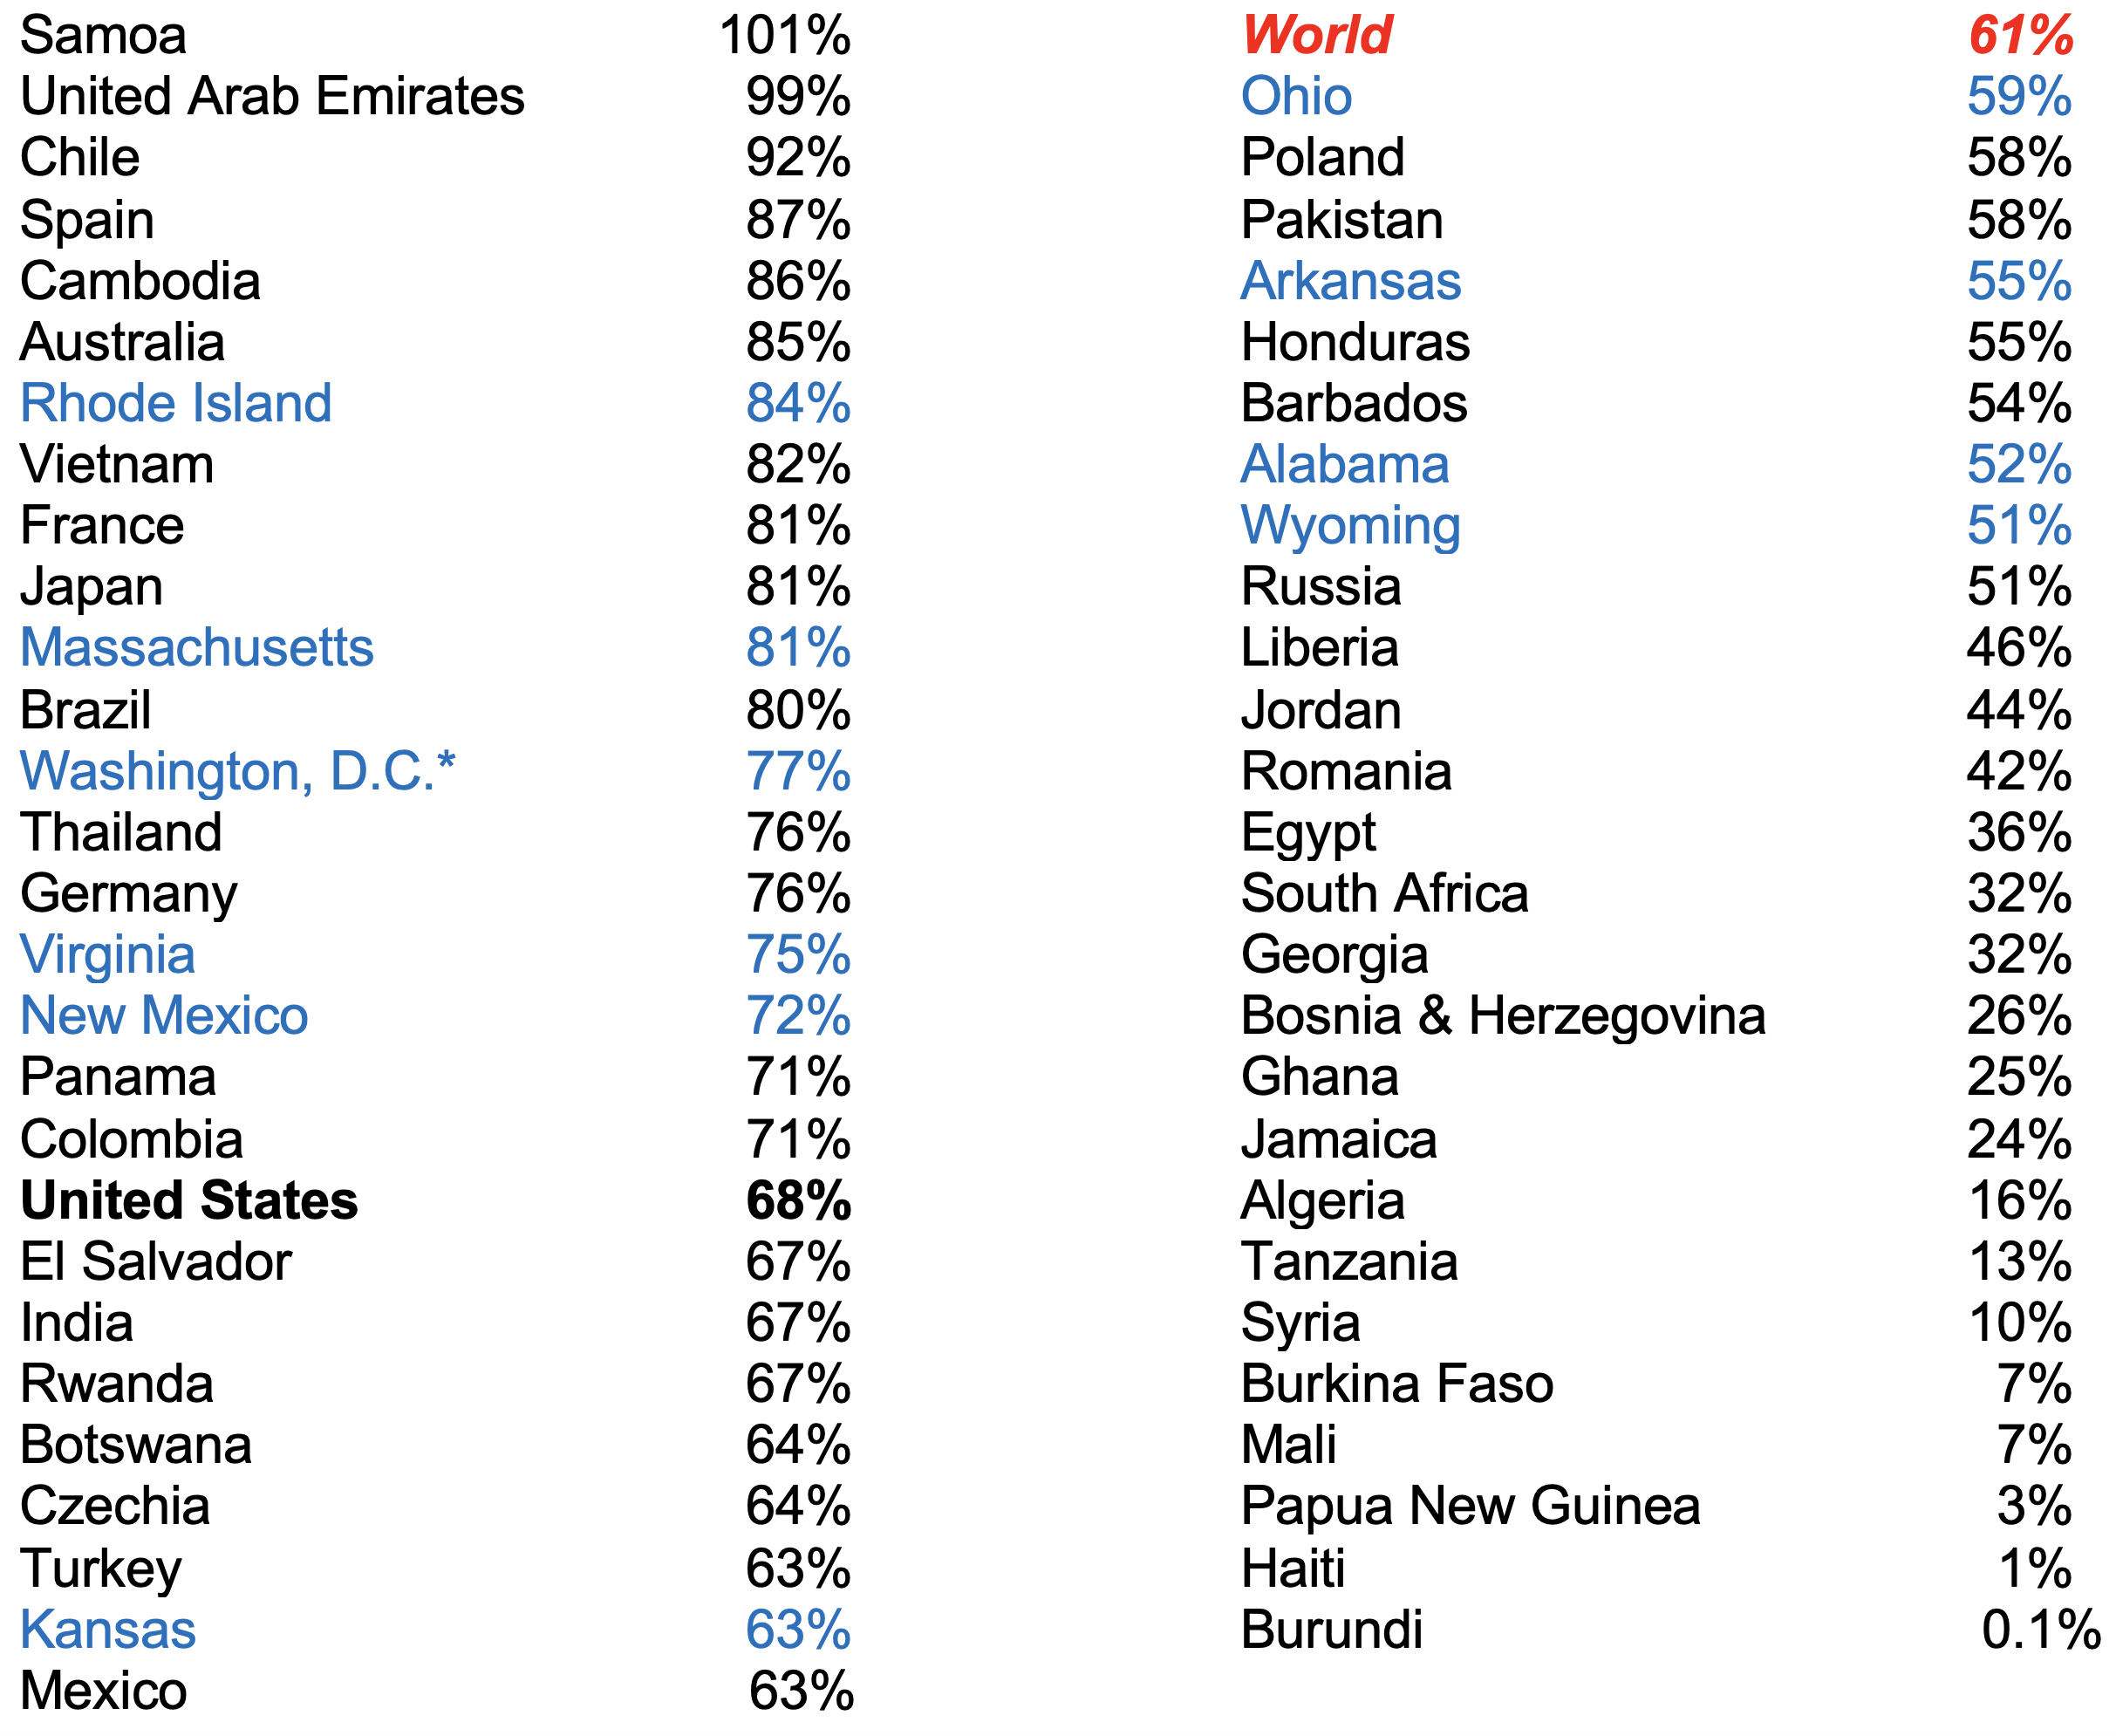
PPI’s Trade Fact of the Week: World shipping container capacity has grown six-fold since 2000

FACT: World shipping container capacity has grown six-fold since 2000


THE NUMBERS: World container-shipping fleet capacity, in TEUs* –

2022         25.8 million TEU
2010          12.8 million TEU
2000          4.3 million TEU
1990            1.2 million TEU
1980            0.5 million TEU

* “Twenty-foot Equivalent Units.” A TEU represents one 20 x 8 x 8.5 foot shipping container; a 40-foot container is two TEUs.


WHAT THEY MEAN: 

A quick modern maritime trade history, in three ships:

1. The Warrior: In 1954, the National Academy of Sciences studied the voyage of a “general cargo” freighter from New York to Hamburg. The Warrior, measuring 142 meters long, 19 wide, and 32 deep, had a crew of 44. On this voyage it carried 194,582 individual pieces of cargo, which weighed 5,015 tons and arrived at the port in a kaleidoscopic 15 types of “packaging.” The study’s author counted 24,036 bags, 10,671 boxes, 717 cartons, 74,908 cases, 5 “reels”, 815 barrels, 888 cans, 15,38 drums, 2,877 packages, 2,634 pieces, 21 crates, 10 transporters, 2,880 bundles, 53 wheeled vehicles, and 1,525 “undetermined” types of packages. A 22-person “longshore gang” took 35 days to pack this cargo in wooden pallets in New York and load it onto the ship. The German crew at the other end of the trip needed 4 days to unload it after arrival.

2. The Ideal-X: The first container ship, a retrofitted World War II freighter renamed Ideal-X, launched in April 1956 from Newark on a trip to Houston. It was about the same size as the Warrior — 160 meters long, 9 wide, and 21 deep — and carried 58 proto-containers holding 10,572 tons of cargo. Malcolm McLean, the North Carolina trucking executive who designed it, is said to have calculated that traditional “breakbulk” loading of Warrior-type ships cost $5.83 per ton of cargo. (“Breakbulk”: Loading individual cargo items into ship holds after packing them in wooden pallets; see below for a real-life case study in this.) Simply disconnecting a truck’s trailer from the chassis and putting it on deck, by contrast, cut this cost by 97%, to 16 cents per ton. Ideal-X took eight hours to load.

By 1990, a worldwide fleet of 1169 container-ships was carrying around over 1.2 million TEU, or an average of over 1,000 twenty-foot containers per ship. A decade-old but still striking paper (Daniel Bernhofen, Zouheir el-Sahli, Richard Kindner) investigated the effects of the shift from break-bulk to containerized cargo, concluding that it had been about twice as powerful a driver of trade growth as tariff cuts and trade agreements. Specifically:

a. Participation in the two multilateral GATT agreements of the era — the “Kennedy Round” of 1968 and the “Tokyo Round” of 1979, which applied to 94 countries as of 1990 — raised trade volume 285%, or three-fold.

b. Participation in free trade agreements (meaning in practice the creation of the European Economic Community in the late 1950s, its expansion from the original six members to 12 between 1973 and 1985, plus the U.S.-Canada auto pact of 1965, the U.S.-Israel FTA of 1985, and the U.S.-Canada FTA of 1988) raised trade about 45% or half-fold. (If “half-fold” is a word).

c. Adoption of container shipping raised trade 790%, or nine-fold.

3. The Ever Alot: Since Mclean’s ingenious low-tech innovation, container shipping has followed a sort of Moore’s Law-like expansion curve, with capacity at least doubling every decade. By 2000, fleet capacity had reached 2400 ships carrying 4.3 million TEU, and by 2010, 4700 ships and 12.8 million TEU. The 6,406 container ships active as of mid-2022 carry 25.8 million TEU, meaning an average of over 4,000 containers per ship. A median-size container vessel is said to take about 15 hours to load and unload.

The largest container ship yet built — unpoetically but accurately named Ever Alot – is owned by Taiwan’s Evergreen lines, and went into service on June 22. It is 400 meters long, 61.5 meters wide, and 100 meters deep; requires a crew of 25; and can carry 24,004 TEU. At maximum weight, this would be about half a million tons of cargo, equivalent to 100 Warriors or 50 Ideal-X’s. Ever Alot arrives at Malaysia’s Tanjung Pelepas port tomorrow.

FURTHER READINGS:


UNCTAD’s 2021 Review of Maritime Transport has data and trends for container ships, oil tankers, port efficiency, and more about the 99,8000 large commercial vessels on the water this year.

A decade-old but still compelling visualization of the maritime world.

Bernhofen, el-Sahli, and Kindner on the trade impact of conversion to container shipping 1960-1990. No similar study appears to have been done so far on the impact of the larger scale of container shipping in the subsequent thirty years.

A dissenting view: Container modernization is accelerating too fast; very big ships are forcing unhealthy shipping-line consolidation and creating a capacity glut.

Then and now  

The Ever Alot,launched three weeks ago, carries 24,004 containers.

The Ideal-X and its first voyage.

Though the National Academy study of the Warrior appears unavailable online, Marc Levinson’s The Box (2005), written for the 50th anniversary of the Ideal-X’s journey, has a summary of the survey, as well as a large-scale review of the invention, spread, and implications of container shipping, 1956 to 2005:

A bit more perspective — Ideal-X was innovative, but not very large. The largest 19th century clipper ship, the 1853 Great Republic, was just a bit smaller, and could carry nearly as much cargo as the Warrior: 102 meters long, 16 wide, 25 deep and able to carry about 3,500 tons of cargo. From the Smithsonian’s American History Museum.

And two more book recommendations:   

Horatio Clare’s Down to the Sea in Ships (2015) recounts a trip on the Gerd Maersk, a 6,600-TEU ship built in 2006, from the U.K.’s Felixstowe port through the Suez Canal, to Malaysia, Vietnam, and China, and ending at Los Angeles. Detail on crew life (Filipino ratings, European and Indian officers; no alcohol at any time), cargo loading, rules for avoiding piracy, the approach to the Port of L.A. etc.

And Richard Hughes’ In Hazard (1938), the great  novel of the logistics industry, recounts the fictional passage of a small British general-cargo vessel (Chinese ratings, U.K. and American officers) from Virginia into a gigantic Caribbean hurricane.


ABOUT ED

Ed Gresser is Vice President and Director for Trade and Global Markets at PPI.

Ed returns to PPI after working for the think tank from 2001-2011. He most recently served as the Assistant U.S. Trade Representative for Trade Policy and Economics at the Office of the United States Trade Representative (USTR). In this position, he led USTR’s economic research unit from 2015-2021, and chaired the 21-agency Trade Policy Staff Committee.

Ed began his career on Capitol Hill before serving USTR as Policy Advisor to USTR Charlene Barshefsky from 1998 to 2001. He then led PPI’s Trade and Global Markets Project from 2001 to 2011. After PPI, he co-founded and directed the independent think tank Progressive Economy until rejoining USTR in 2015. In 2013, the Washington International Trade Association presented him with its Lighthouse Award, awarded annually to an individual or group for significant contributions to trade policy.

Ed is the author of Freedom from Want: American Liberalism and the Global Economy (2007).  He has published in a variety of journals and newspapers, and his research has been cited by leading academics and international organizations including the WTO, World Bank, and International Monetary Fund. He is a graduate of Stanford University and holds a Master’s Degree in International Affairs from Columbia Universities and a certificate from the Averell Harriman Institute for Advanced Study of the Soviet Union.

Read the full email and sign up for the Trade Fact of the Week

PPI’s Trade Fact of the Week: ‘Globalization’ is not so new

FACT: ‘Globalization’ is not so new 


THE NUMBERS: Merchandise trade as share of GDP –


2022       22.1%
1790       22.7%?


WHAT THEY MEAN:

After the Fourth, Yorktown, the Treaty of Paris, and the Constitution, they began to argue …

Nobody really knows how large America’s early-republic economy was. The website www.measuringworth.com, an economic history project at the University of Illinois, nonetheless makes an admirable try, estimating a U.S. GDP of $189 million in 1790. We do know trade figures, though: that year, Alexander Hamilton’s newly hired Customs agents counted $23 million in imports and $20 million in exports.

Assuming the GDP estimate is about right, goods trade would have been equal to a bit less than 23% of the economy. Today’s trade and GDP stats, counted in trillions rather than millions of dollars, are about 100,000 times bigger. But measured against one another, they make the 21st-century and 18th-century economies look eerily similar. With the Bureau of Economic Analysis estimating U.S. GDP at $25 trillion this year and Census trade data suggesting $3.5 trillion in goods imports and $2.1 trillion in exports, the 2022 goods-trade-to-GDP ratio is just above 22%, almost identical to that of 1790.

Similar circumstances can elicit similar ideas and responses. In this post-Fourth week, here are some post-Independence perspectives, each with its own contemporary echoes and advocates:

1. Alexander Hamilton’s Report on Manufactures (1791) the first U.S. government paper on trade policy, was also the first on the topic now termed “competitiveness.” Then serving as Treasury Secretary, Hamilton rebuts arguments that low-wage foreign competition (from textile, machinery, and other factories in Industrial Revolution Britain and Europe) made it impossible for the U.S. to compete in manufacturing:

“While in the article of wages the comparison certainly turns against the United States … the degree of disparity is diminished in proportion to the use which can be made of machinery. To illustrate this last idea: let it be supposed that the difference in price in two countries of a given quantity of manual labor requisite to the fabrication of a given article is as ten, and that some mechanic power is introduced into both countries which, performing half the necessary labor, leaves only half to be done by hand, it is evident that the difference in the cost of the fabrication of the article in question, as far as it is connected with the price of labor, will be reduced from ten to five.”

The balance of the Report calls for a program of importing labor-saving machines, passage of a patent law to stimulate American inventors, incentives for high-skilled immigration, cash prizes for innovative American factories, and an infant-industry trade protection scheme using temporarily high tariffs or exclusions for products ranging from starched wigs, bell-metal, and glue to whiskey, whale-oil, pewter cups and bowls, furniture, chocolate, rifles, and books. Hamilton’s former Federalist Papers partner, James Madison, was by then leader of an opposition party in the House of Representatives, and made sure the program got nowhere.

2. Thomas Jefferson’s Report on Foreign Commerce (1793), from a different angle two years later, is the first U.S. government catalogue of foreign trade barriers. Reviewing tariff rates, product exclusions, state trading monopolies, and shipping (“navigation”) restrictions in the U.K., France, Spain, Portugal, Denmark, Sweden, and the Netherlands along with their colonial possessions in Latin America, Canada, and the Caribbean, Jefferson as Secretary of State combines theoretical support for open markets with reciprocity in practice:

“Instead of embarrassing commerce under piles of regulating laws, duties, and prohibitions, could it be relieved from all its shackles in all parts of the world, could every country be employed in producing that which nature has best fitted it to produce, and each be free to exchange with others mutual surplusses for mutual wants, the greatest mass possible would then be produced of those things which contribute to human life and human happiness; the numbers of mankind would be increased, and their condition bettered. Would even a single nation begin with the United States this system of free commerce, it would be advisable to begin it with that nation; since it is one by one only that it can be extended to all. … But should any nation, contrary to our wishes, suppose it may better find its advantage by continuing its system of prohibitions, duties and regulations, it behooves us to protect our citizens, their commerce and navigation, by counter prohibitions, duties and regulations, also. Free commerce and navigation are not to be given in exchange for restrictions and vexations; nor are they likely to produce a relaxation of them.”
A sample of the findings:

“Our bread stuff is at most times under prohibitory duties in England, and considerably dutied on re-exportation from Spain to her colonies. Our tobaccoes are heavily dutied in England, Sweden and France, and prohibited in Spain and Portugal. Our rice is heavily dutied in England and Sweden, and prohibited in Portugal. Our fish and salted provisions are prohibited in England, and under prohibitory duties in France. Our whale oils are prohibited in England and Portugal. And our vessels are denied naturalization in England, and of late in France. … Spain and Portugal refuse, to all those parts of America which they govern, all direct intercourse with any people but themselves. … We can carry no article, not of our own production, to the British ports in Europe, nor even our own produce to her American possessions.”

3. Thomas Paine and economic integration as a support for peace: And from a non-government, dissenting-intellectual perspective, Paine argues in The Rights of Man (1790) for international economic integration as a deterrent to war:

“I have been an advocate for commerce, because I am a friend to its effects. It is a pacific system, operating to cordialise mankind, by rendering nations, as well as individuals, useful to each other. If commerce were permitted to act to the universal extent it is capable, it would extirpate the system of war, and produce a revolution in the uncivilised state of governments. … Commerce is no other than the traffic of two individuals, multiplied on a scale of numbers; and by the same rule that nature intended for the intercourse of two, she intended that of all. For this purpose she has distributed the materials of manufactures and commerce, in various and distant parts of a nation and of the world; and as they cannot be procured by war so cheaply or so commodiously as by commerce, she has rendered the latter the means of extirpating the former.”

FURTHER READINGS:


Quick postscript: Advocates looking to enlist the Founders on their sides of today’s global-economy debates should do so with care. As first-generation policymakers, they were learning on the job and changed their minds a lot. Hamilton’s take on the 1794 “Jay Treaty” with the U.K., the first post-Constitution U.S. trade agreement, diverged radically from the proposals he made in the Report on Manufactures.  Jefferson likewise took at least three irreconcilable positions over a 30-year career in politics, from a Paine-like unilateral free-trade view as Ambassador to France in the 1780s, to the reciprocity-minded policies of the Report on Foreign Commerce in the 1790s, and an ill-fated enthusiasm for trade sanctions as a foreign policy tool as President in the 1800s.


Policy then and now 

Hamilton’s Report on Manufactures, 1791.

… and Commerce Secretary Gina Raimondo on U.S. supply chains, 2022.

Jefferson’s 7-country Report on Foreign Commerce.  

… and the U.S. Trade Representative’s 2022 National Trade Estimate, covering 64 partners (counting the European Union and the Arab League as one each).

Paine’s The Rights of Man, 1790, with the commerce passage in chapter 5.

And some data  

Census’ 1970 collection of trade data from the Colonial era and the early republic.

“Measuring Worth” tries to track GDP, wages, per capita income, and other stats for the U.S., Australia, the United Kingdom, and Spain back to the 1790s. Australia in 1790, two years after the Botany Bay colony foundation, has a GDP of 23,000 pounds.

And how exactly did we get modern economic macro-stats? BEA looks back on pre-GDP government economics, the giant brain of Simon Kuznets, and the invention of national economic measurement in the Commerce Department of the 1930s.


ABOUT ED

Ed Gresser is Vice President and Director for Trade and Global Markets at PPI.

Ed returns to PPI after working for the think tank from 2001-2011. He most recently served as the Assistant U.S. Trade Representative for Trade Policy and Economics at the Office of the United States Trade Representative (USTR). In this position, he led USTR’s economic research unit from 2015-2021, and chaired the 21-agency Trade Policy Staff Committee.

Ed began his career on Capitol Hill before serving USTR as Policy Advisor to USTR Charlene Barshefsky from 1998 to 2001. He then led PPI’s Trade and Global Markets Project from 2001 to 2011. After PPI, he co-founded and directed the independent think tank Progressive Economy until rejoining USTR in 2015. In 2013, the Washington International Trade Association presented him with its Lighthouse Award, awarded annually to an individual or group for significant contributions to trade policy.

Ed is the author of Freedom from Want: American Liberalism and the Global Economy (2007).  He has published in a variety of journals and newspapers, and his research has been cited by leading academics and international organizations including the WTO, World Bank, and International Monetary Fund. He is a graduate of Stanford University and holds a Master’s Degree in International Affairs from Columbia Universities and a certificate from the Averell Harriman Institute for Advanced Study of the Soviet Union.

Read the full email and sign up for the Trade Fact of the Week
PPI’s Trade Fact of the Week: The U.S. collects about as much tariff money on Pakistani goods as on British goods

FACT: The U.S. collects about as much tariff money on Pakistani goods as on British goods. 


THE NUMBERS:

Imports from U.K., 2021  $56.6 billion
Imports from Pakistan, 2021    $5.3 billion
Tariffs on U.K. goods, 2021  $566 million
Tariffs on Pakistani goods, 2021  $523 million


WHAT THEY MEAN:

Looking at the U.S. tariff system as domestic tax policy for an International Trade Commission hearing last week, PPI’s Ed Gresser found much to dislike. In this role, it turns out to be mainly a way to tax cheap clothes, shoes, and other consumer goods, many of them not made in the United States for decades. As such, it is a remarkably regressive way to raise money, and not obviously effective as a job or production protector.

How does it look from the other side of the border? The complicated answer is, it basically depends where you are on the other side. For most countries U.S. tariffs turn out to be pretty modest, in a range from close to zero to about 5%. For low-income Asian countries reliant on clothing and textile exports, it is very restrictive; for China and to some extent for the world, it has changed a lot since 2017. As a starting point, a quick list (using trade-weighted averages, i.e., tariff payments divided by the value of goods imports) illustrates the world averages of 2017 and 2021, and the variation among countries:

Bangladesh 14.7%
China, 2021 11.3%
Sri Lanka 10.9%
Pakistan   9.8%
Cambodia   8.3%
Vietnam   4.8%
Indonesia   4.5%
World, 2021       3.0%
Ukraine   2.8%
China, 2017        2.7%
Thailand   1.9%
Egypt   1.7%
Samoa   1.5%
Japan   1.5%
World, 2017       1.4%
Brazil   1.0%
Philippines   1.5%
Germany   1.4%
European Union, 2021   1.4%
European Union, 2017    1.3%
El Salvador   1.2%
United Kingdom   1.0%
Argentina   0.9%
New Zealand   0.7%
Lebanon   0.6%
Uzbekistan   0.6%
Norway   0.5%
Haiti   0.4%
Jordan   0.3%
Kenya   0.3%
Ghana   0.2%
Kuwait   0.2%
Fiji   0.2%
South Korea   0.2%
Jamaica   0.1%
Canada   0.1%
Colombia   0.1%
Liberia 0.01%


What explains these patterns?

High tariffs on low-income Asia: The low-income Asian countries at the top of the list — Bangladesh, Cambodia, Pakistan, and Sri Lanka — specialize in exports of clothing and home textiles. Tariffs on these goods average over 11%, and spike to 32% (as one example, for polyester shirts). By comparison, IT goods, medical equipment, natural resources like oil and fish, and primary agricultural commodities are zero, while heavy-industry and sophisticated consumer goods generally get low tariffs.  Thus the startling fact that buyers of Pakistan’s modest $5.3 billion worth of shirts, towels, and similar goods pay almost as much as buyers of $56.6 billion in British medicines, aircraft parts, automobiles, and art auction prizes. Likewise, buyers of struggling Sri Lanka’s underwear and clothing paid $325 million last year; the bill for buyers of Norway’s $6.7 billion in salmon, oil, and pharmaceuticals was $34 million, an order of magnitude smaller.

Low-to-medium rate on others: If the highest rates show up in low-income Asia, the lowest are for countries of several different types: (a) energy and natural resource exporters (oil for Kuwait, fish for Fiji, and so on); (b) the 20 U.S. FTA partners, where Canada, Jordan, El Salvador and Colombia stand in for the larger group; and (c) countries enrolled in the African Growth and Opportunity Act or the Caribbean Basin Initiative, such as Kenya, South Africa, Liberia, Haiti, and Jamaica.  Larger wealthy and middle-income countries (the U.K., Germany, Brazil, Argentina, Thailand, Japan, etc) have diversified export mixes, typically with a lot of zero-tariff products, a lot of mid-tariff products, and some high-tariff goods, and typically wind up in a range from 1% to 3%.

Changing rates for the world and China: Finally, the system has changed substantially over the last five years, with the worldwide average rate doubling from 1.4% in 2017 to 3.0% in 2021.  This is principally due to the Trump administration’s “301” tariffs on Chinese goods. The “232” tariffs on steel and aluminum, though equally controversial, affect only about 1.5% of imports, and changed overall averages only very modestly for the world or large partners like the EU or Japan. For Chinese goods specifically, average rates have jumped from 2.7% in 2017 to 11.3% in 2021 – very high in comparison to the vast majority of countries, but still actually below the normal, permanent rates for products from Bangladesh.

FURTHER READINGS:

Gresser on the tariff system and American underserved and underrepresented communities.

A long view: The U.S. International Trade Commission tracks U.S. tariff rates from the McKinley Tariff of 1890 to 2020.

… and analyzes the 11,414 U.S. tariff lines — How many are zero? How many duty-free under FTAs and preferences? How many are “specific duties,” or flat fees, instead of percentages? — etc.

The U.S. tariff system.

International comparisons

The World Bank’s interactive table of average tariff rates worldwide and by country uses “simple averages” (the rates for each single tariff line in a country’s “schedule” added up, then divided by the total number of tariff lines) rather than the “trade-weighted” averages above. This approach has grown less useful as a gauge generally (as more countries use FTAs and other special programs), and especially for the U.S. since the 301 and 232 tariffs.

This noted, the table reports a worldwide average of 5.2% as of 2017, down by about 2/3 from the 15.6% average of 1993, and by about half from the 10.8 percent world average of 2000. The world’s highest rate is the Bahamas’ 23.7%, with a few other small islands and countries (the Cayman Islands, Bermuda, and Djibouti) next. The lowest are the zeroes for Hong Kong and Macao, with very slightly higher 0.1% averages in Brunei and Singapore.

The WTO’s World Tariff Profiles 2021 has a much more detailed look, with simple averages, trade-weighted averages, “tariff peak” counts, ag vs. non-ag., and more for 151 countries.


ABOUT ED

Ed Gresser is Vice President and Director for Trade and Global Markets at PPI.

Ed returns to PPI after working for the think tank from 2001-2011. He most recently served as the Assistant U.S. Trade Representative for Trade Policy and Economics at the Office of the United States Trade Representative (USTR). In this position, he led USTR’s economic research unit from 2015-2021, and chaired the 21-agency Trade Policy Staff Committee.

Ed began his career on Capitol Hill before serving USTR as Policy Advisor to USTR Charlene Barshefsky from 1998 to 2001. He then led PPI’s Trade and Global Markets Project from 2001 to 2011. After PPI, he co-founded and directed the independent think tank ProgressiveEconomy until rejoining USTR in 2015. In 2013, the Washington International Trade Association presented him with its Lighthouse Award, awarded annually to an individual or group for significant contributions to trade policy.

Ed is the author of Freedom from Want: American Liberalism and the Global Economy (2007).  He has published in a variety of journals and newspapers, and his research has been cited by leading academics and international organizations including the WTO, World Bank, and International Monetary Fund. He is a graduate of Stanford University and holds a Master’s Degree in International Affairs from Columbia Universities and a certificate from the Averell Harriman Institute for Advanced Study of the Soviet Union.

Read the full email and sign up for the Trade Fact of the Week
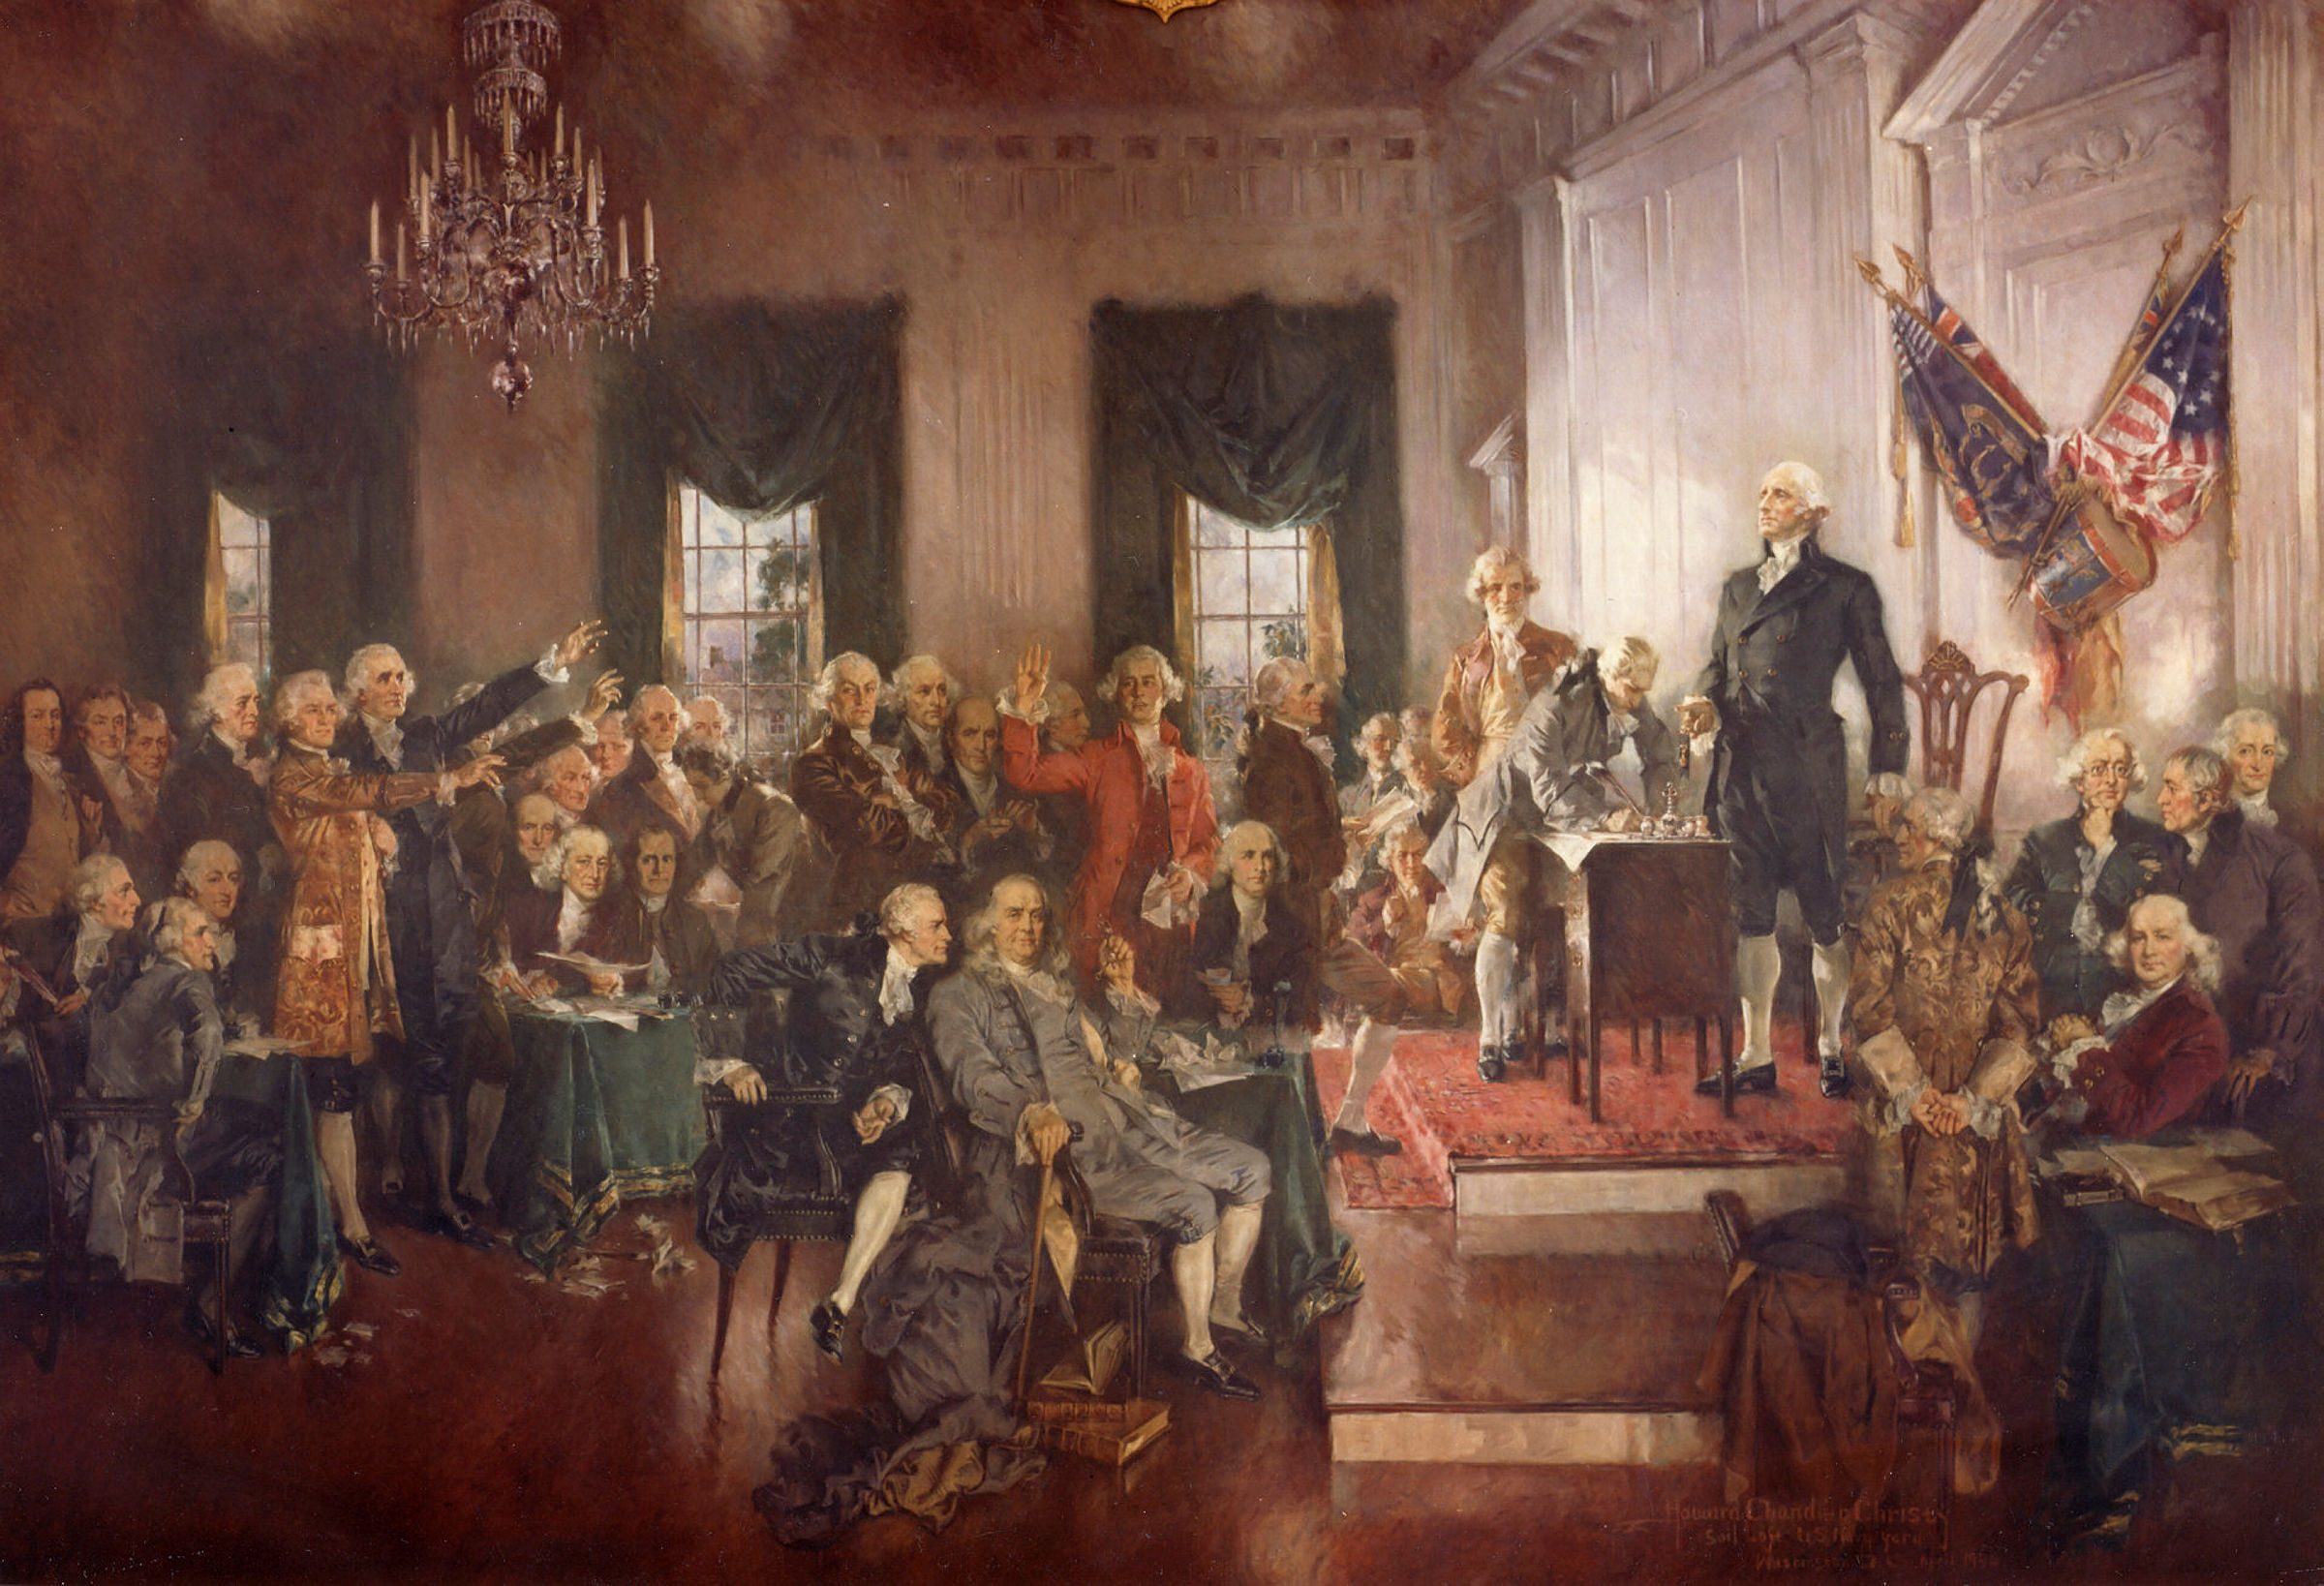
Keep Eyes on the Prize: Skip the Small and Controversial and Pass USICA/Competes Act

The chapters on trade included in the Senate and House COMPETES Act/USICA raise some good ideas, but also some very questionable ones. A good principle here is: “simpler is better.” If the good can be salvaged, fair enough. But overall, the trade chapters’ contentious elements are not important enough to justify slowing the CHIPS Act, support for R&D and STEM workforce development, supply chain resilience, and the bill’s other major benefits.

On the positive side, the Senate’s renewal of an “exclusion” program for the Trump administration’s China tariffs is appropriate, helping to ease the burden these tariffs place on U.S. manufacturers and farmers. Likewise, it’s good that Congress is committed to renew the Generalized System of Preferences, though as PPI noted before, both the Senate and House bills overreach in adding many new eligibility criteria; these should be pared back to a more focused list and balanced with additional benefits as Reps. Stephanie Murphy and Jackie Walorski have proposed. Other ideas are best dropped.

For example, giving businesses wider openings to file trade lawsuits of the type that have recently derailed U.S. investment in solar energy, and banning families from getting “de minimis” tariff waivers for packages originating in China, are questionable on the merits, and also likely to put some additional upward pressure on prices when we need to do the opposite. They should be dropped in the interest of speeding the conclusion of the larger bill.

More fundamentally, the bills’ trade chapters seem to be missing the forest for the trees, or even the shrubs. Is it, for example, acceptable that the Biden administration is not seeking market access for American exporters, or more generally, designing a program ambitious enough to match China’s RCEP and Belt and Road (in its European, Asian, and Latin American trade “initiatives”?).

With the “301” tariffs having failed to change the direction of the U.S.-China relationship, is there a justification for continuing to ask American businesses and families to keep paying them? Did Congress surrender its rights by allowing presidents to personally impose tariffs through the “Section 301” and “Section 232” laws, and if so, should they be changed? And, as the administration investigates the effects of trade and trade policy on America’s low-income workers and communities, is there a role for pro-poor reform of the U.S.’ own trade regime?

These are the trade policy questions we hope Congress will begin asking, once it completes its competitiveness bill work.