FACT: U.S. Constitution: “Congress shall have power to lay and collect Taxes, Duties, Imposts, and Excises.”
THE NUMBERS: Consumer confidence “Expectations Index”* –
| March 2025: |
65.2 |
| February 2025: |
72.9 |
| (Recession level) |
(80.0) |
| December 2024: |
81.1 |
| October 2024: |
89.1 |
* Conference Board, March 25, 2025
WHAT THEY MEAN:
Is Mr. Trump’s tariff binge — now delayed until 4:00 today, presumably to avoid split-screen footage placing tariff announcements against crashing financial markets, but said to include extensive new taxation of cars, semiconductors, OTC and prescription medicines, Canadian energy, Chinese toys, Mexican fruits and vegetables, etc. — really “the largest peacetime tax increase in history.” The White House’s claim of a $600 billion increase in annual tariff collection would be about 2.2% of GDP. That would make it at least a contender for the title, though it might wind up below the introduction of the Social Security and Medicare taxes in the 1930s and 1960s.
But if the scale remains a little blurry, the public’s view seems by comparison sharp and clear: higher prices and fear for the future. The Conference Board’s survey of American “consumer confidence” (March 25, done after tariffs on Canada/Mexico/China but before last week’s on cars) suggests opinion has gone far enough south to reach the “Tierra del Fuego” latitudes, where phrases like “nose-dive” and “free fall” turn up. Here’s their ashen-faced release a week ago Tuesday:
“The Expectations Index – based on consumers’ short-term outlook for income, business, and labor conditions – dropped 9.6 points to 65.2, the lowest level in 12 years [ed. note: lowest since the end of the post-2008 financial crisis] and well below the threshold of 80 that usually signals a recession ahead. … Optimism about future income – which had held up quite strongly over the past few months – largely vanished, suggesting worries about the economy and the labor market have started to spread into consumers’ assessment of their personal situations. … [R]esponses also showed that inflation is still a major concern for consumers and that worries about the impact of trade policies and tariffs in particular are on the rise.”
Should the public be that worried? Recent experience offers little guidance, since no administration since Herbert Hoover’s in 1930 has tried something like this. Warning lights are flashing red in GDP outlook, financial markets and manufacturing (“bearish market sentiment and tariff applications and costs have dominated discussions”) as well as in consumer confidence. And some real-world leading indicators — say, layoffs in steel factories specialized in automotive metal — are turning down. But apart from the layoffs, these are still mostly “signs and portents.” Spring will bring more reliable stats on macro employment/price/growth impacts; effects on goods-buying industries such as factories, farms, restaurants, retail, and building contractors; and the fortunes of the American export manufacturing and farming, services and digital, and IP sectors now suddenly targets for retaliation.
But whatever the economic gashes and wounds, the most important long-term harm will likely be elsewhere. After all, governments often make policy errors, sometimes they’re pretty big, and countries usually recover in time. (Though recuperation from Hoover’s required a lot of time). Damage to governance goes deeper. And here, Mr. Trump’s approach — bad-faith “emergency” and “national security” declarations, coupled with Executive Orders attempting to create tariffs by decree — carries the risk of infection to the political system separate from its economic consequences.
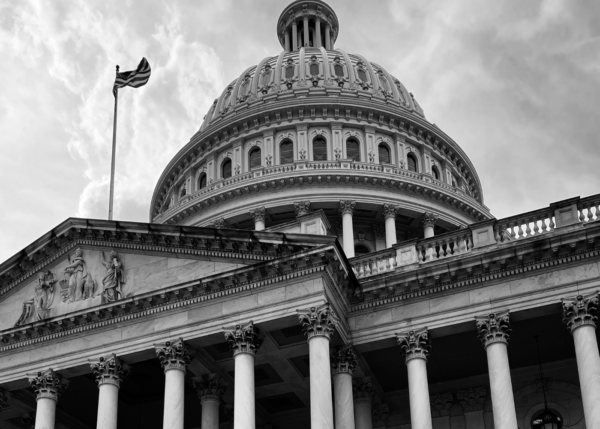
The Constitution gives Congress, not presidents, authority to “lay and collect Taxes, Duties, Imposts, and Excises,” as well as “regulation of Commerce with foreign nations.” For good reason: giving any single individual power to set tax rates means not only heightened danger of impulsive and unsound decisions, but temptation to use that novel power in corrupt ways — to reward family members, cronies, and supporters, and/or to harm political critics, business rivals, and opposition strongholds.
Earlier presidents never questioned this principle. The sepia-tinged pre-New Deal pols who wanted tariff hikes (e.g., Hoover, Warren G. Harding, William McKinley, Benjamin Harrison) asked Congress to pass bills and sign the result. Historians debate the economic merits, but their tariff increases had a Constitutional legitimacy Mr. Trump’s program wholly lacks. Should his program stick, it will weaken the separation of powers, usurp authority over taxation, and substitute one-man “rule by decree” for authentic (if sometimes ill-judged) law. Next to this, costs to growth, jobs, and living standards are more immediately painful but likely lesser issues.
Where to next? Court cases this year may limit Mr. Trump’s options, but there’s a simpler and better solution: Congress has the power it needs to defend its authority, and should use it. House Speaker Mike Johnson and Ways and Means Committee Chairman Jason Smith, and their Senate counterparts Majority Leader John Thune as Majority Leader and Finance Committee Chair Mike Crapo, need only — per their oath of office to “protect and defend the Constitution” — call a vote. If Congress likes Mr. Trump’s tariffs, it can impose them in the proper way. If not, it should say “no” and end them.
FURTHER READING
PPI’s four principles for response to tariffs and economic isolationism:
-
Defend the Constitution and oppose rule by decree;
-
Connect tariff policy to growth, work, prices and family budgets, and living standards;
-
Stand by America’s neighbors and allies;
-
Offer a positive alternative.
The Constitution and its friends:
Official U.S. Constitution text, from the National Archives. See Article I, Section 8, first clause, for “Taxes, Duties, Imposts, and Excises.”
PPI’s look last fall at the Constitutional Convention of 1787, the tax power, and the harm inherent in rule by decree.
On the other side:
Two hours before today’s White House tariff decrees are supposed to be released, neither their texts nor their content are yet public. For interim reading in their absence, try the President’s Trade Agenda report, put out by the Office of the U.S. Trade Representative on March 3. Each year this is supposed to lay out the year’s main goals and activities. This year’s edition has a lot of puzzling gaps. The report does converge at some points with the options floated in the press this past week. But it doesn’t mention taxation of cars and medicine, trade wars with Canada and Mexico, or any large overall tariff.
Leading indicators:
Conference Board finds Americans fearful, expecting a recession, and thinking a lot about tariffs.
… the University of Michigan’s consumer-confidence survey finds the same thing. Sample:
“The expectations index plunged a precipitous 18% and has now lost more than 30% since November 2024. This month’s decline reflects a clear consensus across all demographic and political affiliations; Republicans joined independents and Democrats in expressing worsening expectations since February for their personal finances, business conditions, unemployment, and inflation. Consumers continue to worry about the potential for pain amid ongoing economic policy developments. Notably, two-thirds of consumers expect unemployment to rise in the year ahead, the highest reading since 2009.”
And about that “$6 trillion”:
Concise judgment from Ben Ritz and Alex Kilander this February: Trump administration tariffs are “bad tax policy that don’t raise much revenue but do raise costs for businesses and households.”
And Laura Duffy’s It’s Not 1789 Anymore: Why Trump’s Backwards Tariff Agenda Would Harm America (October 2024) on the First Congress and the deep flaws of tariffs as a form of taxation: can’t raise enough revenue to support a modern government; non-transparent to the public and thus unusually easy for well-connected interest groups to manipulate; inequitable as business taxation and regressive as consumer taxation; large harms to “downstream” industries and their workers.
ABOUT ED
Ed Gresser is Vice President and Director for Trade and Global Markets at PPI.
Ed returns to PPI after working for the think tank from 2001-2011. He most recently served as the Assistant U.S. Trade Representative for Trade Policy and Economics at the Office of the United States Trade Representative (USTR). In this position, he led USTR’s economic research unit from 2015-2021, and chaired the 21-agency Trade Policy Staff Committee.
Ed began his career on Capitol Hill before serving USTR as Policy Advisor to USTR Charlene Barshefsky from 1998 to 2001. He then led PPI’s Trade and Global Markets Project from 2001 to 2011. After PPI, he co-founded and directed the independent think tank ProgressiveEconomy until rejoining USTR in 2015. In 2013, the Washington International Trade Association presented him with its Lighthouse Award, awarded annually to an individual or group for significant contributions to trade policy.
Ed is the author of Freedom from Want: American Liberalism and the Global Economy (2007). He has published in a variety of journals and newspapers, and his research has been cited by leading academics and international organizations including the WTO, World Bank, and International Monetary Fund. He is a graduate of Stanford University and holds a Master’s Degree in International Affairs from Columbia Universities and a certificate from the Averell Harriman Institute for Advanced Study of the Soviet Union.


 Watch on YouTube.