In part 2 of this two part series, PPI’s Reinventing America’s Schools (RAS) Project Co-Director Curtis Valentine, in collaboration with EdChoice, sits down for a live panel conversation and podcast recording at the ASU+GSV Summit in San Diego with Sharif El-Mekki, Chief Executive Officer of the Center for Black Educator Development and Mikyeil El-Mekki, and Matthew Mugo Fields, Executive Leadership of Houghton Mifflin Harcourt.
Learn more about the Reinventing America’s Schools Project here.
Learn more about the Progressive Policy Institute here.
Earlier this week, former Chicago Teachers Union (CTU) negotiator Brandon Johnson became Chicago’s 48th mayor. “Progressives” are celebrating, but when it comes to prioritizing high quality public schools, the new mayor couldn’t be more regressive.
This should be a national wakeup call for moderates. During the pandemic, many Democrats ignored parents’ demands. That abetted the party’s surrender of the historic trust we long enjoyed on education policy. Now, the elevation of a CTU leader to the most important office in the biggest city in the Midwest — where the Democratic National Committee (DNC) will hold its convention next summer — makes reclaiming our mantle as the “education party” harder.
THE NUMBERS: Export share of state “GDP,” 2022, goods only –
Louisiana
43.4%
Texas
20.6%
Oregon
11.4%
Alabama
9.2%
Indiana
9.9%
Washington
8.4%
Wisconsin
6.8%
Pennsylvania
5.4%
Massachusetts
4.8%
New Mexico
3.9%
D.C.
1.0%
Hawaii
0.7%
* Goods only (manufactures, agriculture, energy, mining, returns, waste & scrap, low-value shipments); no data exists for state services exports.
WHAT THEY MEAN:
A note from Virginia electric co-op newsletter “Cooperative Living” last week tallies farms and trade: 41,500 Virginia farms export $4 billion a year to 152 countries, topped by China at $1.36 billion, then Canada, Taiwan, Mexico, and Japan at $362 million, $161 million, $140 million, and $129 million.
Their piece draws on work at the Census, Department of Agriculture, and the Bureau of Economic Analysis, whose stat experts over the past decade become steadily more ambitious and precise in tracking exports down to states, cities, and “metro areas.” Their data — try in particular the Commerce Department’s “TradeStats Express” — show that (a) Virginia overall is very close to the “typical” state, placing exactly 24th in 2022 with $25 billion in total exports; (b) is one of 34 states for whom Canada is the top overseas (if that’s the right term) customer, and one of 13 whose top ag market is China; and (c) together with the agriculture exports comes in at $5.8 billion in energy, $2.2 billion in computers and electronics, and $1.4 billion worth of paper (fifth-ranked in the country); $631 million in waste and scrap metal for recycling, $188 million in pesticides and “other agri-chemicals,” and so on.
To produce such figures is challenging. Manufactured goods, for example, are usually composite assemblies of parts made in lots of places rather than monoliths built from scratch at a single site. (If a car has an engine made in Ohio, a windshield made of Kentucky glass, a chassis from Indiana metals, computers using semiconductor chips in Arizona, all coming together at a Michigan factory, the logical and preferred — but still not totally satisfying — answer is that it’s “from” Michigan.) Agricultural exports are even more hotly disputed: One Department calculates totals based on the location of the port or railhead where river barges and containers full of (say) soybeans come together to load for shipment abroad, and counts processed foods as manufactured goods, while another uses average production value by state and counts processed foods as agricultural products. And nobody has figured out a way to calculate state services exports. But these points noted, the government’s upgraded state data make one thing very clear, make a lot of things pretty clear, and provide many interesting points to say about state specialties, regional economies, and their links abroad:
Very clear: As of 2022, Gov. John Bel Edwards’ Louisiana is the king of state exporters. Louisiana’s $122 billion in exports last year — more than double the $56 billion in 2017 — gives the state a 43% export-share-of-GDP ratio when matched against its $281 billion GDP. This is twice the 20.6% ratio of second-place Texas. The boom mainly reflects the roaring growth of U.S. energy exports centered around Louisiana’s three specially designed liquefied natural gas export terminals. (Since 2021, the U.S. has been the world’s top energy exporter, with gas and oil, and the smaller coal/electricity/biofuels sectors, accounting for 18.4% of U.S. exports last year, an all-time record far above the 13.2% peak achieved in the 1920s.)
A look at the top five state export-to-GDP ratios illustrates:
Pretty clear: The remaining 46 states and D.C. fall in a range from sixth-place Oregon’s 11.4% through the 5% to 7% common in the Northeast, to the lowest export-to-GDP ratios (D.C.’s 1.0% and Hawaii’s 0.7%). Finding patterns is tricky given that some of the data remain blurry, especially for small, agriculture-reliant inland states. But overall, Southern and Midwestern states appear on average somewhat more export-reliant than East Coast and West Coast states. Measured in total dollars, Texas (benefiting, like Louisiana, from a gas and oil surge) is easily the top exporter at $486 billion, with California a distant second at $186 billion. (Though, given the absence of services data, this doesn’t include anything Californians may possibly be earning from overseas sales of software, movies showings, music downloads, etc.). Louisiana’s $122 billion is third, followed by New York’s $106 billion and Illinois’ $78 billion. The next five are Florida, Washington, Michigan, Ohio, and Pennsylvania.
Lots of Information: TradeStats Express lets you arrange the data in an unusual variety of ways: by overseas markets, by single products, in-depth panoramas for particular states, comparisons among neighboring states, etc. For example, Texas is by far the top state exporter to sub-Saharan Africa at $5.1 billion of a nationwide $18 billion; Pennsylvania, meanwhile, is the U.S.’ top exporter of sugars and confectionery, while Florida leads in ships and boats, and California in mushrooms. As to farmed fish, Maine exports over two-thirds of the U.S. total. Or, as noted earlier, Canada is the top market for 34 states, while among the rest, Mexico is the top market for six states (Arizona, California, Kansas, Nebraska, New Mexico, Texas); China for four (Alaska, Washington, Oregon, and Massachusetts); Germany for two (Alabama and Connecticut); the U.K. for one state (Utah) and the District of Columbia; and one each for Brazil, (Florida), Singapore (Hawaii), Switzerland (New York**) and the Netherlands (Puerto Rico). Or, a few single-state studies:
1. Arizona: On the bottom-left corner of the map, Arizona’s $27 billion in exports rank 20th in total dollars, in a three-way tie with Virginia and Minnesota. Mexico is Arizona’s main customer, buying $8.7 billion or about a third of the $27 billion total. Canada is second, followed by China and the Netherlands. Top products are aerospace ($4.6 billion), semiconductors and electronics ($4.4 billion), and old-standard metal ores ($2.2 billion).
2. Illinois: The U.S.’ fifth-largest exporter at $78 billion in 2022, Illinois relies especially heavily on Canadian and Mexican customers ($23.8 billion and $11.7 billion respectively). Australia is the third-largest at $4.6 billion, buying mainly farm equipment and medicines, followed by Germany and China. Illinois beats California and Texas as top exporter to Australia, and ranks 4th for New Zealand.
3. Kentucky: Gov. Andy Beshear’s justifiably enthusiastic press release notes heavy international investment in Kentucky business: “Kentucky’s international presence includes more than 500 facilities that employ almost 115,000 people and represent 33 different countries.” His trade experts, obviously adept followers of the Census and BEA stats, report exports of $34.4 billion led by “aerospace products and parts, pharmaceuticals and medicines, motor vehicles”, etc., with Canada, Mexico, the U.K., China, and France as the Kentucky’s top five buyers.
4. Oregon: The most “export-intensive” state in the West in 2022, with exports accounting for 11.4% of Oregonian GDP. China is easily the top market, buying $8.3 billion of Oregon’s $34 billion in total exports, mostly semiconductors and related high-tech electronics. Next come Mexico, Canada, Malaysia, and Ireland.
5. Puerto Rico: The Commonwealth’s $20.7 billion in exports are very concentrated in pharmaceuticals, which make up $16.3 billion or nearly 80% of the total. Most go to Europe: $3.5 billion to Spain, $3.4 billion to the Netherlands, and $1.3 billion to Italy, with Japan and China next, followed by Belgium, Germany, and Austria. The only Caribbean neighbor in Puerto Rico’s top 20 markets is the Dominican Republic, in 11th place at $465 million.
6. Vermont: And in the map’s top right corner, with $2.5 billion in 2022 exports, Vermont ties New Hampshire as the most export-reliant Northeastern state. (6.2% of Vermont’s $40.6 billion GDP.) Semiconductors and other electronics account for about half of the total, with Canada the top market at $777 million, Taiwan second at $465 million, and China third at $211 million. Note the $54 million in sugars and confectioneries — presumably the iconic “sweetest thing,” maple syrup and maple sugar — all destined for Canada.
* Using 2021 exports and ‘GDP’ for Puerto Rico, as the 2022 figures aren’t yet available.
** A 2022 anomaly, probably reflecting a one-year surge in gold exports; typically Canada is New York’s top market.
FURTHER READING:
From the states:
Cooperative Living (pg. 35) has a snapshot of Virginia farm exports.
???? King of exports: Louisiana Gov. John Bel Edwards pitches natural gas exports and investment opportunities in Asia last March.
And for international context and comparisons, the WTO’s World Trade Statistical Review 2022 (2021 data; next annual edition likely in November).
ABOUT ED
Ed Gresser is Vice President and Director for Trade and Global Markets at PPI.
Ed returns to PPI after working for the think tank from 2001-2011. He most recently served as the Assistant U.S. Trade Representative for Trade Policy and Economics at the Office of the United States Trade Representative (USTR). In this position, he led USTR’s economic research unit from 2015-2021, and chaired the 21-agency Trade Policy Staff Committee.
Ed began his career on Capitol Hill before serving USTR as Policy Advisor to USTR Charlene Barshefsky from 1998 to 2001. He then led PPI’s Trade and Global Markets Project from 2001 to 2011. After PPI, he co-founded and directed the independent think tank Progressive Economy until rejoining USTR in 2015. In 2013, the Washington International Trade Association presented him with its Lighthouse Award, awarded annually to an individual or group for significant contributions to trade policy.
Ed is the author of Freedom from Want: American Liberalism and the Global Economy (2007). He has published in a variety of journals and newspapers, and his research has been cited by leading academics and international organizations including the WTO, World Bank, and International Monetary Fund. He is a graduate of Stanford University and holds a Master’s Degree in International Affairs from Columbia Universities and a certificate from the Averell Harriman Institute for Advanced Study of the Soviet Union.
Taylor Maag, Director of the New Skills for a New Economy Project at the Progressive Policy Institute (PPI), released the following response in reaction to President Biden’s announcement of new efforts to ensure all Americans can access the jobs created by the President’s Investing in America agenda, including the American Rescue Plan, the Bipartisan Infrastructure Law, the CHIPS and Science Act and the Inflation Reduction Act:
“The Biden Administration has created a record number of jobs through these policies, yet our country continues to struggle to find the workforce to fill them. The White House’s announcement today showcases how the Administration plans to solve this challenge while also ensuring these job opportunities are available to all working Americans, not just those with a four-year degree.
“The Progressive Policy Institute’s New Skills for a New Economy Project applauds the Biden Administration’s announcement for acknowledging that to build a competitive workforce we need to ensure every American — whether they go to college or not — has equitable access to high-quality training, education, and services that provide a path to a good career.
“Initiatives announced today, such as Workforce Hubs and the Advanced Manufacturing Workforce Sprint, do just that. These programs are regionally driven — relying on partners in the community to drive programming and industry-led, ensuring employers are a key partner in informing and developing workforce strategies. This type of action is critical to equip American workers with the skills they need to get ahead in a new economy, to close the diploma divide, and to ensure our nation remains competitive.”
The New Skills for a New Economy Project at the Progressive Policy Institute helps shape policy discussions at the federal and state levels around investments in a robust workforce development system that is fully-funded, modern, industry-responsive, and equips current and future workers with the skills they need to get ahead. The project promotes policy solutions that address the current challenges facing workers’ success and helps the U.S. remain competitive by lifting up new ideas and best practices happening across the country.
The Progressive Policy Institute (PPI) is a catalyst for policy innovation and political reform based in Washington, D.C. Its mission is to create radically pragmatic ideas for moving America beyond ideological and partisan deadlock. Learn more about PPI by visiting progressivepolicy.org.
Those of us who desperately want to see the back of this dismal Conservative government should take heart from the recent local elections in England.We should also be encouraged by the successes of the centre left around the world, which has defeated the political right in elections in Australia, Germany, Spain, Portugal and the US, after a dramatic decline in support for social democratic parties after the 2008 financial crisis.
But if we can learn one thing from these recent successes, it is that there is nothing inevitable about the return of social democracy. Granted, after the pandemic, many voters have grown weary of the failure of the political right to address their need for security and prosperity as they face the cost of living crisis. But voters everywhere remain sceptical of the ability of politics and politicians, from all parties, to act in their interests. They are sceptical too of the capacity for government to change their lives for the better, at a time when we badly need to renew the modern state in the face of the perma-crises hitting all our nations.
The metaphor that the pendulum inevitably swings back from right to left and back again ignores the simple fact that of the 123 years of the Labour party’s existence, it has only been in power for just over 30 of them. If there is a pendulum, it gets stubbornly stuck on one side. The UK Labour party needs to take learning, not comfort, from the tentative revival of the centre left.
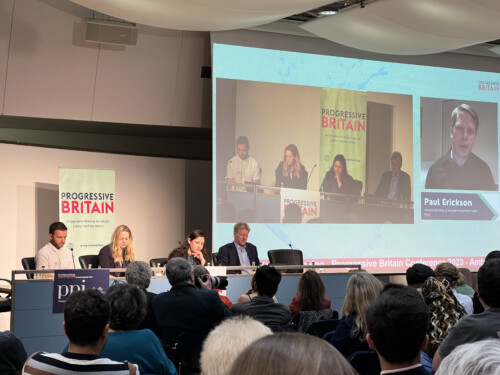
The Progressive Policy Institute (PPI) partnered with Progressive Britain to host their 2023 conference, Ambition for Britain, featuring Labour Party Leader Keir Starmer MP and leading center-left politicians and thinkers. As part of an ongoing dialogue between the U.S. and U.K., Will Marshall, President of the Progressive Policy Institute (PPI), and Claire Ainsley, Director of PPI’sProject on Center-Left Renewal, led a panel discussion providing a global perspective on the need for a strong center-left alternative to right-wing populism and nationalism.
“Now more than ever, the United States, United Kingdom, and other countries need strong center-left parties to turn back the tide of rising reactionary nativism and nationalism,” said Will Marshall, President of PPI. “The UK Labour party is working to expand their voting base to build bigger governing majorities. Ahead of the next U.S. election in 2024, the Democratic party must take a similar approach to win back working-class voters.”
“Across the world, center-left parties are seeing a revival in voter support as the political right fails to answer the everyday challenges of today and tomorrow,” said Claire Ainsley, Director of the Project on Center-Left Renewal and former Executive Director of Policy to Labour leader Keir Starmer. “The UK Labour Party can take inspiration and learn from their success, as well as heed the warnings that right-wing populism has not gone away. Center-left parties across the world can work together and learn from each other to continue winning and creating lasting coalitions.”
Labour Party Leader Keir Starmer highlighted recent local elections where the Labour party had its strongest result in more than a decade, winning in all parts of the country and winning back many Brexit voters.
The Project on Center-Left Renewal is focused on working with center-left parties in Europe and around the world to exchange ideas and compare notes to build winning coalitions that last. Last month, members of the project traveled to Australia to meet with members of the Australian Labor party, who won the recent 2022 federal elections. Their recent victory in the New South Wales state elections means they are in government in every state except Tasmania.
The Progressive Policy Institute (PPI) is a catalyst for policy innovation and political reform based in Washington, D.C. Its mission is to create radically pragmatic ideas for moving America beyond ideological and partisan deadlock. Learn more about PPI by visiting progressivepolicy.org.
Kudos for recognizing that the Federal Energy Regulatory Commission is the agency best equipped to consider and approve proposals to build long-distance interstate electric transmission needed to deliver affordable but remote renewable energy to where it is needed. Otherwise, America will not be able to decarbonize our grid or our economy.
Republicans seem to be racing backward in time, resurrecting old tenets that defined their party’s outlook in the 1920s and 1930s: Christian fundamentalism, nativism, protectionism and isolationism.
Long discredited by events, these reactionary shibboleths are risen from the dead and lurching like zombies across the U.S. political landscape. We hear their echo in today’s red state crusade to stamp out women’s reproductive rights, the hysteria over immigrant hordes “replacing” whites and the Trump administration’s high tariff policies, which remain on the books despite having failed to reduce U.S. trade deficits.
The former president also dredged up the hoary isolationist slogan, “America First” to signal his rejection of key pillars of America’s post-war internationalist strategy — open trade, security alliances and the formation of world bodies dedicated to collective problem-solving.
We may be on the verge of a titanic shift in how drug prices are set. It’s been led by a dramatic decline in insulin prices, but it’s spreading to other brand drugs as well. This new paradigm is the unintended but welcome result of legislative, regulatory, and market pressures exerted on the biopharmaceutical industry.
The big change: the three major insulin manufacturers decided to sell their medicines at a set low out-of-pocket price for all patients. The previous list prices offered for insulin were bloated by all manners of rebates, discounts, and fees necessary for the byzantine rebate contracting model promoted by the pharmacy benefit managers (PBM) and state Medicaid programs. The new list prices are stripped of all the extraneous baggage and now closely reflect the actual net payments received by manufacturers. In other words, with a straightforward move, pharmaceutical companies Lilly, Sanofi, and Novo Nordisk cut out the middlemen, the PBMs, and others who benefit handsomely by keeping some or all of the rebates, discounts, and fees provided by those companies.
But that’s not all: another brand manufacturer has started selling its brand-name diabetes medicine directly to patients at a significant discount through an innovative retail pharmacy outfit. The reduced price is 50% of the drug’s average retail price. This move helps patients saddled with substantial deductibles and co-insurance since those out-of-pocket costs are calculated based on the inflated retail prices when they utilize their insurance benefit — not the significantly lower prices negotiated by the PBMs that never reach the pocketbook of patients who are consuming those medicines. Furthermore, patients can continue to benefit from patient assistance programs offered by biopharmaceutical manufacturers.
Republicans have refused to raise or suspend the debt limit – which multiple independent forecasters have warned could cause the government to default on its debts for the first time in history as soon as June 1st – unless “substantive reforms” to federal spending are made. Biden spent most of this year refusing to indulge in the GOP’s hostage-taking but agreed to negotiate on a broader budget deal once Republicans made an opening offer. After Republicans coalesced around a position by passing the Limit, Save, Grow Act through the House, both sides began negotiations this week in the hopes of striking a deal that Republicans could claim is a precursor to raising the debt limit and Democrats could claim is independent.
Part of the challenge is that Republicans have entered into the negotiation with extreme positions that no Democrat could ever accommodate. The GOP’s bill would raise the debt limit through early next year and pair that increase with $4.5 trillion of spending cuts over the coming decade and other conservative policy changes. Cuts of this magnitude might make sense in the context of a balanced and comprehensive package that addresses all areas of the budget, including raising new revenues – particularly at a time when inflation remains high and our projected long-term debt growth is unsustainable. But the conditions Republicans have imposed to target these cuts are unrealistic at best and economically ruinous at worst.
Political commentators Sam Freedman and Ayesha Hazarika are joined by Alistair Campbell, and Keir Starmer’s former policy advisor Claire Ainsley, for the first episode of The Power Test – a political podcast that asks if it’s really all over for the Tories, and what Labour should do to win and change Britain for the better.
With the help of invited guests, each week Sam and Ayesha bring the biggest, trickiest and most difficult political issues into focus and put fresh ideas, messages and policies to the test to see if they are capable of winning popular support and delivering real change in government.
In this first episode, Sam and Ayesha speak with two former senior Labour figures about how the party is doing, and what Labour needs to do to get into power.
In part 1 of this two part series, PPI’s Reinventing America’s Schools (RAS) Project Co-Director Curtis Valentine, in collaboration with EdChoice, sits down for a live panel conversation and podcast recording at the ASU+GSV Summit in San Diego with Nina Gilbert, Executive Director of the Center for Excellence in Education at Morehouse College, and Sharhonda Bossier, Chief Executive Officer of Education Leaders of Color. They discuss the future of education, the future of teaching, and importance of school choice for families across America.
Learn more about the Reinventing America’s Schools Project here.
Learn more about the Progressive Policy Institute here.
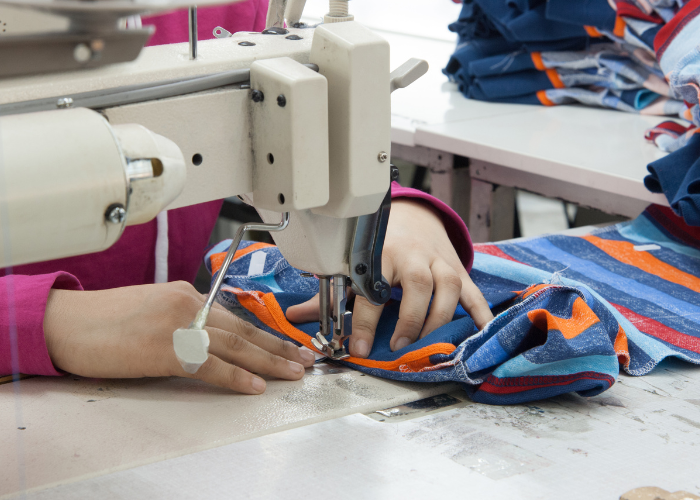
FACT: Height of papers needed to qualify T-shirt as ‘CAFTA duty-free’: ~ four inches.
THE NUMBERS: U.S. clothing import growth, 2005-2022* –
World
+$30.2 billion
Vietnam
+$15.7 billion
Bangladesh
+$7.3 billion
China
+$4.0 billion
Cambodia
+$2.8 billion
India
+$2.8 billion
Indonesia
+$2.8 billion
Pakistan
+$1.6 billion
CAFTA/DR**
+$1.4 billion
Jordan
+$0.9 billion
Egypt
+$0.8 billion
Italy
+$0.8 billion
Haiti
+$0.6 billion
Kenya
+$0.3 billion
Ethiopia
+$0.3 billion
Peru
+$0.2 billion
Colombia
-$0.3 billion
Korea
-$1.0 billion
Mexico
-$2.6 billion
Hong Kong
-$3.5 billion
* * Counting from completion of CAFTA/DR. See below for a more recent count of change 2012-2022.
** Guatemala, El Salvador, Honduras, Nicaragua, Costa Rica, and the Dominican Republic as a group. More detail: Nicaragua +$2.0 billion, Honduras +$0.6 billion, El Salvador +$0.3 billion, Guatemala +$0.1 billion, Costa Rica -$0.5 billion, Dominican Republic -$1.2 billion.
WHAT THEY MEAN:
CBP’s “border encounter” statistics show about 34,000 Central Americans reaching the U.S.’ southern border each month so far this year. Ten years ago, following their trek north in his book The Beast* (2010) Salvadoran journalist Oscar Martinez recounts stories of gang kidnappings and extortion, rape and sexual abuse, fatal falls from the roofs of trains along the way, and likely arrest at the end. Asking himself in closing why anyone would make such a trip, Martinez decides that the largest cause is simple:
“They’re unable to accept that miserable routine of waking up at five in the morning to travel two hours on a dangerous public transit system to get to a fast-food restaurant or a market or a warehouse in San Salvador, or Tegucigalpa, or Guatemala City, where they spend the whole day toiling away at undignified work only to return to their small homes, dog-tired, making a measly minimum wage that barely lets them afford beans and tortillas for their children.”
Vice President Kamala Harris makes a similar comment in a February conference on the “Northern Triangle” (Guatemala, Honduras, and El Salvador):
“[P]eople generally do not want to leave home. And when they do, it is because they are either fleeing some harm or because staying home will mean that they cannot satisfy the basic needs of their family and themselves.”
The conclusion drawn from their comments — that if the U.S. has a particular interest easing political stress and migration pressure in Central America, American policy should encourage investment and higher-quality employment — has a forty-year history. Four decades ago, the Ronald Reagan/Tip O’Neill “Caribbean Basin Initiative” aimed to encourage clothing-making in Central America by waiving U.S. tariffs under a complex legal formula known as “Section 807,” which offered buyers of Central American-made clothes duty-free treatment so long as the shirts, blouses, etc. were made of U.S.-produced fabric. The hope was that a growing garment industry would create many jobs, dampen the economic volatility arising from heavy reliance on fruit and coffee exports, reduce the social temperature, and so ease peace-making. A decade later, Central American maquiladora factories — long lines of sewing machines operated by young women; complementary male employment in factory repair, and transport — provided $4.8 billion of America’s $39.4 billion in clothing imports, or about eighth (by value) of the total.
After 20 years, the “CAFTA-DR” – the full and permanent Free Trade Agreement now joining the U.S. with Guatemala, El Salvador, Honduras, Nicaragua, Costa Rica, and the Dominican Republic – replaced the CBI in phases from 2005 through 2009. Its hope was that a permanent agreement would make the region more competitive and build buyer confidence. But in practice, this hasn’t exactly happened. Though Central America’s clothing trade has grown a bit in dollar terms, despite its tariff advantage the region’s share of U.S. imports has dropped from 12.3% in 2005 to 10.1% in 2022. Though CAFTA-DR clothes have no tariff, while as of 2022 Asian clothes were taxed at an average of 18.8%,** most new clothing imports in the last two decades have come from Asia. (China in the 2000s, Vietnam and Bangladesh in the 2010s and 2020s). Also a bit striking: imports from FTA partner Jordan and ‘preference’ beneficiary Haiti (which operates under another upgrade of CBI rather than a free trade agreement), though smaller overall, have grown much faster than imports from the CAFTA-DR countries.
Why? A plausible explanation is the complexity and costliness of the CAFTA/DR agreement. Like its CBI predecessor, CAFTA-DR retains a clause — known as a “yarn-forward rule” in apparel-trade jargon — requiring nearly all of (say) a T-shirt’s cloth and yarn*** to be made in the U.S. or a CAFTA country to qualify it for duty-free status. This means very restricted supply options for garment factories — to cite FTA partners only, no high-quality Peruvian cotton, no Colombian cloth, no Korean yarn or thread. Furthermore, CAFTA/DR includes a 143-page list of “product-specific rules of origin” writing special provisions for individual products meant to suit the very specific business models of many individual U.S. firms as of 2005. As a case in point, the agreement’s denim rules were meant to guide Central American manufacturers to fabric from a particular U.S. mill in North Carolina. As a sample of the daunting legal language this entails, here’s a passage drawn from the 2007 “textile amendment” requiring users to monitor the width of wool in the lining of jackets and skirts down to the half-micron:
“Chapter Rule 1 Except for fabrics classified in tariff item 5408.22.aa, 5408.23.aa, 5408.23.bb, or 5408.24.aa, the fabrics identified in the following headings and subheadings, when used as visible lining material in certain men’s and women’s suits, suit-type jackets, skirts, overcoats, carcoats, anoraks, windbreakers, and similar articles, other than men’s and boys’ and women’s and girls’ suits, trousers, suit-type jackets and blazers, vests, and women’s and girls’ skirts of wool fabric, of subheadings 6203.11, 6203.31, 6203.41, 6204.11, 6204.31, 6204.51, 6204.61, 6211.39, or 6211.41, provided that such goods are not made of carded wool fabric or made from wool yarn having an average fiber diameter of less than or equal to 18.5 microns, must be both formed from yarn and finished in the territory of one or more of the Parties: 51.11 through 51.12, 5208.31 through 5208.59, 5209.31 through 5209.59, 5210.31 through 5210.59, 5211.31 through 5211.59, 5212.13 through 5212.15, 5212.23 through 5212.25, 5407.42 through 5407.44, 5407.52 through 5407.54, 5407.61, 5407.72 through 5407.74, 5407.82 through 5407.84, 5407.92 through 5407.94, 5408.22 through 5408.24, 5408.32 through 5408.34, 5512.19, 5512.29, 5512.99, 5513.21 through 5513.49, 5514.21 through 5515.99, 5516.12 through 5516.14, 5516.22 through 5516.24, 5516.32 through 5516.34, 5516.42 through 5516.44, 5516.92 through 5516.94, 6001.10, 6001.92, 6005.31 through 6005.44, or 6006.10 through 6006.44.
Compliance with these rules requires 31 classes of documents ranging from bills of lading and employee time-cards to contracts with dyers and finishers, invoices, proofs of payment and so on; the resulting sheaf of paper is said typically to be about four inches high. Apart from the cost and lawyer-hours involved in verifying all this, rules designed for specific products from particular factories tend to lose relevance over time. In the denim case, the plant in question closed after a chemical accident in 2017, and since then Guatemala, El Salvador, and Honduras have stopped selling jeans to the U.S.
Thus CAFTA producers have been treading water as full-tariff competitors in Southeast Asia boomed. The Jordan agreement and the Haiti programs, simpler as they require only a showing of local added value rather than requiring detailed sourcing, appear much more successful.
Turning back now to Martinez’ journalism and Vice President Harris’ observation, the main point – to lower social temperatures and reduce migration pressure — still seems like a strong one. With it in mind, can we do better? Could individual pieces of the CAFTA/DR that are no longer relevant – perhaps the denim piece — be scrapped? Could Congress allow Central American factories to use cloth and yarn from FTA partners, or Latin America generally? Or perhaps the whole thing might be redone, merged with the “USMCA” and the string of smaller FTAs going south from Panama to Colombia, Peru, and Chile?
* A bit dated as a description of the migrant route around 2010, but still relevant. ‘The Beast’, La Bestia, is a migrant nickname for southern Mexican freight trains.
** Counting Chinese products, many of which are subject to the Trump administration’s additional “301” tariffs. The 2022 rate for Asian clothes excluding Chinese-made goods was 16.6%.
*** Using a cotton T-shirt because this (HTS 61091000) is the top import from the CAFTA/DR countries, at $2.8 billion of the U.S.’ $35 billion in total imports (everything, clothes, coffee, oil, mangoes, etc.) from these countries last year.
Clothing and textile import data in various forms from the Commerce Department’s Office of Textiles and Apparel.
The CAFTA/DR:
Full agreement text for CAFTA/DR; see Chapter 4, Annex 4.1 and “Textiles Amendment” for clothing rules.
An alternative clothing-import table:
The chart at the top counts from the signature of CAFTA/DR in 2005. A more recent count, looking at the decade 2012 to 2022 would be somewhat different, with China down rather than up, Vietnam and Bangladesh getting almost 2/3 of all new imports, and slightly higher growth for the CAFTA/DR countries. Same table, though a bit shorter:
World
+$23.6 billion
Vietnam
+$11.3 billion
Bangladesh
+$5.3 billion
India
+$2.8 billion
CAFTA/DR
+$2.7 billion*
Cambodia
+$2.0 billion
Pakistan
+$1.4 billion
Jordan
+$1.0 billion
Italy
+$1.0 billion
Sri Lanka
+$0.7 billion
Indonesia
+$0.7 billion
Turkey
+$0.7 billion
Egypt
+$0.5 billion
Haiti
+$0.6 billion
Peru
+$0.4 billion
Madagascar
+$0.4 billion
Burma
+$0.4 billion
Kenya
+$0.3 billion
Ethiopia
+$0.3 billion
Colombia
+$0.1 billion
Mexico
-$0.2 billion
China
-$8.4 billion
*Within CAFTA/DR, totals are Nicaragua +$1.4 billion, Guatemala +$0.7 billion, Honduras +$0.6 billion, El Salvador +$0.1billion, Dominican Republic unchanged, Costa Rica -$0.2 billion.
ABOUT ED
Ed Gresser is Vice President and Director for Trade and Global Markets at PPI.
Ed returns to PPI after working for the think tank from 2001-2011. He most recently served as the Assistant U.S. Trade Representative for Trade Policy and Economics at the Office of the United States Trade Representative (USTR). In this position, he led USTR’s economic research unit from 2015-2021, and chaired the 21-agency Trade Policy Staff Committee.
Ed began his career on Capitol Hill before serving USTR as Policy Advisor to USTR Charlene Barshefsky from 1998 to 2001. He then led PPI’s Trade and Global Markets Project from 2001 to 2011. After PPI, he co-founded and directed the independent think tank Progressive Economy until rejoining USTR in 2015. In 2013, the Washington International Trade Association presented him with its Lighthouse Award, awarded annually to an individual or group for significant contributions to trade policy.
Ed is the author of Freedom from Want: American Liberalism and the Global Economy (2007). He has published in a variety of journals and newspapers, and his research has been cited by leading academics and international organizations including the WTO, World Bank, and International Monetary Fund. He is a graduate of Stanford University and holds a Master’s Degree in International Affairs from Columbia Universities and a certificate from the Averell Harriman Institute for Advanced Study of the Soviet Union.
PPI’s Reinventing America’s Schools (RAS) Project has a new podcast series on titled “WHAT NEXT: The Future is Now!” recorded at the SXSW Education conference in Austin, Texas. In the fifth and final episode of this five-part series, RAS co-director sits down with Janelle Wood, Founder and CEO of the Black Mothers Forum.
National Security Advisor Jake Sullivan’s April 27 speech at the Brookings Institution, explaining the Biden administration’s global-economy policies, is an odd piece at an important time. Mr. Sullivan covers a lot of ground in a lengthy (4,981-word) speech: “industrial strategy” and subsidies; trade and tariffs; the U.S. relationship with China; brief excursions into finance, aid, and infrastructure, and so on. Parts of it work well, in particular his passage on China policy. Some other parts less so. That on trade especially is a sort of study in breezy mis-summarization of history, muddy elucidation of current choices, and unclear future direction.
Most important, when taken as a whole and given its timing just as the 2024 presidential campaign begins, the speech seems to be politically out of tune and picking the wrong targets. It is vigorous if defensive in rebuking the Biden administration’s liberal-internationalist friends for their worries that it may be overreaching in industrial strategy and under-reaching in trade policy. It is premature at best in positing that the administration’s global-economy agenda has achieved consensus status as the “project of the 2020s and 2030s,” and does not recognize — despite warnings from allies as important and close to the subject as Japan — the strength of the Chinese counter-“project.” And while spending lots of time in an argument with the 1990s, it elides not only the recent Trump administration record but the domestic political challenge from the administration’s Trumpist/isolationist enemies — which, in a few months, will seek to end the Biden administration, and with it not only Sullivan’s version of international economics but the 80-year liberal-internationalist legacy the speech rightly praises.
“Industrial” 517,000 Electronics 136,000
Automotive 121,000
All other 260,000
Specialized services 121,000
“Consumer” 19 million
* International Federation of Robotics, 11/22
WHAT THEY MEAN:
Reporting from Guangzhou last November, Reuters finds Chinese workers losing interest in manufacturing work:
“More than 80% of Chinese manufacturers faced labor shortages ranging from hundreds to thousands of workers this year, equivalent to 10% to 30% of their workforce, a survey by CIIC Consulting showed. China’s Ministry of Education forecasts a shortage of nearly 30 million manufacturing workers by 2025.”
The article’s young blue-collar Chinese interlocutors now prefer additional education or finding jobs in services (and a startlingly large number, Reuters also says, are “adopting a minimal lifestyle known as ‘lying flat,’ doing just enough to get by and rejecting the rat race of China Inc.”) China’s factories seem, however, to be adapting – in part by trying to offer higher wages, but also by hiring metal and plastic stand-ins. The International Federation of Robotics’ annual snapshot of the robot universe, World Robotics 2022, reports that over half of last year’s 517,385 newly employed industrial robots last year went to work in China, and that Chinese factories are now more robot-heavy than America’s:
“Every other robot globally installed in 2021 ended up in China: Installations surged by 51% to 268,195 units.”
On a broader scale, IFR’s report divides the new-robot picture into three parts:
Industrial robots: Last year’s Chinese robot surge was unusually large, but also reflects a trend sustained over the past decade. China is now by far the world’s top industrial-robot employer, home to 1.22 million working factory robots, or over a third of the world’s 3.48 million total. A contributor to this is the shifting industry-sector balance of robot use: auto plants (especially in the U.S., Japan, Korea, and Germany) were the first and historically the largest employers of robots, but have been surpassed at least in raw numbers by the electronics industry.
By this total count, China is the world’s robot metropolis. A different perspective — the ratio of robots to human workers — finds neighboring Korea easily eclipsing even China’s mighty robot army. The Korean government reports exactly 1,000 robots for every 10,000 Korean factory workers, far ahead of second-place Singapore’s 670 robots per 10,000 factory workers. After them comes Japan at 399 and Germany at 397; China is sixth at 322; and Taiwan and the U.S. essentially tie for eighth at 276 and 274 respectively. (The world average is 141.) Japan, finally, is likely the industrial-robot production center; though this year’s report doesn’t have a figure, last year’s cited Japan as producing 45% of industrial robots.
Specialized services robots: Robot services professionals are fewer in numbers than their proletarian factory cousins — 121,000 new ones last year, about a quarter of the 517,000 new industrials — and (like the human “services sector”) are very diverse. The largest group, 49,500, went to work in logistics, carrying packages in warehouses and delivery centers, and moving industrial components through factories. Another 20,000 took “hospitality” jobs, such as ferrying food from kitchen to table in large restaurants* or greeting customers; 14,800 went to work in hospitals, clinics, or emergency medical services, 12,600 in industrial cleaning work, and about 8,000 in farms, dairy, and ranching. IFR’s report regrettably doesn’t have figures on the countries in which these high-skill robots are lighting up, but notes that (in some contrast to the industrial-robot world, where Japan is the largest producer and neighbors Korea and China the leading users), the U.S. is the largest services-robot manufacturer.
Homes: Finally, 19 million humble domestic robots went to work in homes, mainly for interior cleaning and vacuuming, but also for lawn-mowing.
* The Trade Fact series editor encountered two attentive and polite restaurant robots at a restaurant in Chiang Rai in the northern reaches of Thailand in February. Thai industrial-robot installation rose by 36% last year, to about 4,000.
FURTHER READING:
Chinese workers not so interested in factory jobs.
… but no worries, here are the metal and plastic replacements. Global highlights from the International Federation of Robotics’ World Robotics 2021.
… and IFR’s closer looks at industrial and services robots.
The New York-based Institute of Electrical and Electronics Engineers has a weekly new-robot video. Try the prototype seabed-cleaning jellyfish-robot.
A few looks ahead, and one look back, from robot arts and lit:
Capek’s R.U.R. (1921) invented the word “robot,” and the classic “robot uprising” plot. The title acronym stands for a fictional “Rossum’s Universal Robots” company, with “Rossum” a slightly modified version of the Czech word for “reason,” and “robot” likewise an adapted term for “worker.” A Penn State robotics academic looks at R.U.R. a century later.
In robot-friendly Japan, by contrast, Astro-Boy (said to be the first anime character) is a helpful friend to humanity.
Stanislaw Lem’s “Mortal Engines” collection speculates about machine intelligence. In “The Hunt”, a well-meaning human pilot volunteers to destroy a supposedly mad robot; next, in “Mask,” a troubled, self-aware female robot-assassin tracks down a political dissident.
Philip K. Dick thought humans and robots would lose the ability to distinguish themselves from one another.
And Adrienne Mayer’s Gods and Robots: Myths, Machines, and Ancient Dreams of Technology takes the long look back, at visions of androids, flying cars, computers, and other semi-inventions in classical Greece, with comparators from India, Babylon, and the mechanical men of the Qin Dynasty court.
ABOUT ED
Ed Gresser is Vice President and Director for Trade and Global Markets at PPI.
Ed returns to PPI after working for the think tank from 2001-2011. He most recently served as the Assistant U.S. Trade Representative for Trade Policy and Economics at the Office of the United States Trade Representative (USTR). In this position, he led USTR’s economic research unit from 2015-2021, and chaired the 21-agency Trade Policy Staff Committee.
Ed began his career on Capitol Hill before serving USTR as Policy Advisor to USTR Charlene Barshefsky from 1998 to 2001. He then led PPI’s Trade and Global Markets Project from 2001 to 2011. After PPI, he co-founded and directed the independent think tank Progressive Economy until rejoining USTR in 2015. In 2013, the Washington International Trade Association presented him with its Lighthouse Award, awarded annually to an individual or group for significant contributions to trade policy.
Ed is the author of Freedom from Want: American Liberalism and the Global Economy (2007). He has published in a variety of journals and newspapers, and his research has been cited by leading academics and international organizations including the WTO, World Bank, and International Monetary Fund. He is a graduate of Stanford University and holds a Master’s Degree in International Affairs from Columbia Universities and a certificate from the Averell Harriman Institute for Advanced Study of the Soviet Union.